Introduction
Ghumusar goats form a local goat population of Orissa, which is found in the western part of Ganjam district, i.e. Bhanjanagar and its adjoining areas of Ghumusar tehsil of Orissa. The Ghumusar goats are known for good meat quality, early maturity and high prolificacy (Patro et al., Reference Patro, Nayak, Rao and Panda2007). The body size is bigger than that of Black Bengal, but smaller than Ganjam goats, the two well-known meat breeds of goat found in Orissa. The Ghumusar goats had higher body weights at birth compared with Bengal-type goats. Their overall mean of body weights at birth, 3, 6, 9 and 12 months of age are 1.75 ± 0.02, 7.14 ± 0.04, 10.18 ± 0.03, 13.01 ± 0.03 and 17.05 ± 0.03 kg, respectively (Patro et al., Reference Patro, Nayak, Rao and Panda2007). These goats have lower first kidding age compared with Ganjam goats, but closer to that of Black Bengal goats (Rao et al., Reference Rao, Dash, Patro and Nayak2002). Twins are very common (62.5 percent), whereas triplets are not very common (8.0 percent). Limited information is available on the phenotype and performance of these goats, but no information on genetic diversity occurring within the Ghumusar goat population. Knowledge of genetic variability existing in a population is of utmost importance to frame any breeding programme for the propagation and genetic improvement of a breed. Therefore, an attempt has been made to know the within-population genetic variability occurring in Ghumusar goat population. The results of this study can be exploited for planning the breeding strategies to propagate and genetically improve this goat population.
Materials and methods
DNA isolation and polymerase chain reaction (PCR) amplification
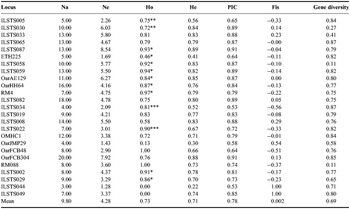
Blood samples were collected from randomly selected 50 animals distributed in the breeding tract. Care was taken that the sampled animals do not have the common parentage. Genomic DNA was isolated following the standard phenol/chloroform protocol (Sambrook, Fritsch and Maniatis Reference Sambrook, Fritsch and Maniatis1989). A battery of 25 microsatellite markers given in Table 1 was used for genetic diversity assessment of Ghumusar goat population. PCR was carried out using the standardized parameters following the touchdown-PCR protocol used by us for the amplification of genomic DNA (Verma et al., Reference Verma, Dixit, Aggarwal, Chander, Kumar and Ahlawat2007a, Reference Verma, Dixit, Kumar, Aggarwal and Ahlawatb; Dixit et al., Reference Dixit, Verma, Aggarwal, Vyas, Rana, Sharma, Tyagi, Arya and Ulmek2010). In brief, amplification for each primer was performed in a 10 µl final reaction volume containing 50 ng of genomic DNA, 10 pmol of each primer, 10 mM dNTPs, 0.5 µl Taq polymerase and 10X buffer. The amplification was carried out for 35 cycles with initial denaturation at 95 °C for 10 min, second denaturation at 95 °C for 30 s, annealing with different temperatures up to 1 min, extension for 45 s at 72 °C and final extension for 7 min at 72 °C. The amplified products were checked by electrophoresis on 2% (w/v) agarose gel. After ensuring the amplification, the PCR products were run on an automated DNA sequencer.
Number of alleles, heterozygosity, PIC, inbreeding estimates and genetic diversity in Ghumusar goat population.

Na, observed no. of alleles; Ne, effective no. of alleles; Ho, observed heterozygosity; He, expected heterozygosity; PIC, polymorphic information contents; Fis, within population inbreeding.
*P < 0.05, **P < 0.01, ***P < 0.001.
Genotyping
The PCR products were mixed in a ratio of 1:1.5:2:2 of FAM (blue), VIC (green), NED (yellow) and PET (red) labelled primers, respectively. The multiplexed mixture (0.5 µl) was combined with 0.3 µl of Liz 500 as internal lane standard (Applied Biosystems, USA) and 9.20 µl of Hi-Di Formamide per sample. The resulting mixture was denatured by incubation for 5 min at 95 °C and sequenced on automated DNA sequencer. The electropherogram drawn through GeneScan was used to extract sizing details of DNA fragment using Gene Mapper software (version 3.0).
Statistical analysis
Different measures of within-breed genetic variations, namely total number of alleles, allele frequencies, effective number of alleles (Ne), observed heterozygosity (Ho), expected heterozygosity (He), were estimated using the POPGENE software package (Yeh et al., Reference Yeh, Boyle, Rongcai, Ye and Xian1999).
Polymorphism information content (PIC) for each locus was calculated according to Botstein et al. (Reference Botstein, White, Skolnick and Davis1980). The within-population inbreeding estimate (Fis) at each microsatellite locus was estimated using the FSTAT version 2.9.3.2 computer program (Goudet, Reference Goudet2002). Gene diversity that measures the average expected heterozygosity at each locus was also estimated by the same software.
To detect whether the Ghumusar goat population has experienced a reduction in the effective population size (genetic bottleneck), two different approaches were followed. In the first approach, based on heterozygosity excess (Hee), two different tests, namely a “sign test” and a “Wilcoxon sign-rank test”, were employed under different models of microsatellite evolution like, the infinite allele model (IAM), stepwise mutation model (SMM) and two-phased model (TPM) of mutation. The second approach was the graphical representation of the mode-shift indicator proposed by Luikart and Cornuet (Reference Luikart and Cornuet1998). These two approaches were conducted using Bottleneck v1.2.02 software (http://www.ensam.inra.fr/URLB; Cornuet and Luikart (Reference Cornuet and Luikart1996)).
Results and discussion
Phenotypic attributes
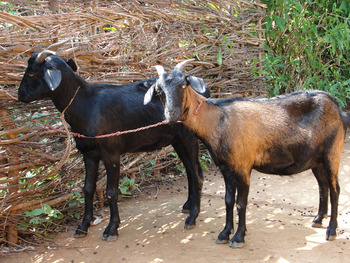
The Ghumusari goats are medium-sized goats, coat colour is predominantly black and brown, but animal with white and brown sports are also seen (Figure 1). The hair is short and lustrous. Face is straight and forehead is prominent. Both the sexes are horned. Horns are long, flat, directed upward and backward. Ears are medium in size and kept straight or horizontal.
Colour variants of Ghumusar goats.

Microsatellite markers
The precision of microsatellite-based genetic variability depends on the type and number of markers and the polymorphism they can detect at the loci (Barker, Reference Barker1994). Therefore, the suitability of markers was studied by knowing the number of alleles at different loci and PICs. In the present investigation, the markers used are neutral and are widely distributed in the genome, their chromosomal locations are given somewhere else (Verma et al., 2007a). Most of the microsatellites of this battery have been used to study the genetic variability in other Indian goat breeds such as Marwari (Kumar et al., Reference Kumar, Dixit, Sharma, Pandey and Sirohi2005), Attapaddy (Aggarwal et al., Reference Aggarwal, Dixit, Verma, Ahlawat, Kumar, Kumar, Chander and Singh2007), Sirohi (Verma et al., Reference Verma, Dixit, Aggarwal, Chander, Kumar and Ahlawat2007a), Kutchi (Dixit et al., Reference Dixit, Verma, Ahlawat, Aggarwal, Kumar and Singh2008), Gohilwadi (Kumar et al., Reference Kumar, Dixit, Verma, Singh, Pande, Chander and Singh2009), Southern Indian goat breeds (Dixit et al., Reference Dixit, Verma, Aggarwal, Vyas, Rana, Sharma, Tyagi, Arya and Ulmek2010), Changthangi (Mishra et al., Reference Mishra, Verma, Aggarwal and Dixit2010) and Konkan Kanyal (Mishra et al., Reference Mishra, Ali, Aggarwal, Dixit, Kawitkar, Dangi and Verma2012). All the microsatellite markers were amplified successfully in Ghumusar goats also.
Genetic variability
The locus-wise number of alleles, heterozygosity and polymorphic information contents for all microsatellite markers used in the present study are presented in Table 1. A total of 247 alleles were observed for the 25 microsatellite loci. The observed number of alleles per locus ranged from 3.00 (ILSTS044) to 20.00 (OarFCB304) with a mean of 9.80 alleles per locus, whereas Ne ranged from 1.28 (ILSTS044) to 8.54 (ILSTS087) with a mean of 4.28. It has been suggested by Barker (Reference Barker1994) that locus with at least four alleles should be considered for diversity analysis. In the present study, majority of the markers (except ILSTS044) exhibited more than four alleles. Higher number of alleles for most of the loci indicated that all the markers were appropriate to study the genetic diversity. This is supported by the higher range of PIC values, which ranged from 0.53 (ILSTS34) to 0.91. All of the 25 microsatellite loci had PIC values greater than 0.5 indicating their high degree of informativeness for population genetic studies (Botstein et al., Reference Botstein, White, Skolnick and Davis1980). The mean observed number of allele estimated in Ghumusar goat population was higher than that of Jakhrana goat breed (Verma et al., Reference Verma, Dixit, Kumar, Aggarwal and Ahlawat2007b) and Marwari goat breed (Kumar et al., Reference Kumar, Dixit, Sharma, Pandey and Sirohi2005). However, higher values were reported by Mishra et al. (Reference Mishra, Verma, Aggarwal and Dixit2010) in Changthangi goats, Verma et al. (Reference Verma, Dixit, Aggarwal, Chander, Kumar and Ahlawat2007a) in Sirohi goats and Kumar et al. (Reference Kumar, Dixit, Verma, Singh, Pande, Chander and Singh2009) in Gohilwadi goats.
The Ho ranged from 0.00 (ILSTS044, ILSTS049) to 1.00 (RM088) with mean 0.73, while the expected ranged from 0.22 (ILSTS044) to 0.89 (ILSTS087) with mean 0.71 (Table 1). The Hos differed from expected values positively or negatively at most of the loci. The heterozygote deficiency was observed at about 36% loci. At 13 loci (ILSTS005, ILSTS087, ILSTS059, OarHH64, RM4, ILSTS034, ILSTS019, ILSTS022, OarFCB48, RM088, ILSTS002 and ILSTS029) the Ho was more than the expected values indicating an excess of heterozygotes, but the mean Ho was not significantly different from the expected one. The deviation of heterozygosity from the expected values may be due to the selection for/against heterozygotes, null alleles, population subdivision owing to the genetic drift however, pinpointing the exact reason is difficult. The high genetic diversity was also observed in northern Indian goat breeds by many workers (Kumar et al., Reference Kumar, Dixit, Sharma, Pandey and Sirohi2005, Reference Kumar, Dixit, Verma, Singh, Pande, Chander and Singh2009; Verma et al., Reference Verma, Dixit, Aggarwal, Chander, Kumar and Ahlawat2007a, Reference Verma, Dixit, Kumar, Aggarwal and Ahlawatb; Dixit et al., Reference Dixit, Verma, Ahlawat, Aggarwal, Kumar and Singh2008, Reference Dixit, Verma, Aggarwal, Vyas, Rana, Sharma and Chander2011; Rout et al., Reference Rout, Joshi, Mandal, Laloe, Singh and Thangaraj2008; Mishra et al., Reference Mishra, Verma, Aggarwal and Dixit2010, Reference Mishra, Ali, Aggarwal, Dixit, Kawitkar, Dangi and Verma2012). Similar observation was made in Chinese goats (Li et al., Reference Li, Chen, Lan, Kong and Min2008), Spanish and Egyptian goats (Serrano et al., Reference Serrano, Calvo, Martinej, Marcos-Carcavila, Cuevas, Gonzalez, Jurado and Tejada2009) and Italian goats (Muema et al., Reference Muema, Wakhungu, Hanotti and Jianlin2009). The values of Nei's gene diversity in Ghumusar goat population was lowest (0.11) for ILSTS058 and RM088 and highest (0.87) for ILSTS065 and ILSTS034 with mean 0.69.
Fis is an estimate of variation within population that measures the homozygosity or reduction in heterozygosity in an individual that occurs because of non-random mating within population. Among negative values, Fis ranged from −0.56 (ILSTS034) to −0.01 (OMHC1), whereas positive values ranged from 0.05 (ILSTS082) to 1.00 (ILSTS044, ILSTS049). The positive value indicates within-population inbreeding directly or indirectly resulting in the increase in homozygosity and reduction in heterozygosity. The negative Fis indicated the excess of heterozygotes. The overall Fis value was observed to be 0.002, which showed the marginal global deficit of heterozygotes.
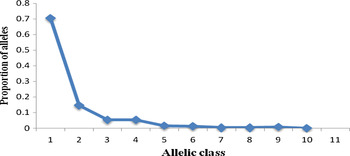
The Ghumusar goat population was evaluated for mutation-drift equilibrium to detect the occurrence of genetic bottleneck (reduction in effective population size) in the recent past. Three different tests were performed to detect the Hee/deficiency under the assumption of three different mutation models namely IAM, SMM and TPM, and the values for different estimates are given in Table 2. Under sign test, expected number of loci with Hee was 14.88, 14.79 and 14.74 for IAM, SMM and TPM, respectively. The observed number of loci with heterozygotic excess (He) was 14, 8 and 2 under these three models, respectively. Under all the models He was less than Hee. This difference was significant under SMM and TPM and thus, the null hypothesis of mutation-drift equilibrium is rejected except for IAM. Under standardized difference test, the statistics T2 is equal to 0.449, −4.357 and −2.347 for IAM, TPM and SMM, respectively. All the values are significantly lower than 1.645, the tabulated value of normal distribution, therefore, accepting the hypothesis of mutation-drift equilibrium (absence of bottleneck) in the population. The negative value of T2 indicated that the expansion in population size may be because of immigration of some private (unique) alleles in population. Similar results were obtained with Wilcoxon sign-rank test that gave probability values of 0.2209, 0.9915 and 1.0000. All the values are significantly higher than 0.05 and again supports the acceptance of null hypothesis. Another test that can be utilized to test the bottleneck is the mode shift that is a qualitative graphical test of Luikart and Cornuet (Reference Luikart and Cornuet1998). The method utilizes allelic classes and proportion of alleles occurring in Ghumusar goat population. The curve obtained (Figure 2) showed a normal L-shaped distribution of allele frequencies without any mode shift indicating the absence of any genetic bottleneck in the recent past. The shift mode test can detect the bottleneck up to 40–80 generations, while the quantitative test of Cornuet and Luikart (Reference Cornuet and Luikart1996) can detect bottleneck up to 250 generations.
L-shaped distribution of allele frequencies in Ghumusar goat population.

Mutation drift equilibrium, He/deficiency under different mutation models in Ghumusar goats.

IAM, infinite allele model, TPM, two-phase model; SMM, stepwise mutation model.
Conclusion
The study thus presents valuable insight into the existing genetic variability in Ghumusar goat population. All the microsatellite markers amplified satisfactorily and exhibited allelic polymorphism. Therefore, high genetic diversity was found in Ghumusar goat population as measured by the high values of polymorphic information content per locus and by heterozygosity in the population that indicated the presence of genetic variability. Substantial genetic diversity and polymorphism observed across the loci in Ghumusar goat population could be exploited for designing the appropriate breeding strategies for the propagation and improvement of these goats.
Acknowledgements
The authors are thankful to the Director (NBAGR) for providing the facilities to carry out this piece of work and also to the goat keepers for permitting the blood samplings from their animals.