Introduction
Adverse prenatal environmental conditions are known to induce permanent adaptive changes in the developing foetus that may promote short-term survival but may increase vulnerability to metabolic and cardiovascular injuries. These processes, according to the developmental origins of adult disease hypothesis,Reference Barker, Eriksson, Forsén and Osmond 1 – Reference Langley-Evans and McMullen 3 constitute intrauterine programming that can result in adult disease that originated in utero. Moderate reduction in food intake has well-known systemic consequences, including weight loss and a decrease in fat mass.Reference Ravussin, Burnand, Schutz and Jéquier 4 , Reference Rosenbaum, Murphy, Heymsfield, Matthews and Leibel 5 Diet restriction of 40% was associated with significantly increased corticosterone concentrations and led to significant reductions in the amount of serum thyroid-stimulating hormone, leptin, metabolic rate and body mass.Reference Araujo, de Andrade and de Figueiredo 6 , Reference Hao, Avraham, Mechoulam and Berry 7 Studies supporting this intrauterine programming hypothesis have demonstrated that adverse foetal or neonatal environmental conditions such as undernutrition result in adaptive responses leading to structural and molecular alterations in various organs and tissues.Reference Langley-Evans 8 – Reference Luzardo, Silva and Einicker-Lamas 11
Different experimental models have shown a decrease in the number of nephrons in the offspring after maternal undernutrition throughout pregnancy in the rat.Reference Langley-Evans 12 – Reference Woods and Rasch 16 But the postnatal period is also crucial in determining the final nephron number; as a recent study has demonstrated a normal lactation environment could even repair the effect of intrauterine growth restriction on nephron number.Reference Paixão, Maciel, Teles and Figueiredo-Silva 14 In the rat, <20% of nephrons are formed at birth; nephrogenesis is known to continue up to postnatal day 10, when the remaining 80% of nephrons are formed.Reference Moritz, Dodic and Wintour 17 , Reference Neiss and Klehn 18 One studyReference Schreuder, Nyengaard, Remmers, van Wijk and Delemarre-van de Waal 19 described a model of postnatal food restriction in the rat in which litter size is increased to 20 pups, which leads to growth restriction, produced a 25% reduction in nephron number. Maternal protein restriction throughout lactation has also produced a significant deficit in nephron number in the offspring in early postnatal and adult life, with a decrease in renal function and changes in plasma protein concentrations.Reference Luzardo, Silva and Einicker-Lamas 11 – Reference Langley-Evans, Welham and Jackson 20 Kidney has important functions in the renin–angiotensin–aldosterone system (RAAS). The physiological importance of RAAS is the compensation of hypovolemia and hyponatremia, so it is a key regulator of fluid homeostasis. For instance, there is accumulated evidence supporting the hypothesis that altered development as a consequence of environmental insult, as could be kidney alterations, may affect the ‘programming’ of hypertension later in life.Reference Mao, Shi, Xu, Zhang and Xu 21 , Reference Woods, Ingelfinger, Nyengaard and Rasch 22
Numerous reports have demonstrated that some brain areas, together with the kidneys, play a critical role in the control of water and salt intake, as well as body fluid homeostasis.Reference Mahon, Allen, Herbert and Fitzsimons 23 In the central nervous system, the lamina terminalis including the subfornical organ (SFO), along with some hypothalamic nuclei have Angiotensin II (Ang II) receptors.Reference Mecawi, Macchione and Nuñez 24 Immunocytochemical labelling of the protein product of the c-fos gene, Fos protein, has been used as a marker of cellular activation in neuroendocrine systems.Reference Mecawi, Macchione and Nuñez 24 – Reference Hoffman, Smith and Verbalis 26 Many studies have documented the effects of hyperosmolality, hypovolaemia or Ang II on Fos expression in the rat brain. In particular, a relatively large number of studies has reported induction of Fos expression in brain after administration of hypotensive agents such as isoproterenol, a beta-adrenergic that stimulates Ang II release and thus activates a dipsogenic response.Reference McKinley and Johnson 27 , Reference Rowland 28
Behavioural, endocrine and neural routes are three major pathways for the control of body fluid balance.Reference Fitzsimons 29 Development of hydromineral ingestive behaviour is probably programmed in utero and in the early postnatal period, thus conditioning newborn and adult ingestive behaviour. An adverse intrauterine environment such as altered foetal factors, during this critical or sensitive developmental period in pups, may alter the normal thresholds for ingestive behaviour and potentially leads to programming for increased salt intake and hypertension in adulthood.Reference Alwasel, Barker and Ashton 30 – Reference Nicolaïdis, Galaverna and Metzler 35 Despite this, the effects of undernutrition during developmental programming on thirst mechanisms in adults have not yet been comprehensively researched.
Our overarching hypothesis is as follows. Changes in the pup induced by maternal food restriction during the first half of lactation (when 80% of nephrons are formed), lead to impaired renal development and a decrease in the number of nephrons; a maldevelopment that persists into later life and might modify the pattern of fluid intake. Therefore, we tested the long-term effects of 40% food restriction in the dams during days 1–10 of lactation on adult kidney development and on behavioural and neural hydromineral control mechanisms in the pups as adults.
Materials and methods
Animals
Twelve pregnant primaparous Wistar rats (from the vivarium of the Universidad de Oviedo) were housed individually under standard lighting conditions (12 h light/dark) and constant temperature and humidity. All rats were kept under laboratory conditions for at least 15 days and were weighed and handled daily throughout the course of the study. Animal care was in accordance with guidelines from 2010/63/UE Directive and the study had the approval of the Institutional Animal Ethical Committee.
Rat dams’ procedure
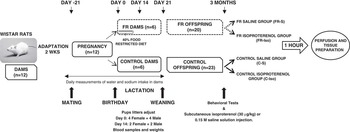
After mating, pregnancy was assessed by daily vaginal smears revealing the presence of spermatozoids. Undernutrition was started at parturition, which was defined as day 0 of lactation, and ended at day 10 of lactation. Dams were provided with either an ad libitum diet of standard laboratory chow (2014 Teklad, Harlan; crude protein 14.3%, fat 4%, crude fiber 4.1%, energy density 2.9 kcal/g) (control-C-group, n=6) or a 40% food restricted diet, compared to the normal intake in the rats fed ad libitum (food restricted-FR-group, n=6). All dams had free access to the standard diet during gestation and from postnatal day 10 to weaning. They had free access to tap water and 2.7% NaCl (liquids available from graduated plastic tubes fitted with glass spouts). In both groups, maternal body weights, water and 2.7% saline intake were recorded daily (Fig. 1).
Schematic diagram showing the conditions to which female rats and offspring were subjected from adaptation weeks until the beginning of behavioural tests, renal histological analysis and brain immunohistochemical studies. FR, food restricted group.

Offspring
At day 1 after birth, pups were weighed and litter size was culled to eight to ensure no interlitter nutritional variability. Rat dams tend to kill deformed or weak infants, which may allow her to allocate resources to the healthy pups who are more likely to survive. We selected the heaviest pups of each litter (four females and four males when possible). The rest of the litter was decapitated and their blood was collected and pooled regarding sex. At 14 days of age, we adjusted to four pups (two females and two males when possible). We also selected the heaviest pups of each litter. The rest of the litter was decapitated and their blood collected. Pup body weights were recorded at 0, 14 and 21 days of age.
Maternal water and salt intake measured daily throughout lactation. After weaning (21 days old), offspring were individually housed, fed standard laboratory diet and only given free access to tap water. All of the following experiments were performed in these animals when they are adults, when they reached 3 months of age.
Behavioural studies
The behavioural studies were the need-free water and NaCl intake tests. To assess water intake and sodium appetite of adult offspring, control (C) and food-restricted (FR) offspring rats were subjected to a 8-day period test in which tap water and 2.7% NaCl solution daily intakes were recorded. Fluids were supplied simultaneously from two separate drinking tubes, reversing the location of the drinking tubes daily.
Also, we performed a water deprivation test. C and FR offspring rats were maintained for 24 h on standard food diet with no drinking fluid available. Then, food was removed and 2.7% NaCl solution and water made available. Intakes of the two fluids were recorded after 5, 10, 15, 30, 60, 120 and 480 min.
Perfusion fixation and tissue preparation
The animals used for fluid intake (spontaneous and induced) study were the same as used for immunohistochemical analysis. The resting period between fluid depletion and isoproterenol treatment was 1 week.
At the age of 3 months, offspring from control and FR maternal conditions were divided into two groups: saline (S, control) or isoproterenol (ISO). Isoproterenol, a beta-adrenergic agonist, was chosen for this study, as it is a strong dipsogen. One or two animals per litter (a female and a male when possible) were assigned to each of the experimental groups. Rats were subcutaneously injected with 0.15 M NaCl or with isoproterenol (SIGMA, 30 μg/kg), respectively. All subcutaneous injections were made over the scapulae at a volume of 1.25 ml/100 g body weight. Rats were replaced in their cages after the challenge for 1 h; they did not allow drinking water. Then they were anaesthetized with sodium pentobarbital (i.p. 50 mg/kg) and perfused.
Blood samples were collected by cardiac puncture. Samples were heparinized, centrifuged, and plasma was stored at −20°C. Plasma osmolality was determined using a Wescor 5100C Osmometer. Plasma proteins were measured using an Atago SPR-T2 refractometer.
After that, animals were perfused transcardially with 200 ml of 0.1 M phosphate buffered saline (PBS) followed by 200 ml of 4% paraformaldehyde (PFA) in PBS. Brain and kidneys were immediately removed, weighed and immersed in PFA. Brains were immersed in 30% sucrose-PBS after 24 h.
Renal histology
Postfixation was performed in the same PFA solution for 24 h and renal tissue embedded in paraffin with 20 μm successive section. The sections were stained with periodic acid schiff reagent followed by gradient alcohol dehydration from 70 to 100%. The histological analysis was performed with light microscope by professional histologists who were blinded to the treatment conditions.
Brain Fos immunohistochemistry
Coronal 40 μm-thick brain sections were cut on a freezing microtome and processed for Fos immunohistochemistry according to the avidin–biotin–peroxidase technique.Reference Hsu, Raine and Fanger 36 Free-floating sections were rinsed twice in PBS, incubated in a methanol-hydrogen peroxide solution for 20 min, incubated in 3% goat serum for 60 min and incubated overnight in primary antibody (Santa Cruz Biotechnology, SC-52, 1:2000 dilution in antibody buffer with 0.3% Triton X-100) at room temperature. The following day, sections were washed three times with PBS and incubated for 1 h with secondary antibody (Anti-rabbit IgG, Biotinylated Vector labs, 1:200 dilution in PBS with 0.3% Triton X), washed again and processed using the Vectastain ABC kit (Vector labs, Burlingame, CA, USA). Finally, the sections were treated for 3 min in 1 mg/ml diaminobenzidine tetrahydrochloride dissolved in PBS with 0.02% hydrogen peroxide, mounted on gelatinized slides, dried overnight, dehydrated in alcohol and covered with coverslips and Permount®.
The brain nuclei of interest were the SON, PVN and SFO. These were compared with photomicrographs of identical sections in the Paxinos and Watson rat brain stereotaxic atlasReference Paxinos and Watson 37 and represented by the coronal plates from 0.92 to −1.80 mm from the bregma. All nuclei were photographed using a light microscope and digital camera and were analyzed with Leica QWin processing computer software (Image Analysis Service, University of Oviedo). All stained coronal 40 μm-thick sections were counted for the SON, PVN and SFO. Only lateral PVN mainly magnocellular (not PVN dorsomedial area, mainly parvocellular) areas were counted. The resulting densities were averaged across sections for each region.Reference Thunhorst, Xu, Cicha, Zardetto-Smith and Johnson 38
Statistical analysis
Data are expressed as mean±s.e.m. The data distribution pattern was evaluated by the test of normality (Kolgomorov–Smirnov). Comparisons between multiple groups were performed using an appropriate analysis of variance (ANOVA). Differences in water and saline intakes and weight of dams were assessed with a two-factor repeated measures ANOVA with group (C and FR) and time as the within subject factors. The unpaired Student’s t-test was used to determine whether two independent groups of data were different, after controlling for homogeneity of variance via the Levene test. Values of P<0.05 were deemed as statistically significant. SPSS (version 12.0, 2004, SPSS Inc, Chicago, IL, USA) was used for these statistical analyses.
Results
Maternal water and salt intake during gestation and lactation
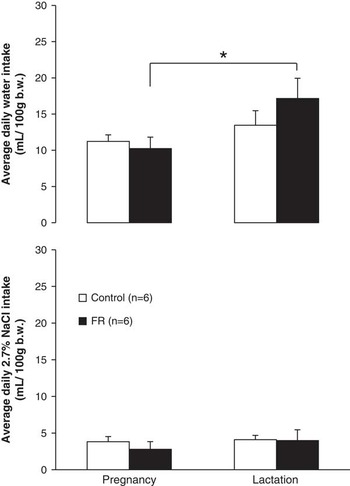
The average water and saline (2.7% NaCl solution) intakes (ml/100 g b.w.) in control (C) and food restricted (FR) dams during gestation and lactation are presented in Fig. 2. Water and saline intakes did not differ between the C and FR groups. Although the intake of water was slightly higher in both groups during lactation in comparison with gestation, it was only significant in the FR group (10.24±1.58 v. 17.15±2.79 ml/100 g b.w., P<0.05; Fig. 2).
The average daily of water and 2.7% salt solution intakes (ml/100 g b.w.) of control and food restricted dams during the gestation and lactation periods. n=6 per group. b.w., body weight. Values are means±s.e.m. *P<0.05, lactation v. gestation water intake.

Effects of nutrient restriction on maternal and offspring body weight
There was no difference in litter size between control (12.3±0.6 pups/dam; n=6) and FR (12.4±1.6 pups/dam; n=5) dams.
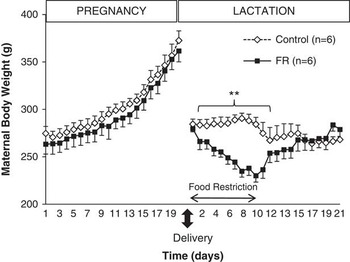
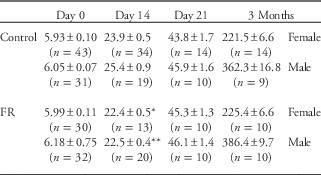
Both groups of pregnant dams gained significant weight from conception to delivery on day 20 of gestation (Fig. 3). Maternal food restriction during the first 10 days of lactation induced a significant decrease (P<0.01) in the weight of FR dams until day 12 after delivery. Pup body weights were recorded at 0, 14 and 21 days of age. Pups from FR-dams were significantly lighter (P<0.05) than controls at 14 days of age. No differences in body weight were found in the rest of offspring ages studied (Table 1).
The effect of food restriction on maternal body weight (g) of control and food restricted dams during first half of lactation. n=6 per group. Values are means±s.e.m. **P<0.01, control v. food restriction dams from 2 to 11 lactation days.

Offspring body weights

FR, food restricted group.
Data represent mean±s.e.m.
**P<0.01, FR male offspring v. Control male offspring. *P<0.05, FR female offspring v. Control male offspring.
Offspring blood values
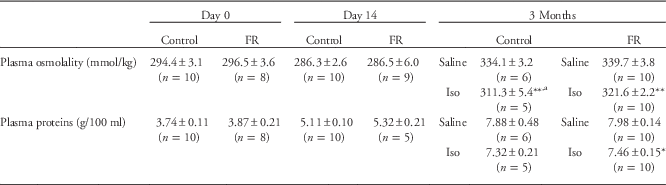
There were only minor differences in plasma osmolality and plasma proteins concentrations between C and FR offspring at 0 and 14 days of age (Table 2).
Blood parameters in pups groups

FR, food restricted group.
Data represent mean±s.e.m.
a P<0.05, Control-Isoproterenol v. FR-Isoproterenol.
**P<0.01, *P<0.05, Isoproterenol v. Saline.
At 3 months of age, rats were subcutaneously injected with 0.15 M NaCl (saline) or with isoproterenol (ISO). The interaction between offspring condition (C or FR) and challenge (saline or ISO) on blood parameters, plasma osmolality (F plasma osmolality (1,30)=0.39, P=0.53) and plasma proteins (F plasma proteins (1,30)=0.01, P=0.93) was not significant. However, the main effects of each of these factors were statistically significant on plasma osmolality (F offspring condition (1,30)=4.44, P<0.05; F challenge (1,30)=29.67, P<0.01). Plasma osmolality was significantly lower (P<0.01) in C and FR offspring exposed to ISO compared to saline. However, plasma osmolality was significantly lower (P<0.01) in FR offspring treated with isoproterenol than in control offspring. While the plasma protein concentration was lower in the ISO group than in the saline group (F challenge (1,30)=4.06, P<0.05), this difference was only significant (P<0.05) in the FR group.
Behavioural studies
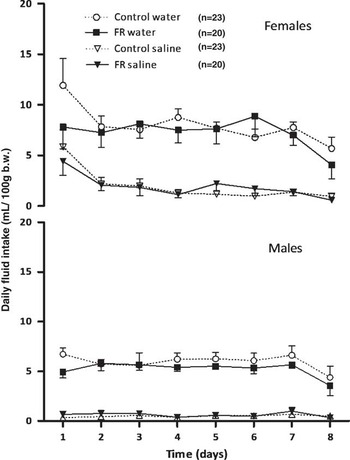
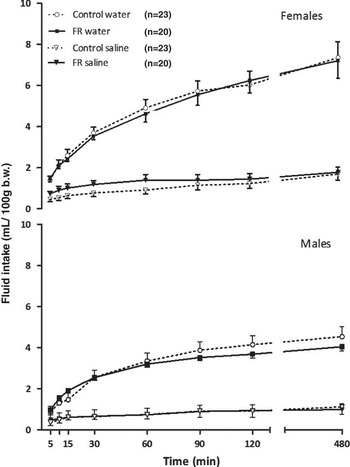
Water and 2.7% NaCl solution spontaneous (Fig. 4) and induced intakes were studied in adult offspring. We decided to categorize results by sex because female daily intakes (ml/100 g b.w.) were significantly higher (P<0.01) than male intakes. The spontaneous (Fig. 4) and induced (Fig. 5) intake of water and saline solution was not significantly different between the control and FR offspring.
Daily water and 2.7% salt solution intakes (ml/100 g b.w.) in the adult female and male offspring during 8 days. Number of female animals studied per group was 14 control (C) and 10 food restricted (FR). Number of male animals studied per group was 9 control (C) and 10 food restricted (FR). b.w., body weight. Values are means±s.e.m.

The effect of 24 h water deprivation on water and 2.7% salt solution intakes (ml/100 g b.w.) in the adult female and male offspring. Number of female animals studied per group was 14 control (C) and 10 food restricted (FR). Number of male animals studied per group was 9 control (C) and 10 food restricted (FR). b.w., body weight. Values are means±s.e.m.

Fos-immunostaining
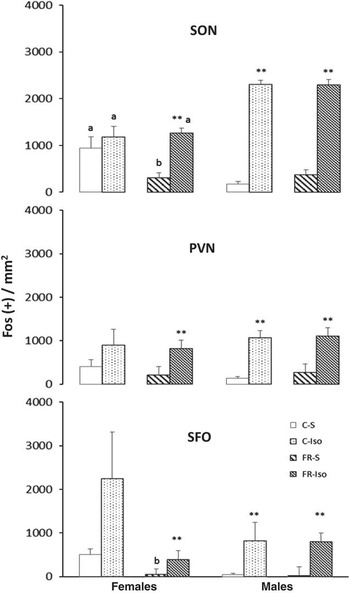
Changes in the number of Fos positive cells in the supraoptic nuclei (SON), paraventricular nuclei (PVN) and subfornical organ (SFO) of Wistar rats are shown in Fig. 6. Following the s.c. administration of isoproterenol, Fos positive cells was higher in the SON, PVN and SFO than in corresponding structures in saline-treated animals.
Cell numbers of Fos (+) cells in supraoptic nucleus (SON), paraventricular nucleus (PVN) and subfornical organ (SFO) in control (C) and food restricted (FR) groups in the adult offspring (females and males). They were divided in two groups: S (saline) or Iso (isoproterenol). Data are expressed as means±s.e.m. SON: Female, **P<0.01, FR-Iso v. FR-S; b P<0.05, FR-S v. C-S.; Male: **P<0.01, C-Iso v. C-S, FR-Iso v. FR-S. a P<0.01, female v. male, C-S, C-Iso, FR-Iso. PVN and SFO: **P<0.01, C-Iso v. C-S; FR-Iso v. FR-S. Female, b P<0.05, FR-S v. C-S.

The interaction between offspring condition (C or FR), sex (female or male) and challenge (saline or ISO) on Fos positive cells in the SON was significant (F (1,118)=5.70, P<0.01). The main effects of sex (F (1,118)=13.91, P<0.01) and challenge (F (1,118)=185.34, P<0.01) were statistically significant. In the PVN and SFO Fos expression, no significant differences were found in the interaction between the factors (F (1,84)=0.18, P=0.66; F (1,32)=0.97, P=0.33). However, we could observe the significant effect of isoproterenol injection (F (1,84)=34.64, P<0.01; F (1,32)=15.39, P<0.01). In males, the number of Fos positive cells in the SON, PVN and SF0 was significantly higher (P<0.01) than in ISO-treated control and FR offspring. In females, the number of Fos positive cells was only significantly higher (P<0.01) in ISO-treated FR offspring (Fig. 6).
Renal histological analysis
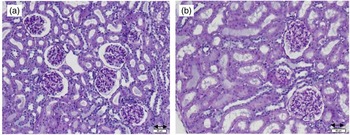
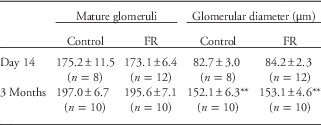
We detected a well-defined cortico-medullary demarcation in kidneys, with the presence of homogeneously distributed mature glomeruli. The renal tubules and vessels did not show significant histological abnormalities (Table 3; Fig. 7).
Histological sections of renal cortex from control (a) and food restricted (b) 3-month-old rats (same magnification, periodic acid schiff stain). Scale bar=50 μm.

Renal study

FR, food restricted group.
Renal histological analysis. Mature glomeruli were counted in a representative section from each animal (kidney/animal). In each representative section was also made an approximation of glomerular diameters (10–15 glomeruli measurements).
Data represent mean±s.e.m.
**P<0.01, 3 months v. day 14.
Differences in number of mature glomeruli and glomerular diameter were assessed with three-factor ANOVA with group (C, FR), age (14 days, 3 months) and sex (female, male) as the factors separately for number and diameter. Main effects and interactions were analysed. The main effects of age were statistically significant (number of mature glomeruli, F (1,40)=8.41, P<0.05; glomerular diameter, F (1,40)=289.99, P<0.01). Glomerular diameters at 3 months were significantly higher (P<0.01) than at 14 days, as expected. However, no significant differences were observed between C and FR groups.
Discussion
The majority of programming studies are focused on gestational effects, but very few studies investigate the effects of early postnatal undernutrition on long-term thirst mechanisms, like the present work. This shows that ingestive responses in both water and salt intake were not altered by a 40% maternal dietary restriction during the first half of the lactation period; Additionally, Fos expression in brain areas involved in the hydromineral homeostatic control was always higher in the ISO-treated offspring in response to the hypotension produced by isoproterenol. In addition, this was accompanied with normal haematological values and renal histology.
Since the ‘Barker theory’ was first introduced,Reference Barker, Osmond, Golding, Kuh and Wadsworth 2 there has been evidence proving that perinatal insults may produce long-term impacts on health after birth, so behavioral and physiological phenotypes could be ‘programmed’ in foetal origins.Reference Langley-Evans 8 , Reference Thompson, Norman and Donkin 9 In our study weights of FR dams were significantly lighter than control weights during lactation, similar to other studies.Reference Brigham, Sakanashi and Rasmussen 39 , Reference Kliewer and Rasmussen 40 This was also reflected in offspring weights, which were similar at birth, but FR offspring weight was significantly lighter than control offspring weight at day 14. Also, compared with control rats, acute food restriction (to 50% of ad libitum intake) during lactation was found to cause a 37% reduction in mammary gland mass, a 50% reduction in milk volumeReference Brigham, Sakanashi and Rasmussen 39 and a 32% reduction in litter weightReference Kliewer and Rasmussen 40 at day 14 of lactation.
Dam weights quickly equalized at day 12 post-partum, while the weight of the offspring still required a few days to normalize. These offspring results suggest that maternal calorie restriction did not impede catching up to normal body weight under standard diet conditions. Harris, Kasser and MartinReference Harris, Kasser and Martin 41 showed that at the start of refeeding 40%-fed rats were immediately hyperphagic and regained body weight rapidly. Therefore, the restricted rats had returned to control body weight without a net increase in food intake. In adulthood (3 months of age), FR offspring showed similar body weights in comparison to control rats. Although male FR offspring exhibited slightly higher body weight than male C offspring, the difference was not significant. Garg et al.,Reference Garg, Thamotharan and Dai 42 described a set of experiments (pre- and postnatal 50% nutrient restriction) to demonstrate the potential plasticity inherent in the foetal metabolic programme elicited in response to intrauterine sub-optimal nutrition in rats. The latter have shown that food restriction during lactation in rats nutritionally deprived in utero had a salutary effect on their metabolic state at 10 months of age, restoring metabolic normalcy to a lean and active phenotype.
The development of dipsogenic and additional regulatory mechanisms for the control of hydrosaline homeostasis through ingestive behaviour occurs during foetal development and early life and therefore may be susceptible to changes in the uterine environment.Reference Perillan, Costales, Vijande and Arguelles 43 – Reference Wirth and Epstein 46 Female reproduction makes significant demands on body fluid control to meet the needs of the foetus in utero and to support lactation after parturition,Reference Macchione, Caeiro and Godino 47 as can also be observed in our results. The intake of water was slightly higher in control (C) and food-restricted (FR) groups during lactation in comparison with gestation. On the other hand, saline intakes did not differ between both groups. Intakes of sodium during reproduction are not due to specific appetites or to a general mineral appetite but rather to the reproduction-increased ingestion that may meet all the dam’s increased mineral and nutrient requirements.Reference Leshem, Levin and Schulkin 48
Pregnancy and lactation lead to large increases in the intake of water and sodium but there are also other differences in drinking behaviour between males and non-pregnant females, which are presumably attributable to the different balance of sex hormones.Reference Fitzsimons 29 Coinciding with these previous findings upon studying need-free water and 2.7% NaCl solution intake in adult offspring, we also found that daily intake was higher in females than males. Spontaneous drinking behaviour and salt intake were the same in the offspring of control (C) and food-restricted (FR) mothers. The stimulated dipsogenic response, for both water and salt intake, was significantly increased immediately following 24 h water deprivation in both C and FR offspring, indicating that dipsogenic regulatory mechanisms or pathways were unaltered in the FR offspring.
Mammals control the volume and osmolality of their body fluids from stimuli that arise from both the intracellular and extracellular fluid compartments.Reference Fitzsimons 29 Isoproterenol, a beta-adrenergic agonist, was chosen for this study, as it is a strong dipsogen; it increases circulating Ang II, exhibits an antinatriuretic effectReference Johnson, Mann, Rascher, Johnson and Ganten 49 and has vasodilator properties that counteract the hypertensive effects of Ang II.Reference Moosavi and Johns 50 , Reference Robinson and Evered 51 We measured blood values in the offspring, and found some slightly significant differences in plasma osmolality between the control and food restricted adult offspring. A decrease in these plasma protein concentration and plasma osmolality immediately following isoproterenol administration was regular, because isoproterenol exhibits an antidiuretic and antinatriuretic effect.
There is some evidence that the number of nephrons in the kidneys is reduced by exposure to maternal undernutrition, and with ageing, low-protein-exposed animals develop glomerular injury and progressive loss of renal function.Reference Langley-Evans, Welham and Jackson 20 , Reference Joles, Sculley and Langley-Evans 52 In rodents, nephrogenesis continues for 7–10 days after birth, during which postnatal events may affect the nephron number.Reference Wlodek, Mibus and Tan 53 In our study, in relation to their smaller size with respect to an adult rat, the 21 days kidneys had significantly fewer mature glomeruli and glomerular diameter than in adulthood. We detected conventional levels of evenly distributed mature glomeruli and the renal tubules and vessels were without significant histological abnormalities at 21 days and 3 months of age. According to Chen and ChouReference Chen and Chou 54 ultra-glomerular structure is not affected by maternal undernutrition, which suggests that it does not contribute to the pathogenesis of hypertension following maternal undernutrition; this also implies a properly functioning RAAS.
Sly et al.,Reference Sly, Colvill, McKinley and Oldfield 55 revealed a polysynaptic pathway connecting neurons in the brain areas controlling body fluid balance to the kidney. The present study focused on central neural activation in areas linked to the control of body fluid balance, brain areas metabolically active during treatments that produce thirst and salt appetite. The use of Fos as a marker of this cellular activity in the brain is well recognized.Reference Sagar, Sharp and Curran 56 We studied a specific structure of the central nervous system responsible for the reception, analysis and integration of information and the consequent induction of appropriate responses, the SFO, and areas involved in the central integration of the visceral and somatic sensory inputs, such as the PVN and SON of the hypothalamus.Reference Antunes-Rodrigues, Ruginsk and Mecawi 57
We found that Fos immunoreactivity in the SON, PVN and SFO was always higher in the ISO-treated offspring: both groups responded to the hypotension produced by isoproterenol. Control females responded worse than males to isoproterenol administration. We should probably have to separate females (adult offspring) according to the oestrous cycle to reduce the spread of Fos immunoreactivity data. Other studies showed that isoproterenol induced neural activation in forebrain circumventricular organ was attenuated by oestrogen. The effects were not attributable to differences in circulating levels of Ang II, but rather to downregulation of Ang II receptors in these nuclei such as SFO.Reference Krause, Curtis, Stincic, Markle and Contreras 58 The Fos immunoreactivity in the SON of the control-saline offspring (C-S) was lower in females than males, also presented larger s.e.m. The SON contains a preponderance of arginine vasopressin (AVP) magnocellular neurons.Reference Landgraf, Malkinson and Horn 59 It is possible that these results will be attributed to the peripheral effects of oestrogen, namely a decrease in the stimulation of Ang II by isoproterenol in the AVP magnocellular neurons of the SON.Reference Fitzsimons 29
In conclusion, although prenatal nutrition restriction is consistently associated with the onset of adult disease, the effects of early postnatal undernutrition have been less clearly defined. The behavioural, biochemical and neural data in the present study suggest that the pathways or mechanisms for the control of hydromineral balance are unaffected in the offspring of these food-restricted mothers, with the caveat that undernutrition of the pups may not be as drastic as suggested by dams restriction. Our results indicate that the development and maturation of hydromineral mechanisms may be produced during pregnancy and/or are not affected by postnatal events such as 40% maternal food restriction during the first half of the lactation period. Further studies are required to assess the relative contribution of maternal nutrition during lactation to the programming of hydromineral control mechanisms.
Acknowledgements
The authors thank Ma Teresa Fernández and Vanessa García for help with the kidney histological study.
Financial Support
This study was supported by a grant from the University of Oviedo (UNOV-10-MA-2).
Conflicts of Interest
None.
Ethical standards
The authors acknowledge that animal care was in accordance with guidelines from 2010/63/UE Directive and the study had the approval of the Institutional Animal Ethical Committee.