


Electoral contestation may be defined as the degree of election-based competition in a political unit. Where contestation is minimal there is little organized opposition, and the incumbent party captures most of the votes and seats. Where contestation flourishes there are more competitors than available seats, a tight race for votes and seats, and frequent turnover in control. Contestation implies ex ante electoral uncertainty.Footnote 1
So understood, contestation is integral to the electoral (aka elite, minimal, procedural, or realist) conception of democracy, in which democracy is achieved through competition among leadership groups vying for the electorate's approval during periodic elections (Becker Reference Becker1958; Dahl Reference Dahl1956, Reference Dahl1971; Key Reference Key1949; Sartori Reference Sartori1976, 217; Schumpeter [1942] Reference Schumpeter1950; Strøm Reference Strøm1992). Contestation may also be regarded as a necessary condition of a more encompassing vision of democracy. Participatory and deliberative conceptions of democracy, for example, are difficult to envision without multiparty competition (Dahl Reference Dahl1989). Studies suggest, finally, that contestation fosters higher turnout (Blais and Lago Reference Blais and Lago2009), greater activity on the part of representatives (Konisky and Ueda Reference Konisky and Ueda2011), and responsiveness/accountability (Ansolabehere, Snyder, and Stewart Reference Ansolabehere, Snyder and Stewart2001; Beer and Mitchell Reference Beer and Mitchell2004; Gordon and Huber Reference Gordon and Huber2007; Griffin Reference Griffin2006; Jones Reference Jones2013; Powell Reference Powell2000; but see Brunell Reference Brunell2008; Cleary Reference Cleary2007; Fiorina Reference Fiorina1973).
Contestation may also improve the quality of governance, promoting greater efficiency and fewer political rents (Barro Reference Barro1973; Stigler Reference Stigler1972; Wittman Reference Wittman1989, Reference Wittman1995). Lachat (Reference Lachat2011) finds evidence for the proposition that competitive elections lead to more programmatic voting decisions, thus affecting the character of campaigns. Several studies argue that contestation enhances prospects for political reform and good governance (Borges Reference Borges2008; Geddes Reference Geddes1994; Grzymala-Busse Reference Grzymala-Busse2007; Heller, Kyriacou, and Roca-Sagalés Reference Heller, Kyriacou and Roca-Sagalés2011; Ting et al. Reference Ting, Snyder, Hirano and Folke2013), including lower corruption (Weitz-Shapiro Reference Weitz-Shapiro2012), and lower levels of political protest (Arce and Mangonnet Reference Arce and Mangonnet2013).Footnote 2 Trounstine (Reference Trounstine2008) finds that domination of U.S. municipalities for a long period by a single group results in lower spending and a narrower distribution of benefits. A raft of studies also suggest that interparty competition leads to stronger growth performance (Berkowitz & Clay Reference Berkowitz and Clay2012; Besley, Persson, and Sturm Reference Besley, Persson and Sturm2010; Padovano and Ricciuti Reference Padovano and Ricciuti2009).Footnote 3
In sum, the level of contestation found within a jurisdiction or district seems to affect a variety of outcomes that scholars and citizens care about. It follows that the causes of contestation should be of considerable interest. Among these causes, an important but neglected structural factor is the size of the electorate (i.e., its population). Contrary to the classical synthesis, which associates democratic performance with smaller units (e.g., Dahl & Tufte Reference Dahl and Tufte1973; Lijphart 1977), we argue that larger districts encourage greater contestation, all other things being equal. We find a “mechanical” effect whereby increases in district size generate greater competition at district levels in the absence of changes in voting behavior. In addition, we theorize that size affects voting behavior through its impact on challenger supply, constituent diversity, and the impersonality of the representative/constituent relationship—all of which should enhance the level of electoral contestation within a district.
To date, electoral contestation has been studied primarily at aggregate (national) levels. Only recently have scholars begun to examine varying levels of contestation across subnational units, generally located within a single country. This study offers the first broadly compassed analysis of constituency-level electoral contestation. Constituencies (aka districts) refer to any unit from which leaders are selected: national, regional, or local. Elections encompass executive offices (governor, mayor) and assemblies (national legislature, regional legislature, local council). A total of 88 countries, 2,344 elections, 79,658 districts, and more than 400,000 district-level contests are included in the pooled sample of this unique dataset, which extends from the late eighteenth century to the present.
We begin by laying out a theory of how size affects contestation. We then review prior studies and introduce the Multi-level Election Archive (MLEA). The empirical analysis begins with a series of regression tests using the pooled sample, which is followed by analyses focused on isolating the mechanical effect using a unique precinct-level database. Next, we focus on local council elections in the United Kingdom, Brazil, and Sweden, some of which exhibit characteristics of a natural experiment. Following, we analyze suffrage extensions (i.e., sudden changes in electoral rules that alter the size and composition of national electorates). In the final empirical section, we address issues of functional form.
A concluding section explores some of the implications of our findings for questions of institutional design. Let us preview these issues here. First, insofar as the size of a legislature affects the total number of districts, larger legislatures are associated with smaller districts. This means that countries with larger legislatures are also likely to experience a lower level of district-level contestation. Second, because of their much larger districts, executive elections are likely to be more contested than the corresponding legislative elections. Consequently, countries with directly elected executives (presidents, governors, mayors) can be expected to experience higher overall electoral contestation than countries with parliamentary systems. Third, because elections to higher level bodies generally draw from larger districts than do elections to lower level bodies, any move to decentralize power has the effect of resituating decision making from a higher contestation venue to a lower contestation venue. In these respects, considerations of size weigh on fundamental decisions pertaining to institutional design.
The Online Appendices provide additional material pertaining to MLEA (Appendix A), the mechanical effect (Appendix B), elections in the United Kingdom (Appendix C), elections in Brazil (Appendix D), elections in Sweden (Appendix E), elections in the United States (Appendix F), and miscellaneous threats to inference (Appendix G).
CAUSES OF CONTESTATION
Wherever elections are not entirely free and fair, contestation is likely to be depressed. That is, whenever the formation and functioning of political parties are impeded, whenever campaign finance is unequally distributed or media coverage is biased, wherever voters are intimidated or influenced by pecuniary rewards, wherever ballots are tampered with or incorrectly counted, we generally expect the incumbent (party or individual) to benefit and resulting levels of contestation to be lower than otherwise. Likewise, whenever control over government, civil society, and private sector is monopolized by a single party and used for political advantage (e.g., through patronage appointments and clientelistic networks), there is likely to be a lower level of contestation. Contestation is thus affected by all the factors usually judged essential to democracy, thereby serving as a useful outcome-based indicator of democracy (Vanhanen Reference Vanhanen2000).
In addition, contestation may be affected by more subtle factors such as the diversity of interests and ideologies within a district (Aistrup Reference Aistrup2004; Gronke Reference Gronke2000; Koetzle Reference Koetzle1998; Sullivan Reference Sullivan1973; Trounstine Reference Trounstine2008), the apportionment of seats and district boundaries (Abramowitz, Alexander, and Gunning Reference Abramowitz, Alexander and Gunning2006), the advantages of incumbency (Abramowitz Reference Abramowitz1980; Trounstine Reference Trounstine2008), the quality of challengers (Jacobson and Kernell Reference Jacobson and Kernell1983; Mann and Wolfinger 1980; Van Dunk Reference Van Dunk1997), party organization (Patterson & Caldeira Reference Patterson and Caldeira1984), the salience of the election, turnout, economic development (Dahl Reference Dahl1971; Lipset Reference Lipset1959), urbanization (Franklin Reference Franklin1971; Patterson and Caldeira Reference Patterson and Caldeira1984), education (Patterson and Caldeira Reference Patterson and Caldeira1984), and so forth (for general treatments see Ensley, Tofias, and De Marchi Reference Ensley, Tofias and Scott De Marchi2009; Oppenheimer Reference Oppenheimer1996). Such factors may be manipulated for political gain by those who control a political system, but they are not inherently undemocratic.
Contestation, finally, may be affected by the performance of the incumbent. If the incumbent does well or is perceived to have done well, a low level of contestation may result, at least for a period of time. Over a longer period of time, we suppose that the varying quality of leaders serves as a stochastic element in the data-generating process. That is, in districts where leaders are systematically more astute or more devoted to the commonweal, we imagine that this consistent pattern of behavior is rooted in institutional features of the landscape such as those listed in this article. Thus, we regard incumbent performance as a source of noise rather than of bias.
It is fair to say that many factors affect contestation, and no itinerary of causes is likely to be entirely comprehensive. Among these factors, however, one is ubiquitous and perhaps underappreciated.Footnote 4 We argue that the size (population) of an electorate affects that district's level of contestation in all polities where multiparty competition is allowed. We thus regard size as a structural factor, operating beneath the surface and conditioning many of the proximal factors listed earlier.
Of course, the size of an electorate is not an unmoved mover. It is affected, for example, by an alteration in suffrage laws. It is also affected by a change in the population of a district, which may be the product of demographic trends (e.g., in- and out-migration, fertility, and mortality), reapportionment, a change in the total number of seats in an elective body, or a replacement of one elective body by another.Footnote 5 Although different (sometimes difficult-to-specify) ceteris paribus conditions are associated with each of these background factors, there is sufficient uniformity across these interventions to justify their inclusion within a common theoretical framework.Footnote 6
Our goal is a framework that is valid wherever more than one party is allowed to compete. We are thus interested in explaining the degree of electoral contestation, not the fact of multiparty elections. (If only one party is granted access to the ballot, contestation is constrained by fiat.)
We begin with an effect that is “mechanical” in nature insofar as it rests on the composition of a district, rather than on changes in the behavior of voters or elites within that district. (Our use of this term is similar in spirit, though not in substance, to Duverger [Reference Duverger1959].) As a stylized example, consider two equal-sized single-member electoral districts, each with two candidates on the ballot, one from Party A and the other from Party B. In District 1, 75% of the voters favor Party A while 25% favor Party B. In District 2, these numbers are reversed: 25% of the voters favor Party A while 75% favor Party B. So constituted, both districts are likely to be uncompetitive. Now consider the effect if these two districts are combined into one larger (single-member) district and voters’ preferences hold constant. In this larger district, both parties command exactly the same level of voter support, and contestation reaches its theoretical maximum (in the context of two-party competition and first-past-the-post rules).
Importantly, this mechanical effect is not realized when the same party is ahead in both districts. In this situation, the hypothetical aggregation of two districts into one results in a simple averaging of voting behavior across the lower level districts. It follows that the mechanical effect generates either (a) an increase or (b) no change in party contestation. This result is generalizable both to multiparty competition and multimember districts where seats are allocated by party lists so long as ceteris paribus conditions obtain. A formal proof is provided in Online Appendix B.
Obviously, we cannot assume that voting behavior will remain constant when the size of a district changes. Nor can we expect decisions by political elites to remain constant when they are faced with a dramatically different political environment. Such decisions may affect the number of parties and candidates competing within a district, as well as the style and content of campaigning, which in turn has ramifications for voting behavior. A crucial case in point is the decision to launch a candidacy in a district where the odds are stacked against a candidate. If a party fails to field a candidate to run against the incumbent or fails to enlist a strong candidate, electoral competition will presumably be lower than it would be otherwise. Thus, we expect that mechanical effects are accompanied by and bolstered by strategic effects.
In considering strategic choices by voters and politicians, a convenient point of theoretical departure is provided by competition in economic markets. It is widely acknowledged that larger markets result in higher levels of competition (Campbell and Hopenhayn Reference Campbell and Hopenhayn2005), and it might be supposed that some of the mechanisms identified by this literature would also apply to political contests. Of course, the market for votes is different from the market for consumers. For example, in searching for votes politicians must be cognizant of threshold effects: A vote is not very useful if it falls above or below the threshold required for a seat. Even so, more votes are usually regarded as desirable and may serve the party (and/or candidate) in future contests as a sign of strength, rallying the base and deterring challengers. In this sense, all votes are valuable, just as all consumers are valuable for a firm, suggesting the existence of a (continuous) maximizing function in both arenas, with decreasing marginal returns in the case of political competition (for further discussion see Stigler Reference Stigler1972).
Becker (Reference Becker1958, 108) surmises that market failures (monopolies or oligopolies) are more likely in political markets than in economic markets. Specifically, he supposes that larger electoral districts may result in lower competition because they impose higher hurdles for opposition parties (i.e., a greater number of constituents to reach, requiring more money and greater organizational sophistication). Although the costs of organizing in a large district may be higher for the opposition, there may also be higher costs for the incumbent. Note that it is the balance of power between challengers and incumbents that determines overall levels of contestation. We surmise that opposition forces are likely to fare better—relative to the incumbent or dominant party—when a district is large because of three strategic mechanisms: (1) challenger supply, (2) constituent diversity, and (3) the impersonality of the representative/constituent relationship.
Challenger Supply
Incumbents typically enjoy many advantages over challengers, including experience, name recognition, campaign finance, access to media, a staff of professional advisors, the ability to set the agenda, and other perquisites of office (e.g., the ability to dispense jobs and pork). Although it is no easy trick to win reelection, it is fair to say that incumbents (whether understood as individuals or parties) enjoy an institutionalized advantage. As such, we regard the ability of the challenger (again understood as a party or a candidate) as a key predictor of competitiveness within a district (Jacobson and Kernell Reference Jacobson and Kernell1983; Mann and Wolfinger 1980; Van Dunk Reference Van Dunk1997).
Let us suppose that the supply of high-quality politicians and parties—those with the requisite background, skills, networks, funds, and ambition to mount a viable campaign—is equally distributed across a country. It follows that a larger district will contain a larger pool of strong challengers, and a very small district may contain no persons or parties with the requisite skill set and ambition (Dometrius and Ozymy Reference Dometrius and Ozymy2006). In this fashion, the size of a district, by conditioning the supply of strong challengers, can be expected to affect the overall level of contestation in a district.
Constituency Diversity
When the size of a district increases we expect it to also become more diverse—sociologically, economically, organizationally, culturally, and ideologically. The assumption is that when people live in close proximity they are subject to the same geographic and institutional pressures and also to functional and sociological pressures to conform. Likewise, when people relocate they often sort themselves according to shared sociological, cultural, and political characteristics. Both of these factors should enhance local-level homogeneity. Note that the relationship between increasing district size and diversity must be monotonic, except in the special case when some portions of the original district are dropped during reapportionment (in which instance an increase in district size could in principle result in a district being less heterogeneous along some dimension). Thus, in most conceivable settings greater size will be associated with greater diversity.
Greater diversity should, in turn, make it more difficult for a single officeholder or party to adequately represent the views of constituents—and this offers potential cleavages for the opposition to exploit. Social diversity thus serves as an important causal pathway from size to enhanced electoral competition (Aistrup Reference Aistrup2004; Gronke Reference Gronke2000; Koetzle Reference Koetzle1998; Sullivan Reference Sullivan1973; Trounstine Reference Trounstine2008; but see Ensley, Tofias, and De Marchi Reference Ensley, Tofias and Scott De Marchi2009).
By the same logic, in a large district there are likely to be a greater number and variety of organizations—businesses as well as labor unions, business and professional associations, religious and ethnic associations, universities, media outlets, and other organizations situated within civil society. Insofar as social and economic organizations provide a base for political organization, the richness and diversity of this organizational field should provide fodder for political opposition. A small district, by contrast, may have only one or two important organizations, which are likely to be closely linked to the incumbent—either because they launched his or her career or because the incumbent has managed to coopt them. For present purposes, it hardly matters whether the incumbent controls the organizations, the organizations control the incumbent, or they have a synergistic relationship. The key point is that there is likely to be a strong connection in a small district between the holders of political and socioeconomic power. Although the same pattern may hold in a large district, because the latter is characterized by numerous organizations with varying interests and perspectives, it will be more difficult to establish and maintain an exclusive power elite (Mills Reference Mills1967).
Impersonality of the Representative/Constituent Relationship
Finally, we surmise that the size of a district affects the nature of representative/constituent relationships. In particular, we expect that smaller districts allow for stronger, more personal connections between representatives and their constituents (Oliver, Ha, and Callen Reference Oliver, Ha and Callen2012; Rogowski Reference Rogowski1987, 204). These relationships of trust may also be nurtured by patronage sufficient to sway a portion of the electorate. Likewise, informal mechanisms of consultation and representation are more feasible when a constituency is small. Elites who represent diverse constituencies may be granted direct access to the incumbent, attending small meetings and conversing frequently with that individual or his or her surrogates. Exit is not required where voice can be effectively exercised (Hirschman Reference Hirschman1970).
As the size of a district grows it becomes less feasible for an individual or a party to purchase a seat or to influence a significant section of the electorate on the basis of personal or familial ties. It is perhaps not coincidental that vote buying and other forms of influence peddling were common in the tiny “rotten boroughs” of nineteenth-century England and less common in the more populous boroughs (Cox Reference Cox1987). Of course, incumbents still seek to cultivate a distinctive “homestyle,” linking their fate to their constituents (Fenno Reference Fenno1978). However, a personalistic or clientelistic approach to governing is apt to be less availing where numbers are large: It is not possible to maintain direct ties to constituents in a constituency numbering in the hundreds of thousands. Consequently, the representative/constituent relationship is likely to be attenuated: less personalized, less clientelistic, less amenable to vote buying, and more partisan and programmatic in nature. This, in turn, limits the capacity of incumbents to maintain a monopoly of power by exploiting material incentives and personal ties of an affective nature.
The weight carried by each of these mechanisms—challenger supply, constituent diversity, and the impersonality of the representative/constituent relationship—is likely to vary according to the setting, a matter that is difficult to test in a precise manner. However, we surmise that any change in district size is likely to affect all three strategic factors. Consequently, we cannot hope to understand the impact of district size on contestation without considering each of them, along with the mechanical effect that operates whenever districts are merged or divided.
PRIOR STUDIES
Contestation is a central component of most cross-national indices of democracy (e.g., Alvarez et al. Reference Alvarez, Cheibub, Limongi and Przeworski1996; Coppedge, Alvarez, and Maldonado Reference Coppedge, Alvarez and Maldonado2008; Vanhanen Reference Vanhanen2000). Consequently, studies of democratization may also be viewed as studies of contestation. However, the predominant focus on the nation-state is problematic in several respects. First, many countries are highly decentralized, and the degree of contestation often varies considerably by region (Gibson Reference Gibson2005; Snyder Reference Snyder2001). Insofar as one's gaze is limited to national governments one may miss much of the action. Second, a cross-national sample of countries is necessarily small (N = 200 or so) and extremely heterogeneous, introducing multiple threats to inference (Seawright Reference Seawright, Brady and Collier2010). If we want to understand the causes and effects of contestation, a strong argument can be made for scoping down so that units are larger in number and more comparable to each other (Sinha Reference Sinha2012; Snyder Reference Snyder2001).
In response to the perceived deficits of country-centered analysis, the study of subnational politics has flourished in recent years.Footnote 7 However, most of this work focuses on a single country or region and a single level of government (usually provincial) and thus is subject to problems of unrepresentativeness and stochastic error. Likewise, explanations developed in the context of a single country or region may be of uncertain value for developing general theory.Footnote 8
A handful of studies have examined the connection between size and contestation at district levels. Patterson and Caldeira (Reference Patterson and Caldeira1984) look at competition across American states (aggregating across a variety of state-level elections). Aistrup (Reference Aistrup2004) examines state house elections aggregated by county. Lascher (Reference Lascher2005) looks at county board of supervisor elections in California. Hajnal, Lewis, and Louch (Reference Hajnal, Lewis and Louch2002) tally local elections of all sorts across California. Hogan (Reference Hogan2003) examines primary elections for state legislative races in twenty-five states. Hibbing and Brandes (Reference Hibbing and Brandes1983) examine variation across U.S. Senate elections. Trounstine (Reference Trounstine2008) looks at large U.S. cities using a specially constructed indicator of monopoly control.
Some of these studies support our argument that a larger district encourages greater contestation, whereas others do not. It is beyond the scope of this article to provide an extensive review of this literature. However, there are reasons to be cautious about drawing conclusions from the data presented in these studies. First, most studies are limited to a single country: the United States. Second, studies generally focus on a single office, a relatively small period of time (during which little change in district size may have occurred), and a single measure of contestation. Third, inappropriate analytic models are sometimes applied—perhaps because district size is but one of many factors of theoretical interest.Footnote 9 Causes-of-effects studies do not always provide unbiased estimates of the effects of causes. Thus, although size has been investigated sporadically in the literature on U.S. elections, it is difficult to know what to conclude from these studies or whether results are generalizable beyond the purview of a single country.
DATA
Analyses presented in this study draw primarily on the Multi-level Elections Archive (MLEA), a new dataset that we constructed. Online Appendix A contains a full description of MLEA, including data sources, specific coding rules, and descriptive statistics for all variables. Here, we focus on features of this dataset that are relevant for the present study.
MLEA collects data for most election types, classified as (a) lower or unicameral chamber of national legislature, (b) upper chamber of national legislature, (c) gubernatorial, (d) lower or unicameral chamber of regional legislature, (e) upper chamber of regional legislature, (f) mayoral (executive serving a municipality), or (g) council (assembly serving a municipality).Footnote 10
Election data are compiled from a wide range of sources including the Constituency-Level Elections Archive (CLEA) (Kollman et al. Reference Kollman, Hicken, Caramani and Backer2011), Global Elections Database (Brancati Reference Brancati2013), Election Passport (Lublin Reference Lublin2013), and additional sources specific to the United Kingdom (Online Appendix C), Brazil (see Online Appendix D), Sweden (Online Appendix E), the United States (Online Appendix F), Mexico (Shea, Rios, and Fernandez Reference Shea, Rios and Fernandez2012), and Russia (Moraski and Reisinger Reference Moraski and Reisinger2007).
The resulting sample is the largest of its kind, including 88 countries, 2,344 elections, 79,658 districts, and more than 400,000 district-level contests.Footnote 11 Note that a district refers to any unit from which leaders are selected. Accordingly, the district for an executive (governor, mayor) is the entire political unit. The district for a legislature is occasionally the entire electorate (e.g., Israel), but more typically is a smaller geographic area designated as a constituency. This means that districts are sometimes units within a larger whole and sometimes are meaningful political entities in their own right.
A contest refers to a district-level race for a particular seat(s). For example, a U.S. national election might feature one presidential contest, 33 U.S. Senate contests, 435 U.S. House contests, and myriad state and local contests. An election for the Israeli Knesset (leaving aside other offices that may be on the ballot) features one contest because there is only one (nationwide) district.
Some countries are represented in MLEA by contests drawn from a single election, whereas other countries are represented by tens of thousands of district-level contests, as shown in Table A2. (Although two countries—the United States and the United Kingdom—together contribute more than two-thirds of the available observations, results from our analyses are not sensitive to the exclusion of these two cases, as shown in Table 1.) The data are also distributed unevenly through time, with more data from contemporary periods and less from historical periods, as shown in Figure A1. Only the United States, Canada, Australia and several European countries provide electoral data dating back to the nineteenth century. (Reassuringly, empirical tests in Table 1 indicate little variation over time in the relationship of theoretical interest.)
Global Tests

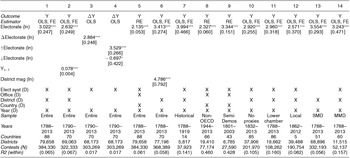
Outcome: Competitiveness (100 – share of largest party). No proxies: electorate is not proxied by population. Estimator: OLS, FE (ordinary least squares regression with district fixed effects), RE (random effects), all standard errors clustered by district. D: dummies.
*** p<0.01, ** p<0.05, * p<0.1 (two-tailed tests).
The outcome of theoretical interest, electoral contestation, is measured as Competitiveness, understood as 100 minus the share of the vote gained by the largest party in a district. This is a highly sensitive indicator, offering meaningful variation for every district and every election that are open to multiparty competition. Note that in measuring competitiveness we are primarily concerned with party competition, rather than competition among individual candidates. Consequently, nonpartisan elections are excluded from most of the following analyses.
A histogram of this variable reveals a mode at 0 (representing the absence of a viable challenger) and a smaller peak at 50 (the minimum threshold in a two-party contest), as shown in Figure A2. A smoothed graph (10-year moving average) of mean competitiveness from 1792–2013, shown in Figure A3, reveals a modest secular-historical increase, as one might expect given the general trend of greater contestation over the past two centuries.
There are, of course, alternate approaches to measuring contestation, though none with such broad coverage. Most of these alternatives, reviewed in Online Appendix A, are highly correlated with our chosen measure (see Table A5). Reassuringly, when empirical tests described later (see Table 1) are replicated with these alternate measures, they show a very similar pattern of results (see Table A6). The findings of this study do not depend on arbitrary choices in measurement, so far as we can tell.
The causal factor of interest in this study is the size of an electorate, understood as the number of eligible voters in a district. Where the number of eligible voters is unknown, it is proxied by the population of a district. This causal factor is denoted Electorate in the text and tables that follow and is transformed by the natural logarithm to accommodate presumed nonlinearity in the relationship with competitiveness.
A number of additional factors can be expected to influence competitiveness and thus serve as covariates in the following analyses. Electoral-system features, coded from Colomer (Reference Colomer2004), PIPE (Przeworski et al. Reference Przeworski2013), and country-specific sources, are categorized as (a) single-member district (SMD); (b) majoritarian, block ballot; (c) proportional representation (PR), average magnitude < 9; (d) PR, average magnitude > 9, closed list; (e) PR, average magnitude > 9, open list; (f) mixed (SMD and Multi-member district [MMD]); and (g) secret ballot. All are measured as binary variables (dummies). Variables measuring (i) district magnitude (logged), (j) urbanization, (k) educational attainment, (l) per capita income (logged), and (m) land area (logged) are available for a subset of countries and thus appear in robustness tests, but not in the benchmark model.
GLOBAL TESTS
We begin with a series of global tests in which Competitiveness is regressed against Electorate, as shown in Table 1. Model 1, our benchmark model, adopts an ordinary least squares (OLS) estimator with the following specification:
 \begin{equation*}
{\rm C}_{{\rm it}} = a + b{\rm E}_{it} + c{\rm ES}_{{\rm it}} + d{\rm D}_{{\rm it}} + \varepsilon
\end{equation*}
where C is Competitiveness, a is a constant (omitted from Table 1), E is Electorate (logged), ES is a vector of dummies representing each electoral system type, D is a vector of dummies representing each district, and ε is the error term. Districts are indexed by i and time periods (years) by t.
In the discussion that follows we refer to D as “district fixed effects,” a vector of identifiers for each office-district. This means that, even if two elective offices have identical districts (e.g., senate and gubernatorial elections in the United States), they are each assigned a unique district identifier under the assumption that errors cluster at the office-district level. Note that year dummies serve as a flexible way to model time trends in the data-generating process, whereas electoral system dummies account for variation in electoral rules, as described earlier.
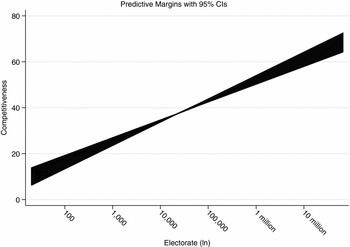
The estimate from Model 1, Table 1, shows a positive and highly significant relationship between the size of an electorate and the level of competitiveness within a district. Before continuing, let us consider this estimate in a more practical fashion by constructing a plot of predicted competitiveness as the value of electorate changes. Figure 1 shows a fairly steep curve with a tight 95% confidence interval. The logged format of the independent variable suggests a causal relationship with decreasing returns. Specifically, each nonlinear increment shown on the x axis—100, 1,000, 10,000, 100,000, 1 million, 10 million—translates into an increase of just under 10% in anticipated levels of competitiveness. It follows that a given change in district size matters a great deal more at the low end than at the high end, as one might expect.
Estimated Impact of Electorate on Competitiveness

Subsequent analyses explore variations in this benchmark model. Models with district fixed effects adopt an ordinary least squares estimator and report a “within” R 2 statistic. Other models, where district fixed effects are replaced by country dummies, adopt a random effects estimator and report an “overall” R 2 statistic. Standard errors are clustered by district, regardless of the estimator.
Model 2 introduces a lagged dependent variable (LDV), which shifts attention from long-term effects to one-period dynamic effects. LDV models with unit fixed effects introduce bias in short panels, which describe many of the countries in our sample. However, some countries offer very long panels, stretching for more than a century, as noted. Results are in any case robust with and without unit fixed effects. As such, the LDV model may block potential confounders and thus serves as a useful robustness test (Beck and Katz Reference Beck and Katz1996).
Model 3 offers a first-difference estimator, where the outcome and causal factor of theoretical interest are measured as a one-period change. It estimates the impact of a change in Electorate (∆X) on a change in Competitiveness (∆Y). As with Model 2, we include only those observations that assume a sequential panel format. Thus, if a country is observed at only one period of time (providing a single snapshot), it is dropped from the analysis, resulting in a somewhat smaller sample. Results are otherwise comparable to Model 1.
Model 4 differentiates between increases and decreases in electorate size. This is handled by recoding ∆Electorate as two variables. ↑Electorate registers only increases in electorate size, with decreases (and episodes of no change) coded as 0. ↓Electorate registers only decreases in electorate size, with increases (and episodes of no change) coded as 0. Both variables are transformed by the natural logarithm, consistent with our practice elsewhere. Although there are more increases than decreases (a fact that follows from demographics) and the right tail of the distribution (representing increases) is also somewhat longer than the left tail, the sample is balanced enough to offer a fair test of the proposition (see Figure A6).
The analysis in Model 4 suggests that increases in electorate size have considerably greater impact on competitiveness than do decreases in size. This suggests that there may be a small ratchet effect (i.e., that it is easier to increase competitiveness than decrease it), which makes sense of the general increase in competitiveness through time noted throughout our sample (Figure A3). However, the fact that decreases in electorate size are associated with a lower level of competitiveness also reduces concern about potential confounders. If only increases in district size were correlated with changes in competitiveness, one might suspect that something other than the size of the electorate was driving this outcome. The bidirectional nature of the relationship thus constitutes an important placebo test with respect to slow-moving changes that are likely to correlate with population growth (e.g., modernization).
Model 5 replaces district fixed effects with country fixed effects, establishing comparisons across elections within each country (within a given year). We also add a set of dummy variables representing each office in the sample—upper chamber, lower chamber, governor, upper chamber of state legislature, lower chamber of state legislature, mayor, and council. This analysis diminishes the coefficient for the variable of theoretical interest (though it retains statistical significance at .01 levels). We suspect this result occurs because most countries in our sample do not offer much variance in electorate size across districts. Jamaica, for example, is represented in the MLEA by lower chamber elections from SMDs that are fairly equal in size.
Model 6 replaces our usual series of dummy variables representing various electoral system rules with a single variable measuring district magnitude (M), the number of seats in a district, transformed by the natural logarithm. This variable shows the expected sign: Higher M is associated with greater competitiveness. Importantly, there is little alteration in the variable of theoretical interest relative to the benchmark model, suggesting that electoral system dummies do a good job of capturing this important background feature. Because the dummies offer better coverage, we retain them in our analyses.
Models 7–14 provide subsample analyses. Model 7 adopts the benchmark model, but restricts the sample to the 1792–1919 period, a period of time in which suffrage was generally limited to adult male citizens. (There is only one case of universal female suffrage in our sample during this period.) Estimates for electorate indicate a slightly enhanced causal effect relative to the benchmark.
Model 8 focuses on countries in our sample from the developing world, understood as those who were outside the OECD in 1990. It excludes the United States and the United Kingdom, which contribute a large share of MLEA's data. We adopt the format of Model 5, with a random effects estimator and country dummies, because most of these countries do not offer a long enough time series to warrant district fixed effects. (The benchmark specification is also robust, though the estimated effect is somewhat attenuated.) Comparing Model 8 with Model 5 (identical in specification and estimator), we find that the causal effect of district size on competitiveness is somewhat stronger in the developing world than in the developed world.
Model 9 focuses on polities that are not fully democratic, understood as country-years with a score of less than 8 on the Polity2 scale, which runs from −10 to +10 (Marshall, Gurr, and Jaggers Reference Marshall, Gurr and Jaggers2013). We again adopt the format of Model 5 because of limited time-series data among the countries in the subsample. Comparing Model 9 with Model 5, we find that the electorate/competitiveness relationship is somewhat stronger where the quality of democracy is lower. District size matters more where the playing field is less equal.
Model 10 is limited to elections for which we have actual data for the eligible electorate; it excludes those observations where electorate size is proxied by population (approximately 42% of the total sample). Reassuringly, the coefficient for Electorate is virtually identical to that for the benchmark model, suggesting that our method of dealing with missing data for the key independent variable does not prejudice the results.
The next set of models in Table 1 focus on different types of elections: the lower (or unicameral) chamber of national legislatures (Model 11), local electoral bodies (i.e., mayors and city councils) (Model 12), SMD contests (Model 13), and MMD contests (Model 14). Note that there is a bit of overlap in the samples included in Models 13 and 14, because several countries combine SMD and MMD electoral systems. Little variation in estimates of the impact of electorate on competitiveness is registered across these varied electoral environments.
Overall, the results displayed in Table 1 offer strong support for our hypothesis. Every test reveals a positive and statistically significant effect for the variable of theoretical interest. Moreover, point estimates are remarkably stable across varying specifications, samples, and estimators—hovering around 3.0—suggesting a high degree of consistency in the relationship between electorate size and competitiveness. Because the treatment is not randomly assigned we interpret these causal effects (and others presented later) as an estimation of average treatment effects on the treated (ATT) rather than average treatment effects (ATE).
Of course, global analyses of this nature must contend with an extraordinary degree of heterogeneity, both in the measured treatments and in background factors that may serve as confounders. Despite the many robustness tests, some potential confounders remain at large because they are impossible to measure and test across such a large sample. The following sections focus on smaller settings where causal inference is more tractable.
ISOLATING THE MECHANICAL EFFECT
In the first section of this article we introduced the idea of a mechanical effect—that increased competition in larger electorates is partly the product of aggregating populations with opposing partisan preferences. We explored a simple hypothetical example, supplemented by a formal proof in Online Appendix B. However, we also argued that the impact of electorate size on competitiveness is not solely the product of this mechanical effect but also of strategic factors including challenger supply, constituent diversity, and the representative/constituent relationship.
To demonstrate this point we had to find a way to isolate the mechanical effect from the data-generating process. To do so, we used data from the ROAD (1984–90) and HEDA (2000–12) archives, which record American election results by precinct—a unit smaller than the smallest electoral district under examination (see Online Appendix B). We then compared voting behavior at the precinct level when voters are subjected to varying treatments (i.e., exposure [via an election ballot] to a vote-choice for a particular office in a particular election [a contest]). For example, in a single precinct on a given election day a voter may be exposed to contests for the state legislature, state senate, U.S. House of Representatives, U.S. Senate, governor, and the presidency. Most of these contests take place in differently sized districts, which therefore define the magnitude of the treatment, as measured by the electorate variable. We were then able to explore how the same group of voters—members of a single precinct—responded to partisan vote-choices occurring simultaneously in differently sized districts. Because we calculated competitiveness at the precinct level, rather than at the treatment level, we were able to eliminate mechanical effects that arise solely from aggregating and disaggregating voting units (districts). Any changes in competition registered in these analyses had to arise from changes in vote-choice (i.e., split-ticket voting). (If all voters in a precinct voted straight party tickets, there would be no alteration in competitiveness across contests.) Such changes in vote-choice had to be the product of other (nonmechanical) factors, classified as “strategic” in our theoretical discussion.
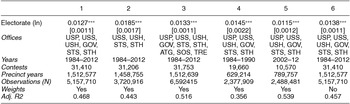
Analyses in Table 2 estimated the effect of Electorate (proxied by population) on Competitiveness within a precinct across varied contests. We used precinct-year fixed effects and cluster standard errors at the contest level, reflecting the fact that the competitiveness of a given contest across multiple precincts is not independent. We then weighted observations by the total number of ballots cast in a precinct-year so that smaller precincts did not dominate the results. The coefficient on Electorate thus measured the average change in competitiveness within a precinct across simultaneous elections as the size of the district (for each election) changes.
Isolating the Mechanical Effect

Units of analysis: precinct-level election returns for U.S. elections for all states and years where data are available (see Online Appendix B). Outcome: Competitiveness (100 – share of largest party) using two-party vote. Electorate (ln): population of the district for the specified office, transformed by the natural logarithm. Offices: USP (president), USS (U.S. Senate), USH (U.S. House), GOV (governor), STS (State Senate, upper chamber), STH (State House, lower chamber), ATG (State Attorney General), SOS (State Secretary of State), TRE (State Treasurer). Weights = observations weighted by total ballots cast in each precinct-year. Estimator: ordinary least squares regression with precinct-year fixed effects, standard errors clustered by electoral contest.
*** p<0.01, ** p<0.05, * p<0.1 (two-tailed tests).
In Model 1, our benchmark model, we estimated the effect of electorate size on within-precinct competitiveness using elections for state house, state senate, U.S. House, U.S. Senate, governor, and president. We found a positive and statistically significant relationship between the size of the electorate for a particular contest and precinct-level competitiveness. Specifically, within the same precinct, a state senate race is, on average, 1.3% more competitive than a state house race, a U.S. House race is 1.9% more competitive than a state senate race, a U.S. Senate or gubernatorial race is 2.8% more competitive than a U.S. House race, and a presidential election is 5.0% more competitive than a state-level election. Although many of these differences are relatively small, they are statistically significant and establish that the mechanical effect does not explain the entire observed increase in competition as the size of the electorate increases.
Subsequent models introduced variations in the benchmark. Model 2 restricted the sample to legislative elections (state and national). Model 3 was the most comprehensive, incorporating statewide elections for attorney general, secretary of state, and state treasurer, where available. Models 4 and 5 restricted the sample of election years to 1984–90 and 2002–12, respectively. Model 6 eliminated the differential weighting of precincts by size, thus weighting all precincts equally. Results for the key variable of interest in these alternate models track the benchmark model fairly closely, as shown in Table 2.
As a final set of robustness checks, we estimated separate models (a) for each even-numbered election year and (b) for each of the four designated census regions. These tests, reported in Table B5, confirm that our results are not driven by any particular election year or region of the country.
In addition to isolating the mechanical effect of district size on competitiveness, the analyses contained in Table 2 provide an especially strong test of our main hypothesis. Note that we are comparing the effect of varying treatment conditions on the same voters—a within-subjects design (Judd, Kenny, and McLelland Reference Judd, Kenny and McClelland2001). The treatments—voting for various offices on the same ballot—are administered sequentially. The only potential problem of causal inference is posed by interference across treatments. It is virtually inevitable that top-of-the-ballot choices influence down-ballot choices, or the reverse. However, “coattails” are not a principal concern in the present setting. First, this sort of interference mimics the real world, so our estimated causal effect has greater generalizability than one induced in an artificial laboratory setting where subjects might be asked to vote for only a single office. Second, this interference presumably diminishes the treatment effect that one would anticipate if ballot choices were artificially segregated, exerting a downward bias on our estimates.
For these reasons, we regard precinct-level analyses as providing the most demanding test of our hypothesis. At the same time, it should be borne in mind that, by eliminating the mechanical effect, we are also underestimating the total impact of electorate size on competitiveness. The research design pursued in this section, although appropriate for isolating the mechanical effect, is not appropriate for measuring the total impact of electorate size on competitiveness. Note that by measuring competitiveness at the precinct level we are able to hold constant the identity of the subjects (voters). Yet, by holding constant the identity of the subjects we are also holding constant a feature—constituent diversity—that, according to our theory, is likely to influence competitiveness. Specifically, if through population growth, socialization of new voters, and sorting, citizens aggregate in districts that are homogeneous—and if this homogenization effect is strongest at the smallest level—then the full impact of size on competitiveness can be estimated only when district membership is allowed to vary over time. For these reasons, other research designs presented in this article offer a more accurate overall assessment of the theorized relationship. Our goal in Table 2 is to demonstrate that this relationship is not entirely the product of a mechanical aggregation effect, as well as to conduct a stringent test of the main hypothesis.
COUNCIL ELECTIONS
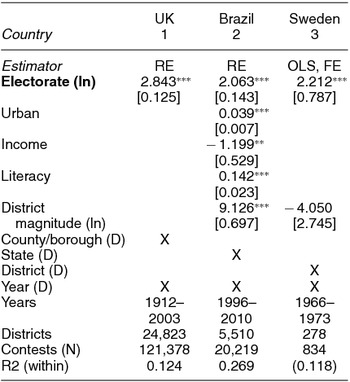
Elections to local councils offer a special window into the size/contestation relationship, one that is, at least in certain respects, less prone to confounders than our global sample. In this section, we focus on three countries that provide good coverage of district-level data for local elections in the contemporary era: the United Kingdom, Brazil, and Sweden. Results from benchmark models are shown in Table 3. Descriptive statistics and complete results, including multiple robustness tests, can be found in Online Appendix C (UK), Online Appendix D (Brazil), and Online Appendix E (Sweden).
Council Elections

Outcome: Competitiveness (100 – share of largest party). D: dummies. Estimator: OLS, FE (ordinary least squares with district fixed effects), RE (random effects), standard errors clustered by district (ward/municipality).
*** p<0.01, ** p<0.05, * p<0.1 (two-tailed tests).
British council elections (we do not consider mayoral elections) at the ward (district) level may be observed over the past century, thanks to the data compiled by Rallings, Thrasher, and Ware (Reference Rallings, Thrasher and Ware2006). During this time, and especially over the past four decades, numerous changes in ward size occurred as a result of mergers and splits in local governing units (i.e., parishes, boroughs, and councils). So far as can be discerned, these dramatic increases and decreases in electorate size were not accompanied by other changes that might have affected ward-level competitiveness. Most elections were conducted with SMDs and first-past-the-post rules, and those that did not were excluded from our sample. Changes in powers and duties delegated to local offices occurred occasionally and sometimes coincided with a reorganization of offices. However, accounts of this process do not suggest patterns that were likely to correlate in a consistent fashion with changes in ward size (Alexander Reference Alexander1982; Game and Wilson Reference Game and Wilson2011; Rallings and Thrasher Reference Rallings and Thrasher1997; Rao and Young Reference Rao and Young1997).
In Model 1, Competitiveness is regressed against Electorate along with county/borough and year fixed-effects. Standard errors are clustered by ward, which in this setting serves as the lowest level district. Note that merged (or divided) wards are generally contained within a larger unit—referred to variously as a County Borough Council, County Council, District Council, Greater London Council, London Borough Council, Metropolitan Borough Council, Metropolitan County Council, or Unitary Authority. We label this larger unit a county/borough and assign unique dummies to each one. Because the boundaries of a county/borough generally remain constant through time (during its period of existence), the inclusion of dummies for each county/borough in our model has the effect of comparing levels of competitiveness across local districts (wards) within a county/borough in a given year. Arguably, the main feature distinguishing these districts is size. Robustness tests shown in Table C2 introduce several variations to this benchmark model, including district (rather than county/borough) fixed effects, a lagged dependent variable, and a distinction between increases and decreases in district size (as previously). The estimated effect of electorate on competitiveness is fairly stable in all models, corroborating results in Table 1 (though with slightly smaller estimates of the causal effect).
Brazilian council elections may be observed for four elections held between 1996 and 2010 across 5,510 districts, generating 20,000+ contests, with electoral data drawn from the Superior Electoral Court (Tribunal Superior Eleitoral), the Brazilian Institute of Geography and Statistics (Instituto Brasileiro de Geografia e Estatistica), and Brambor and Ceneviva (Reference Brambor and Ceneviva2012). Council elections employ open-list PR rules (Ames Reference Ames1995), with the municipality as the multimember election district. Although occasional mergers and divisions across municipalities occurred during this period, data were not available on the pretreated units. Consequently, there was no pattern in the data-generating process that might be interpreted as a natural experiment. Likewise, the time series was too short (and the variable of theoretical interest too sluggish) to justify the use of district fixed effects. Fortunately, we could measure background covariates at the district level, including urbanization, income, literacy, and district magnitude, and we could also control for state-level features with a vector of dummies.
In Model 2, Competitiveness is regressed against Electorate along with state and year fixed effects plus background controls, as described. Thus, it compares levels of competitiveness across council districts within each state that have varying populations, conditional on background characteristics. Results suggest that the impact of electorate size on competitiveness is comparable to that found in our global sample. Interestingly, the performance of background covariates in this model suggests that the impact of modernization on competitiveness is registered primarily through urbanization and literacy, not through income. A robustness test, shown in Table D2, drops these background covariates, presenting a spare model with only state and year fixed effects. Results are slightly attenuated (though still highly significant), suggesting that modernization factors are orthogonal to district size. Evidently, even in a highly inegalitarian country, where extremes of wealth and development are spatially organized, the effect of electorate size on competitiveness is strong and robust. Larger districts are more competitive, regardless of whether their constituents are rich or poor, educated or uneducated, urban or rural.
We handled local elections in Sweden in a fashion analogous to Britain and Brazil, except that we focused on a single intervention observed across a narrow slice of time. To accommodate a decrease in population in rural municipalities and the perceived need for more efficient local government units in a period of rapid welfare state expansion, Swedish municipalities were merged from 1965 to 1974. A bill introduced by the Social Democratic government led to the aggregation of 1,031 municipalities into 282 “blocs” with a predicted population size of at least 8,000 people in 1975. For the most part, these new blocs aligned with geographical circumstances related to industry and the economy and clustered around a central town or village (centralort). Mergers of municipalities were originally expected to occur voluntarily, but by 1969 less than 10% of the required mergers had occurred. The government then decided to force the remaining mergers, most of which occurred in 1971 and 1974 (Brantgärde Reference Brantgärde1974, 14–44; Wallin Reference Wallin, Wallin, Andersson and Andrén1973, 18–31; Wångmar Reference Wångmar2006, 71–72). As a consequence, increases in electorate size in Swedish municipalities were driven by forces largely exogenous to local political actors.
We observed three elections: 1966, under the pre-reform system (900 municipalities, mean electorate: 5,934); 1970, with a few reformed districts in place (464 municipalities, mean electorate: 12,164); and 1973, with the reform completed (278 municipalities, mean electorate: 20,455). All elections were held with closed-list PR rules and no statutory threshold for representation. We treated the final post-reform districts (N = 278) as our units of analysis. This means that results for the 1966 and 1970 elections are aggregated up, weighting results for smaller districts by size.Footnote 12
Model 3 includes district and year fixed effects, along with a measure of district magnitude (i.e., local assembly size) that expanded with each district merge. The coefficient for Electorate in this model is consistent with previous estimates, showing increases in competitiveness corresponding to municipality mergers. Robustness tests described in Online Appendix E alter various features of the benchmark model, eliminating the control for district magnitude, adding a lagged dependent variable, replacing district fixed effects with a first-difference model, and including a control for Social Democratic dominance (see Table E2). This last test suggests that the attenuated causal effect found in Sweden (relative to that reported in Model 1 for British local elections) is the product of a particular moment in time when the Social Democrats were the dominant party nationally and in most localities, thereby eliminating the mechanical effect that would otherwise come into play when districts are consolidated.
SUFFRAGE REFORMS
Suffrage reforms focused on specific classes of voters offer, yet another opportunity to test our hypothesis. Drawing on the PIPE dataset (Przeworski et al. Reference Przeworski2013), we constructed binary variables to measure major suffrage reforms focused on women and youth. Female suffrage was coded 0 prior to universal female (adult) suffrage and 1 after suffrage was granted to that group (separately from males). Youth suffrage was coded 0 before the extension of suffrage to younger voters, and 1 thereafter. (We coded only one youth suffrage extension for each country.) Note that our dummy-variable coding represented the final reform—when universal suffrage within the specified demographic category was achieved, regardless of prior reforms. It did not specify how much of an increase in eligible voters that final reform represented. We excluded male suffrage and instances where male and female suffrage were inaugurated together, because such reforms usually occurred in a piecemeal fashion over a long period of time and were also associated with a host of potential confounders (World War I, the formation of mass parties, the crystallization of party cleavages, the inauguration of new electoral laws, and other perturbations of the late nineteenth and early twentieth centuries).
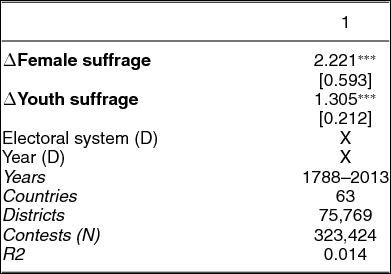
To analyze the impact of suffrage reforms on competitiveness it was necessary to observe a country pre- and post-treatment. This meant that reforms had to occur after the inauguration of multiparty competition and district-level data had to be available both before and after the reform. Eight female suffrage reforms and 20 youth suffrage reforms met these criteria, as listed in Table 4.
Suffrage Extensions

Outcome: ∆Competitiveness (100 – vote share of largest party) from one election to the next. D: dummies. Estimator: ordinary least squares “first-difference” regressions, standard errors clustered by district.
*** p<0.01, ** p<0.05, * p<0.1 (two-tailed tests).
Suffrage variables are coded dichotomously (0/1). Female suffrage extensions: Belgium (1919), Greece (1956), Ireland (1923), Liechtenstein (1984), Norway (1909), Switzerland (1971), United Kingdom (1928), United States (1920). Youth suffrage extensions: Australia (1974), Austria (1970), Belgium (1981), Brazil (1990), Finland (1972), France (1978), Greece (1985), Iceland (1934), India (1989), Ireland (1973), Jamaica (1976), Korea (2000), Luxembourg (1974), New Zealand (1975), Norway (1921), Portugal (1976), Sweden (1948), Turkey (1995), United Kingdom (1970), and United States (1971).
Analyses displayed in Table 4 focus on the immediate effects of suffrage reform, as revealed by first-difference regression models, because we assume that longer range causal effects are subject to a variety of confounders and thus not very informative. In Model 1, the change in Competitiveness from one election to the next is regressed against the change in suffrage status for our two suffrage variables, along with dummies representing each year and each electoral system type. Coefficients for both variables of theoretical interest are positive and statistically significant. The advent of female suffrage seems to have had a larger estimated effect on competitiveness than did youth suffrage, as one might expect.
We interpret these causal effects as the product of increasing diversity within the electorate (the second strategic mechanism, as laid out earlier). Admitting new voters with distinctive interests and values should enhance electoral competition. Although the admission of women and youth did not upset established party systems in any country (at least not immediately), our analysis suggests that it attenuated the hold of dominant parties at the constituency level. Indeed, studies of female suffrage suggest that newly admitted voters were not carbon copies of the existing electorate: Women voted differently (sometimes more conservatively) than men (Inglehart & Norris Reference Inglehart and Norris2000; Harvey Reference Harvey1998: 146–51). Although youth vote-choice subsequent to franchise extension has not been extensively studied, our data also suggest that 18- to 21-year-olds behaved somewhat differently in the voting booth than adults.
FUNCTIONAL FORM
In this section, we explore alternate functional forms in the relationship between Competitiveness and Electorate. Note that some of the additional figures and tables referenced here are located in Online Appendix A.
The benchmark indicator of Competitiveness—100 minus the vote share of the largest party—is characterized by a large mode at zero, signaling the absence of any competition, as shown in Figure A2. This sort of truncated distribution may be handled by Tobit models. However, Tobit models are not tractable with our immense sample and benchmark specification (even without district fixed effects). In Table A7, therefore, we test several alternate measures of the outcome. In Model 1, we exclude observations where competitiveness equaled 0, leaving us with a sample of observations that approaches a normal distribution. In Model 2, we construct a binary measure of competitiveness (0 if Competitiveness = 0, 1 if Competitiveness>0), analyzed with a logit estimator. Both analyses show a strong, positive relationship between electorate and competitiveness, suggesting that the results reported in Table 1 are not the product of an inappropriate application of linear models.
The next set of tests in Table A7 addresses possible non-linearities in the relationship between Electorate (logged) and Competitiveness. Model 3 restricts the data to districts with less than 3,000 people, Model 4 to districts with 3,000 to 500,000 people, and Model 5 to districts with more than 500,000 people. In all three cases the estimated coefficient for Electorate is positive and significant, suggesting that the relationship is indeed monotonic.
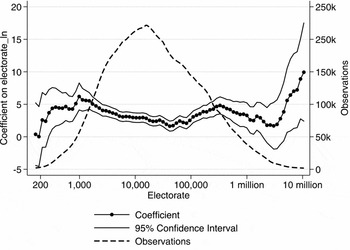
This approach to functional form is pursued at greater length in a set of rolling regressions whose results are displayed graphically in Figure 2. Here, we divide the observable range of Electorate torate (ln) into percentiles based on the actual range of values (i.e., the first and last values) in our sample. Each regression test replicates the benchmark model (Model 1, Table 1) for a quintile of the sample. The first model includes bins 1–20, the second model includes bins 2–21, and so forth through the final quintile, which is composed of bins 81–100. Figure 2 plots the coefficient and 95% confidence interval for Electorate (ln) for each of the 81 rolling regressions. The right axis marks the number of observations included in each regression. The coefficient for Electorate is positive for all subsets of the data and is statistically significant at the 95% level for all models except those lying near the extremes of the distribution, where data are sparse and confidence intervals correspondingly large. More specifically, as electorate size moves from 250 or so (an extremely small electorate) to roughly 5 million (an extremely large electorate), the quintile subsamples generate coefficient estimates that range from 2 to 6, closely replicating results shown in Table 1. The extremes are more difficult to interpret—they are lower at the low end and higher at the high end—but with extremely large confidence intervals because of the sparseness of data. As with any analysis, one should be wary of projecting relationships beyond the reach of the data at hand.
Rolling Regression

Rather than imposing an arbitrary window one may adopt the span algorithm and smoothing functions of a generalized additive model (GAM) (Wood Reference Wood2006). Unfortunately, GAM turns out to be computationally intractable with a large number of fixed effects. Note that there are 79,658 districts in our benchmark model (Model 1, Table 1).Footnote 13 Thus, we substitute a simpler model with only year, country, and electoral system fixed effects. Results are graphed in Figure A7. Because it departs from our benchmark model we regard this test of functional form as less satisfactory than the rolling regressions presented in Figure 2. Nonetheless, Figure A7 demonstrates a relationship between Electorate and Competitiveness that is monotonic, with the strongest causal effects registered at the low end of the spectrum (where electorate size is relatively small).
Finally, we explore the possibility of nonlinearity with polynomials: a quadratic term (Electorate, logged, squared) and a cubic term (Electorate, logged, cubed), as shown in Table A8. Here, we replicate all models in Table 1 except Models 3–4 (which have no obvious interpretation in a cubic model). For ease of comparison, model numbers in Table A8 follow those in Table 1. As shown, the quadratic and cubic terms are highly unstable: They are sometimes positive and sometimes negative, sometimes significant and sometimes insignificant in these 12 models. Equally important, the polynomial models suggest that if there is a curvilinear relationship between electorate and competitiveness it becomes non-monotonic only at the upper reaches of the distribution.
The empirical evidence reviewed here offers fairly strong support for the functional form adopted in our benchmark model, in which Competitiveness is modeled as a product of the loglinear form of Electorate. More important, we find no theoretically grounded justification for departing from this simple, well-trodden model. To review, there are strong reasons for supposing that the effect of electorate size on competitiveness increases in a monotonic fashion, as argued (implicitly) in our theoretical discussion. There are also strong reasons for supposing that the impact of an increase (decrease) in electorate size matters more at the low end than at the high end. That is, the relationship seems likely to be subject to marginally decreasing effects. The logarithmic form allows us to model this relationship as a percent increase in electorate size, a plausible assumption.
To be sure, complex models with additional parameters often provide a better overall fit for the data. However, if one's goal is causal inference one must be wary of curve fitting (i.e., allowing available data in a sample to determine functional form). One must be especially cautious when data are not sampled randomly from a known population. Thus, we take our guide from theory and from extant work. The logarithmic transformation is the usual approach taken when population serves on the right side of a causal model. We see no reason to suppose that the functional form for competitiveness should be any different than the functional form used for many other outcomes in economics, political science, and sociology. Departures from a well-established practice such as this would require strong theoretical priors.
Naturally, we cannot preclude the possibility of a different non-monotonic functional form that might offer a better or more complete explanation for the relationship between size and competitiveness. In particular, it is possible that at the extremes, where electorate size is extremely small or extremely large (values where the MLEA dataset is sparse), a non-monotonic relationship exists. We leave this matter open for future research.
IMPLICATIONS
We have argued that the size of an electorate conditions the degree of contestation (as measured by various indicators of competitiveness) within that district, and we have shown that this relationship persists across a wide variety of specifications, samples, time periods, and estimators. Further discussion of causal identification, along with several additional tests, is contained in Online Appendix G. We now consider the implications of the size/contestation relationship for questions of institutional design.
Where elections are conducted with SMDs, the size of a legislature determines the number of districts and hence their average population size. Insofar as district size affects competitiveness, smaller legislatures will have larger—and therefore more competitive—districts, on average. A large seat/population ratio, as in the United Kingdom (averaging about 68,000 constituents per MP), depresses competitiveness relative to what one would otherwise expect. Likewise, a small seat/population ratio, as in India (averaging about 2,228,000 constituents per MP), enhances competitiveness relative to what one would otherwise expect. Although the United Kingdom and India are very different polities, rendering suspect any direct comparisons, it is noteworthy that district-level competitiveness for the House of Commons is considerably lower (~39) than for the Lok Sabha (~51).
The same dynamic obtains in legislatures elected from MMDs, so long as the number of seats per district is also held constant. In this fashion, we may compare elections to national legislatures with similar average district magnitudes such as in Sweden (M = 12) and in Finland (M = 14) in the 1907–2007 period. In Sweden, where districts are relatively small (~38,000), district-level competitiveness is modest (~55). In Finland, where districts are comparatively large (~157,000), district-level competitiveness is higher (~60).
A similar logic may be applied to fundamental constitutional features of a polity such as directly elected executives. Presidents, governors, and mayors draw on constituencies equal in size to the accompanying legislature. Therefore, unless the legislature is drawn from a single district (a la Israel and the Netherlands at national levels or Brazil at the state level), one can anticipate greater competitiveness in executive elections than in the corresponding legislative election. It follows that whatever benefits may derive from contestation (as reviewed at the outset) will apply differentially to the executive and the legislative. It also follows that the decision whether to have a directly elected executive (or not) has important implications for the overall level of contestation in a country.
Consider, finally, levels of centralization or decentralization in a polity. Higher level political bodies, almost without exception, are chosen by larger electorates. A presidential district is larger than a gubernatorial or mayoral district; likewise, the district for a national legislature is larger than a district for a state legislature or municipal council. Because countries tend to retain institutional isomorphism across levels, the main difference between national, regional, and local governmental structures is often the size of the corresponding districts. Our findings suggest that higher level bodies will generate higher levels of contestation because they tend to be chosen from larger districts. It follows that any move to decentralize political authority within a state (Schneider Reference Schneider2003) or to multiply regional or local governments (Grossman and Lewis Reference Grossman and Lewis2014) has the effect of resituating political decision making to a lower contestation venue (contra Faguet Reference Faguet2014). The possible consequences of this shift in political power should be borne in mind when decentralizing reforms are considered.
Of course, it might be argued that contestation is less essential at local levels than at national levels. In scoping down, one resituates decision making to a venue where electorates are presumably more homogeneous—sharing common values, interests, and preferences. Here, perhaps, deliberation can occur without the mediating institutions of party politics. From this perspective, the relationship between size and contestation that we have identified is a functional one. The smaller the district, the less contestation there is—but also the less contestation is required to realize the democratic ideal of rule by the people. This would be a happy resolution of the size dilemma.
Unfortunately, the tradeoff between district size and contestation is unlikely to be beneficent in settings where localities are characterized by gross inequalities of wealth; where a single industry dominates the local economy; where societies are stratified by ethnicity, race, or caste; where traditions of civil liberty and tolerance are weak; or where violence is rife. In these settings, local districts are more apt to be characterized by elite capture than Habermasian deliberation (Bardhan and Mookherjee Reference Bardhan and Mookherjee2000). In these settings, which probably describe most of the developing world as well as the OECD in previous historical eras (Dinkin Reference Dinkin1977; O’Leary Reference O’Leary1962; Posada-Carbo Reference Posada-Carbo1996; Ziblatt Reference Ziblatt2009), a low level of competitiveness is unlikely to lead to governance outcomes that benefit everyone. Size matters wherever competitiveness matters to the quality of democracy, and competitiveness is a key element of democracy in most settings, insofar as we can tell.
That said, it is important to recognize that contestation is not the sum total of democracy. Whatever positive effects size might have on contestation must be considered alongside other outcomes associated with the democratic ideal. Extant work suggests, for example, that population size is inversely related to levels of participation (Oliver Reference Oliver2000; Remmer Reference Remmer2010) and to feelings of political efficacy (Bowen Reference Bowen2010; Lassen and Serritzlew Reference Lassen and Serritzlew2011). If so, the size of constituencies has differential impacts on the quality of democracy when judged across various dimensions of that multivalent concept.
SUPPLEMENTARY MATERIALS
To view supplementary material for this article, please visit http://dx.doi.org/10.1017/S0003055415000234




Comments
No Comments have been published for this article.