Affluent youth are a “newly identified at-risk group,” according to an editorial statement in Journal of the American Academy of Child & Adolescent Psychiatry (Koplewicz, Gurian, & Williams, Reference Koplewicz, Gurian and Williams2009, p. 1053). The authors note that affluenza, a metaphorical illness connoting hyperinvestment in material wealth, is rapidly spreading among upper-middle class, white-collar families. The children concomitantly show elevations in various maladjustment domains (substance use, depression, and anxiety), indicating the urgent need for preventive interventions (Koplewicz et al., Reference Koplewicz, Gurian and Williams2009). In support of their arguments, the authors cite review articles as well as empirical research by our group on suburban youth in the Northeast (Luthar, Reference Luthar2003; Luthar & Becker, Reference Luthar and Becker2002; Luthar & Latendresse, Reference Luthar and Latendresse2005a).
At this stage, we know little about the generalizability of our early findings. As reported in our 2005 review (Luthar & Latendresse, Reference Luthar and Latendresse2005a), our first affluent cohort comprised high schoolers from an affluent Northeastern suburb (Luthar & D'Avanzo, Reference Luthar and D'Avanzo1999). Cohort II and Cohort III were middle schoolers from another suburb in the Northeast, with the former assessed cross-sectionally and the latter followed over time. Overall, findings with Cohort III, also known as the New England Study of Suburban Youth (NESSY) cohort, did show elevations in problems starting at around the seventh grade (Luthar & Becker, Reference Luthar and Becker2002; Luthar & Latendresse, Reference Luthar and Latendresse2005b), and escalating by the 10th and 11th grades (Luthar & Ansary, Reference Luthar and Ansary2005; Luthar & Goldstein, Reference Luthar and Goldstein2008).
What remains to be seen is the degree to which (a) NESSY students experienced elevated problems even when well past the major stress of college admissions (at the end of high school), and, more importantly, (b) whether our early findings might generalize across disparate geographical areas, which is more important. To illustrate, youth in suburbs might be more prone to boredom, and thus to problem behaviors including substance use, than those in large cities where there are multiple opportunities for “safe” leisure activities such as theater, music, or sports (Luthar & Latendresse, Reference Luthar and Latendresse2005a).
Accordingly, in this paper, we present data on three samples of youth. For comparison purposes, we present data from the NESSY cohort as they were completing their senior year of high school. In addition, we present data for 11th and 12th graders from (a) a suburban public school in the Northwest and (b) an independent school in a large East Coast city.
Outcome Domains
In research on resilience and vulnerability, it is logical to focus primarily on those outcome domains that are most threatened by the “risk factor” studied (Luthar, Reference Luthar, Cicchetti and Cohen2006; Luthar & Brown, Reference Luthar and Brown2007; Luthar, Cicchetti, & Becker, Reference Luthar, Cicchetti and Becker2000). Accordingly, we focus here on spheres where youth in wealthy, ultra achievement-oriented communities are likely to be vulnerable. These include the frequency of substance use (including alcohol, marijuana, and cigarettes), as well as rebellious, rule-breaking behaviors (Ansary & Luthar, Reference Ansary and Luthar2009; Luthar & Goldstein, Reference Luthar and Goldstein2008). In the internalizing category, our focus is on anxious/depressed as well as somatic problems, which often derive from underlying distress.
We consider these domains with two sets of questions in mind. The first is whether students in any of the three geographically disparate cohorts might actually show “normal” patterns of adjustment problems, when compared against the yardstick of national normative data. The second question concerns vulnerability and protective factors. What are the major dimensions distinguishing youth who overindulge in substance use, for example, compared to those who do not?
Risk Modifiers: Replicating Prior Findings and Exploring New Constructs
In examining potentially salient risk modifiers, our goal is to replicate prior findings and also consider new potentially important constructs. Our first set of our replicative analyses is aimed at corroborating the claim that “overinvolvement” in extracurricular activities is, in essence, a scapegoat in explaining the distress of the most troubled affluent youth. Among eighth graders (the NESSY cohort), Luthar, Shoum, and Brown (Reference Luthar, Shoum and Brown2006) showed that the number of hours in extracurriculars explained minimal variance in children's maladjustment scores; far more important were aspects of family relationships, particularly high levels of parent criticism, and low expectations for adolescents’ achievement.
This pattern may hold true for older teens as well; yet, it is plausible that the pressures from extracurriculars do affect students in the thick of the college application process. In academically elite communities, establishing one's “stardom” at extracurriculars could, conceivably, be a source of much pressure for high school juniors and seniors.
We also attempt to replicate, across our three disparate samples, the importance of perceived parent “containment,” particularly for substance use (Luthar & Goldstein, Reference Luthar and Goldstein2008). This construct captures youngsters’ beliefs that parents will impose serious consequences for various misbehaviors. Among 11th grade suburban youth, we found that even after considering many other parenting dimensions, parenting containment for substance use was strongly associated with levels of use among both girls and boys (Luthar & Goldstein, Reference Luthar and Goldstein2008).
Finally, we seek to replicate findings on stronger links, with early adolescents’ self-reported distress, of the quality of relationships with their mothers as opposed to fathers (Luthar & Becker, Reference Luthar and Becker2002). It is unclear whether trends previously documented among middle school students will also hold true among youth who are in late adolescence.
New Parenting Dimensions Explored
Guided by qualitative research (as we were, in assessing parent containment; see Luthar & Goldstein, Reference Luthar and Goldstein2008), we created a measure to explore another potential risk modifier: parents’ tendencies to bail their teenagers of out problem situations. There are ubiquitous suggestions in the popular press that rather than letting their teens suffer the consequences of rash, illicit behaviors, affluent parents routinely intervene and inappropriately protect their offspring (e.g., Marano, Reference Marano2008; Mogel, Reference Mogel2001).
A second dimension we explored was adolescent perceptions of parents’ depression. Parental depression is a particularly insidious risk factor, as it pervades not only specific aspects of parent functioning but also the overall ambience in the home (Beardslee, Reference Beardslee2002; Hammen, Bistricky, & Ingram, Reference Hammen, Bistricky, Ingram, Ingram and Price2010; Luthar & Sexton, Reference Luthar and Sexton2007). Whereas the effects of maternal depression on youth are well documented, we considered, here, associations for paternal depression as well. In upper middle-class communities, fathers are more often than not the primary wage earners. With the vicissitudes of the American economy over the last decade and several high wage earners losing some or much of their previously guaranteed earnings, distress among affected fathers may well spread to others in the family.
Summary
In his early, pioneering works on resilience, Norman Garmezy presciently showed that family poverty does not necessarily connote youth maladjustment, as several critical protective processes can promote positive outcomes (Garmezy, Reference Garmezy1971, Reference Garmezy1974). In the last decade, our own research has suggested a parallel postulate at the other end of the socioeconomic status; that is, that family wealth can connote significant risks to adolescents’ adjustment. Based largely on studies of suburban students in the Northeast, we have attempted to illuminate salient factors that differentiate the more poorly functioning “privileged” youth from others.
Extending our past work, in this report on affluent high school students, we seek first to determine if elevations in maladjustment previously seen in the East Coast suburbs might generalize to Northwest suburbs, and to students in a large East Coast city. Second, we seek to replicate earlier findings (a) of the importance of parental containment for substance use, and of relationships with mothers more so than fathers; and (b) that extracurricular activity involvement is not a potent vulnerability factor. Finally, we aim to explore the potential significance of two risk modifiers not previously considered among affluent youth; that is, parents bailing their teens out of “problem situations,” and adolescents’ perceptions of depression in both mothers and fathers.
Methods
Sample
As noted earlier, we present data from the NESSY cohort, involving a group of suburban students first studied when they were in the sixth grade (Luthar & Latendresse, Reference Luthar and Latendresse2005b) and followed annually ever since. Our analyses here are based on (a) the NESSY cohort on completing high school, and on 11th and 12th graders from (b) a suburban public school in the Northwest and (c) an independent school in a large East Coast city.
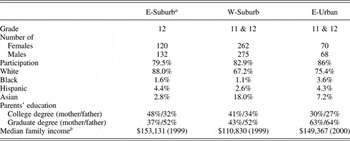
Characteristics of samples are shown in Table 1. As seen there, most students at all three schools came from Caucasian families, with highly educated parents. Median family incomes were almost three times the national level of about $50,000 in 2000 (United States Bureau of the Census, 2000). Overall, therefore, all three samples were clearly from upper middle class backgrounds.
Description of participating samples

Note: E-Suburb, East Coast suburban sample; W-Suburb, Northwest Coast suburban sample; E-Urban, East Coast urban sample.
aParticipants in the longitudinal New England Study of Suburban Youth (Luthar & Goldstein, Reference Luthar and Goldstein2008).
bFrom Census data.
As in our prior studies, students’ participation was based on passive consent procedures, as data collections were done as part of school-based initiatives on positive youth development. To ensure that parents were well informed, administrators sent letters to all homes via US mail before each wave of data collection. Students were informed that their participation was voluntary and on completion of data collection, questionnaires were stored with subject numbers as identifiers (for further details on methods and procedures, please see Luthar & Goldstein, Reference Luthar and Goldstein2008; Yates, Tracy, & Luthar, Reference Yates, Tracy and Luthar2008).
Procedure
All three samples were assessed during May of their senior year (2005, 2006, and 2006 for the East-Suburb, West-Suburb, and East-Urban samples, respectively). All measures were administered in groups. NESSY students, who were completing their sixth annual assessment for this study, received a $30 gift certificate. Administrators at the other two schools did not wish to provide students with incentives; despite this, participation rates were over 80% (see Table 1).
Measures
Unless otherwise indicated, all measures have been used in our past research (Luthar & Goldstein, Reference Luthar and Goldstein2008; Luthar et al., Reference Luthar, Shoum and Brown2006) with good reliability and validity. In this study, alpha coefficients of the various subscales were generally similar across schools; in the interest of brevity, we provide average values for girls and boys across the three samples.
Substance use
We used the Monitoring the Future Study Survey (Johnston, O'Malley, & Bachman, Reference Johnston, O'Malley and Bachman1984), which has well-documented reliability and validity. As in our previous studies (Luthar & Becker, Reference Luthar and Becker2002; Luthar & Goldstein, Reference Luthar and Goldstein2008), we created a composite substance use variable by adding scores for cigarettes, alcohol, and marijuana. Alpha coefficients in this sample were 0.79 and 0.77 for girls and boys, respectively.
Rule breaking
The Youth Self-Report (YSR; Achenbach & Rescorla, Reference Achenbach and Rescorla2001) contains 112 items encompassing internalizing and externalizing domains (Achenbach & Rescorla, Reference Achenbach and Rescorla2001). The externalizing subscale central to our analyses, rule breaking, had α values of 0.76 and 0.77 for females and males, respectively, in this study. (Coefficients for aggressive behavior were 0.81 and 0.84, respectively.)
Anxious–depressed and somatic complaints
These two YSR internalizing subscales (Achenbach & Rescorla, Reference Achenbach and Rescorla2001), central to our analyses, had respective α values of 0.85 and 0.77 among girls and 0.84 and 0.82 among boys. (Coefficients for withdrawn–depressed were 0.75 and 0.77 among girls and boys, respectively.)
Perceived parent containment
Based on a 14-item, 5-point scale, Luthar and Goldstein (Reference Luthar and Goldstein2008) assessed the seriousness of students’ anticipated parental repercussions on discovering different errant teen behaviors across four areas of nonconformity: substance use, delinquency, rudeness, and academic disengagement. In this study, reliability coefficients among females and males respectively were as follows for the respective four subscales: 0.88 and 0.91, 0.84 and 0.84, 0.74 and 0.80, and 0.73 and 0.71.
Closeness to parents
The Inventory of Parent and Peer Attachment (IPPA; Armsden & Greenberg, Reference Armsden and Greenberg1987), contains 50 items (25 pertaining to each parent) rated on a 5-point scale. Scores are obtained for an overall attachment score as well as three subscale scores, for which we obtained the following α coefficients for mother/father in this sample: trust: girls, 0.94/0.94, boys, 0.91/0.92; communication: girls, 0.93/0.91, boys, 0.86/0.87; alienation: girls, 0.85/0.83, boys, 0.76/0.79.
Parent criticism
We used the four-item subscale of the Multidimensional Perfectionism Scale (Frost, Marten, Lahart, & Rosenblate, Reference Frost, Marten, Lahart and Rosenblate1990), including items such as, “I am punished for doing things less than perfectly.” Alpha coefficients were 0.82 and 0.78 among girls and boys, respectively, in this sample.
Parent expectations
The five-item parental expectations subscale of the Multidimensional Perfectionism Scale (Frost et al., Reference Frost, Marten, Lahart and Rosenblate1990), with items such as, “My parents set very high standards for me,” yielded α coefficients of 0.81 and 0.80 for girls and boys, respectively.
Parent knowledge
Participants were asked about how much their parents know about their activities (Luthar & Goldstein, Reference Luthar and Goldstein2008), via a five-item, 5-point scale. Illustrative items include “My parents know where I am after school,” and “My parents know who my friends are.” Alpha coefficients were 0.84 and 0.79 for girls and boys, respectively.
Extracurricular involvement
Following Luthar et al. (Reference Luthar, Shoum and Brown2006), we asked students about the number of hours (range = 0–8 or more) spent in four categories of activities outside of school hours and in the presence of an adult. These categories included sports, art or theater, academic activities, and civic activities.
New parenting dimensions assessed: Parent bailing out
As in our previous research on complex aspects of parent–child relations (Luthar, Doyle, Suchman, & Mayes, Reference Luthar, Doyle, Suchman and Mayes2001), we created a measure, consisting of six vignettes, of situations to assess the degree to which teens expected their parents would bail them out of problem situations. An example: “For a major academic course, you copied part of an essay from an internet source. The teacher discovered this and plans to fail you for cheating. Would your parents protest?” Responses were rated on a 5-point scale (definitely not to definitely, yes; see Appendix A). Internal consistency coefficients for the Parent Bailing Out (PBO) score were 0.73 and 0.72 for girls and boys, respectively.
To explore the validity of this measure, we correlated it with the four-parent containment scores, with which it should, conceptually, show strong links. Results showed only modest associations. Furthermore, simple correlations between PBO and outcome variables were generally small and nonsignificant, clearly indicating low predictive value.
Based on these initial findings, we did not consider PBO scores in multivariate analyses of our central hypotheses. We do, however, provide descriptive responses to the six vignettes (see the Results Section), both to inform current stereotypes about affluent parents and, potentially, to help guide future quantitative research on these issues.
Parent depression
The depression section of the Family History Screen (Weissman et al., Reference Weissman, Wickramaratne, Adams, Wolk, Verdeli and Olfson2000) was used to measure teen's perceptions of depressive symptoms in each parent (dichotomous responses: yes/no). Illustrative items are, “Did anyone in your family ever seem to experience greatly reduced interest or pleasure in everyday activities?” and “Did anyone ever seem more irritable than usual?” Alpha coefficients for mothers/fathers, respectively, were 0.67/0.64 among girls and 0.58/0.61 among boys.
Despite the modest reliability, both mother and father perceived depression showed multiple correlations with several parenting dimensions as well as outcomes. Thus, we elected to include this dimension in multivariate tests of central hypotheses.
Results
Descriptive data
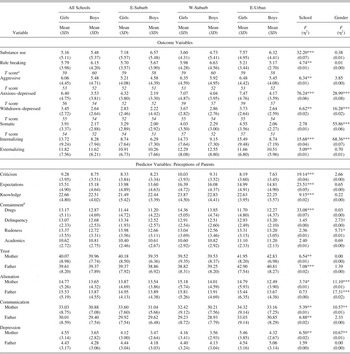
Table 2 presents means and standard deviations on all variables, separately by school and gender. A two-way (School × Gender) multivariate analysis of varianceFootnote 1 showed significant main effects for school (Wilks λ = 0.20, p < .001), and gender (Wilks λ = 0.81, p < .001). The interaction effect was not significant.
Means (standard deviations) on outcome variables and predictor variables
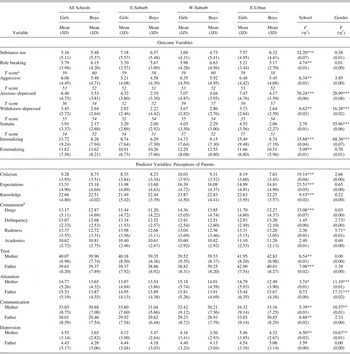
Note: E-Suburb, East Coast suburban sample; W-Suburb, Northwest Coast suburban sample; E-Urban, East Coast urban sample.
aSymptom means shown for Youth Self-Report subscales were first computed from raw data and then converted to T scores using normative sample charts.
bPerceived parent containment.
†p < .10. *p < .05. **p < .01. ***p < .001.
School differences were seen across most adjustment measures. As shown in Table 2, the East Coast suburban (E-Suburb) and East Coast urban (E-Urban) samples reported relatively high substance use, whereas the Northwest suburban (W-Suburb) and E-Suburb samples had relatively high internalizing and externalizing symptoms.
Among the predictor variables, the W-Suburb sample reported the highest parent containment for drugs (Cont-Drugs). At the same time, this group also had the most difficulties in parent–child relationships with the highest levels of criticism, expectations, and alienation from mothers, and the lowest trust and communication with mothers.
Regarding gender differences, girls reported higher levels of all internalizing symptoms than did boys. They also had higher scores on containment for rudeness and delinquency, and alienation from both fathers and mothers, while simultaneously reporting higher levels of communication with mothers.
Comparisons with national norms: Maladjustment
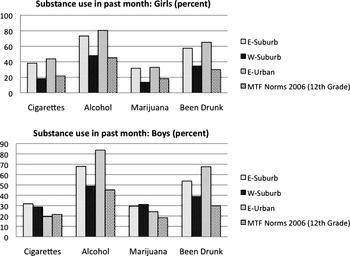
As in our past reports, we compared maladjustment levels among our samples with national normative data. Figure 1 displays results on substance use. For both genders, substance use levels were elevated, with the exception of W-Suburb girls’ cigarette and marijuana use. Use of alcohol, and frequency of being drunk, showed the most pronounced elevations, particularly in the two East Coast samples.
The percentage of students reporting substance use in the past month, compared to national norms (2006). National normative data are not available for girls and boys separately.

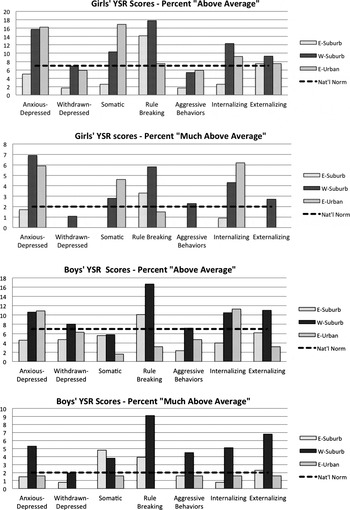
Figure 2 displays the proportion of youth falling above clinically significant symptom levels on the YSR. As we had expected for these affluent cohorts, we found no elevations on either withdrawn–depressed or aggressive behaviors. At the same time, we did see several elevations on the dimensions hypothesized to reflect vulnerability. The most striking result was that the E-Suburb youth (who were high on substance use; Figure 1) also had high rates of serious rule-breaking behaviors. The E-Urban youth, who were also high on substance use, reflected elevated proportions of anxious–depressed symptoms, as well as somatic problems among girls. Third, the W-Suburb sample, which was relatively low on substance use, showed the most pronounced vulnerability to serious rule-breaking behaviors and to anxious–depressed symptoms.
The incidence of clinically significant self-reported symptoms among participants, compared to national norms.

Overall, therefore, the findings show that none of these three affluent samples were at “low risk” (at, or below, national norms). Rather, each showed elevations in problems across multiple hypothesized areas of maladjustment.
Comparisons with national norms: Dimensions of parent–child relationships
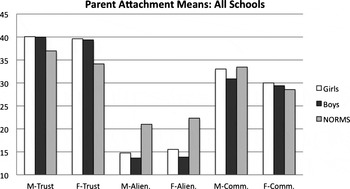
We conducted exploratory analyses to determine if as a group, affluent youth are relatively dissatisfied with parent–child relationships. Although national normative data are not available on the IPPA to our knowledge, we did obtain mean values on a socioeconomically diverse sample of 326 high school students (14–19 years old; Fosco & Grych, Reference Fosco and Grych2010). Figure 3 shows that, overall, mean parenting scores of affluent girls and boys were better than those in the other, more diverse sample.
Mean scores on the Inventory of Parent and Peer Attachment subscales compared with normative values. Values representing “norms” are from an economically diverse sample of teens (Fosco & Grych, Reference Fosco and Grych2010). M, mother; F, father; Alien., alienation; Comm., communication.

Parents’ “bailing out”: Descriptive data
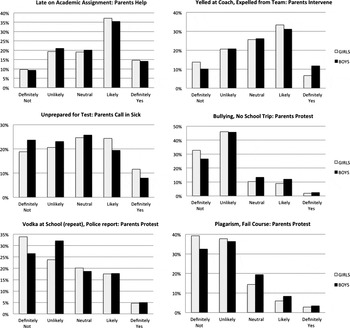
Figure 4 displays responses for the six vignettes of the PBO, across all three schools (responses were similar). As shown there, patterns varied according to seriousness of infractions; students believed their parents would be more likely to intervene for “minor” violations such as being unprepared for a test, than for major ones such as plagiarism. At the same time, about 1 in 10 students did anticipate parent intervention—probably or definitely—even for serious transgressions involving active plagiarism, as did over 20% for a repeat incident involving alcohol on the school premises.
Descriptive data on student responses to parent bailing out items.

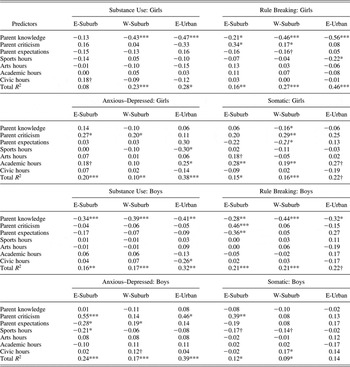
Multiple regression analyses: Replicating findings on containment
In examining the importance of parent containment dimensions, we controlled for other critical indices of parent child relations (Luthar & Goldstein, Reference Luthar and Goldstein2008): perceived criticism, expectations, and parent attachment. Rather than considering mother and father attachment separately, we included a single dimension (to conserve degrees of freedom, given the small sample size especially in the E-Urban school). Specifically, we considered the higher of the two attachment scores for mothers and fathers “attachment (maximum),” based on evidence of high protective effects of strong relationships with at least one caregiver (Luthar, Reference Luthar, Cicchetti and Cohen2006).Footnote 2
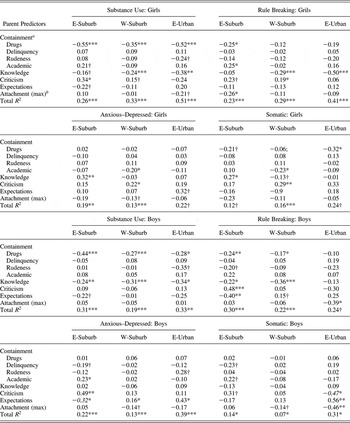
The results (see Table 3) provided unequivocal support for the importance of containment for adolescents’ substance use, across all schools and genders. Replicating Luthar and Goldstein's (2008) findings, furthermore, Cont-Drugs and parent knowledge both showed multiple associations with substance use as well as rule breaking. As expected, containment dimensions showed few significant associations with the two internalizing outcomes considered: anxious–depressed and somatic symptoms.
Parent containment versus other parenting dimensions for girls and boys

Note: Values in italics appear to be due to suppressor effects, because the statistically significant beta weights are opposite in valence to those in parallel zero-order correlations. Hence, they are not interpreted. E-Suburb, East Coast suburban sample; W-Suburb, Northwest Coast suburban sample; E-Urban, East Coast urban sample.
aPerceived parent containment.
bMaximum of mother/father attachment.
†p < .10. *p < .05. **p < .01. ***p < .001.
Exploratory analyses: Cont-Drugs
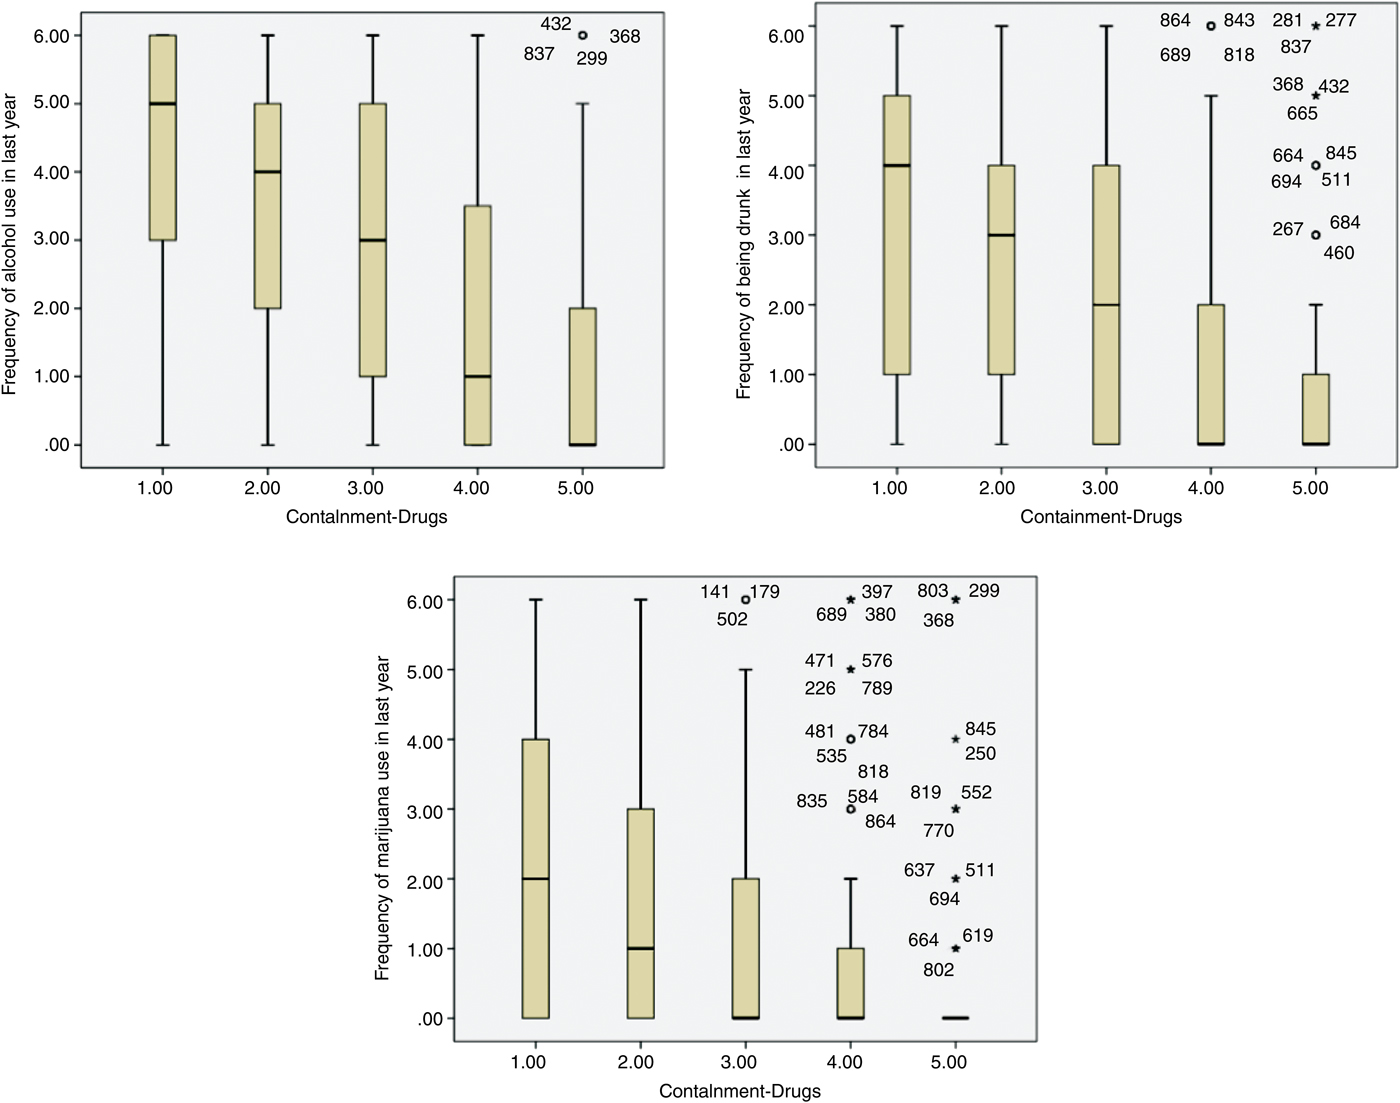
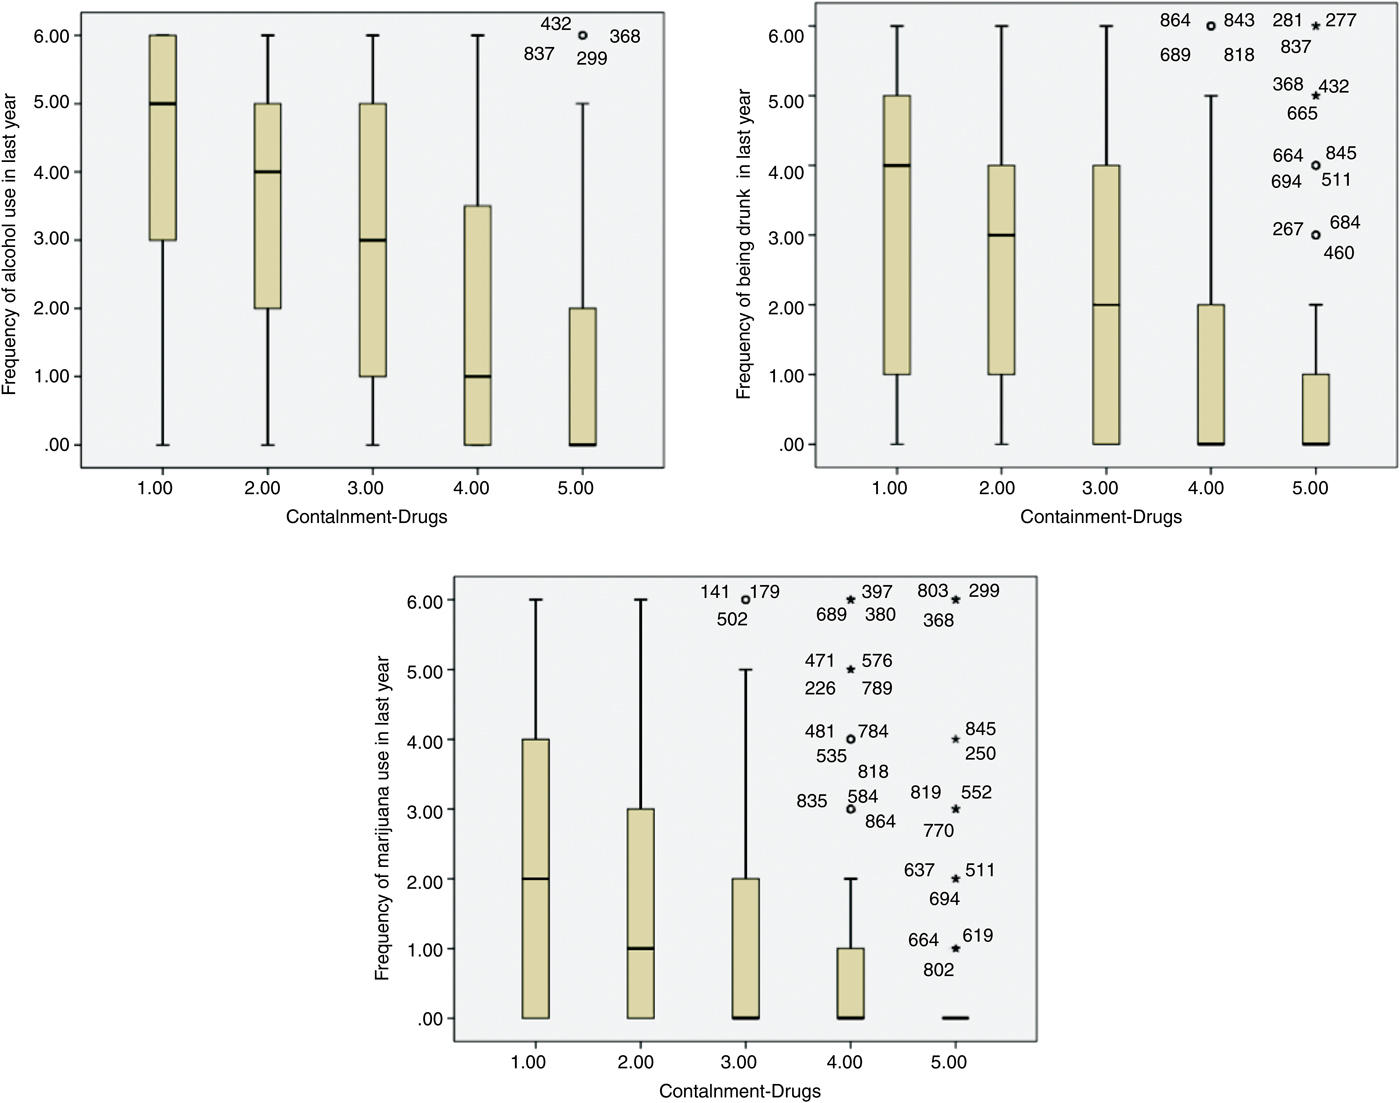
The mechanisms underlying our Cont-Drugs findings are not clear: it could be that very serious parent consequences are associated with abstinence from substances, or that extreme laxness with very high use, or both. We explored this issue by plotting, on the Y axis, distribution of use scores for alcohol and marijuana (the two most highly used substances), against seriousness of Cont-Drugs on the X axis. Results, shown in Figure 5, showed that at low Cont-Drugs, students tended to report high use of both alcohol and marijuana. At the highest levels of Cont-Drugs, alcohol use tended to be low, as might be expected. Drunkenness and marijuana use, however, showed considerable variations, suggesting that parents’ extreme consequences for substance use failed to serve as a guaranteed deterrent for at least some affluent teens.
Descriptive data on the frequency of alcohol use, being drunk, and marijuana use in the past year, by parent containment for drugs. The numbers in the graphs represent random subject ID numbers. (○) Outlier and (★) extreme outlier. The y axis values represent the number of times used per year: 0 = never, 1 = once or twice, 2 = 3–5 times, 3 = 6–9 times, 4 = 10–19 times, 5 = 20–39 times, and 6 = 40+ times. [A color version of this figure can be viewed online at http://journals.cambridge.org/dpp]
Multiple regression analyses: Replicating findings on extracurricular involvement
In our second set of regression analyses, we sought to replicate prior findings that “overscheduling” in extracurricular activities is not a potent “vulnerability factor,” once parenting dimensions are considered (Luthar et al., Reference Luthar, Shoum and Brown2006). The results (see Table 4) were remarkably consistent with earlier findings on eighth graders. Overall, there were negligible associations between hours spent in activities and maladjustment outcomes. There was just one exception: academic hours was linked with internalizing symptoms among girls, across all three schools.
Hours spent in extracurricular activities in relation to central adjustment outcomes for girls and boys

Note: Values in italics appear to be due to suppressor effects, because the statistically significant beta weights are opposite in valence to those in parallel zero-order correlations. Hence, they are not interpreted. E-Suburb, East Coast suburban sample; W-Suburb, Northwest Coast suburban sample; E-Urban, East Coast urban sample.
†p < .10. *p < .05. **p < .01. ***p < .001.
Multiple regression analyses: Dimensions of attachment to mothers versus fathers
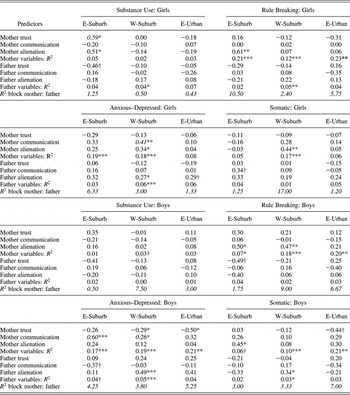
Table 5 presents the relative strength of mother versus father in predicting to teens’ adjustment outcomes. (We include substance use among the major outcome variables in this table merely for the sake of consistency; as we know from our prior work, it is proactive parental discipline, rather than closeness to either parent, that is most strongly related to affluent teens’ substance use.) The results provided in Table 5 are again consistent with prior findings on the critical importance of teens’ relationships with their mothers. For all three symptom domains (rule breaking, anxious–depressed, and somatic symptoms), block R squared values were higher for mother versus father variables—among both girls and boys, and in all three schools. The 18 ratios in question (see Table 5) ranged from 1.2 to a high of 17.0, with a median value of about 4.
Individual dimensions of parent attachment in relation to central adjustment outcomes for girls and boys

Note: Values in italics appear to be due to suppressor effects, because the statistically significant beta weights are opposite in valence to those in parallel zero-order correlations. Hence, they are not interpreted. E-Suburb, East Coast suburban sample; W-Suburb, Northwest Coast suburban sample; E-Urban, East Coast urban sample.
†p < .10. *p < .05. **p < .01. ***p < .001.
Results of these regressions also showed that of the three attachment dimensions, alienation (from mothers and fathers) was the only one to show multiple unique effects. Closeness and trust with each parent showed only sporadic links.
Multiple regression analyses: Perceived parental depression
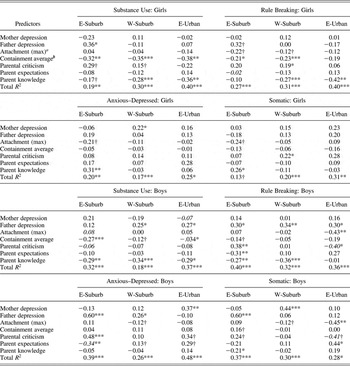
In exploring teen's perception of parent's depression, once again, we considered the maximum score of attachment to mother versus father in order to conserve degrees of freedom, and also considered the average containment score across the four subscales.Footnote 3 Even after considering the commonly tested aspects of parent–teen relationships, perceived father depression consistently emerged as a unique, significant predictor across multiple maladjustment outcomes among affluent boys (see Table 6).
Perceived parent depression in relation to central adjustment outcomes for girls and boys

Note: Values in italics appear to be due to suppressor effects, because the statistically significant beta weights are opposite in valence to those in parallel zero-order correlations. Hence, they are not interpreted. E-Suburb, East Coast suburban sample; W-Suburb, Northwest Coast suburban sample; E-Urban, East Coast urban sample.
aPerceived parent containment.
bMaximum of mother/father attachment.
†p < .10. *p < .05. **p < .01. ***p < .001.
Discussion
The results of this study corroborate suggestions that some “privileged” youth are actually at high risk for serious adjustment problems. Across three geographically diverse samples, adolescents reported elevations, compared to national norms, in one or more domains of substance use and/or rates of clinically significant internalizing and externalizing symptoms. Our findings strongly supported previous suggestions of covariance (a) of teens’ substance use, with anticipated parental repercussions on discovering their use, and (b) of symptom levels, with attachment to mothers more so than to fathers. Concomitantly, we corroborated that stress from too many extracurriculars is not a major “vulnerability factor.” Perceived parental tendency to bail teenagers out of problem situations was also apparently unrelated to maladjustment. Finally, we found that even after considering multiple dimensions of parent–child relationships, adolescent boys’ perceptions of fathers’ depression was related to multiple indices of distress. Each of these findings is discussed in turn.
Maladjustment among affluent youth
Among substance use indicators, the most striking finding was elevations in rates of drinking relative to norms, and in particular, of being drunk in the past month. Rates were pronounced among both the East Coast samples—suburban and urban—with over half of the girls and almost two-thirds of the boys reporting being drunk at least once in the past year (compared to about one-third of youth in norms).
Across the years, our focus groups with affluent teens have revealed several troubling trends regarding drinking. First, binge drinking is distressingly commonplace. Students have remarkably easy access to alcohol, with efficient systems in place to secure large amounts at a moment's notice. Second, youngsters frequently drink with the deliberate intention of getting drunk; and for every reported incident of serious intoxication, involving stomach-pumping, indiscreet sexuality, and/or violence, there are many others that go undetected by adults. Third, plans to “party hard” are often made as an antidote to the unrelenting stresses of “working hard” in order to achieve excellence across multiple domains of achievement (Luthar & Sexton, Reference Luthar, Sexton and Kail2004).
The trends we are seen in high school are also particularly worrying given the high rates of serious alcohol use on college campuses (Del Boca, Darkes, Greenbaum, & Goldman, Reference Del Boca, Darkes, Greenbaum and Goldman2004; Weitzman, Nelson, & Wechsler, Reference Weitzman, Nelson and Wechsler2003), with as many as 44.4% of college students reporting binge drinking (Wechsler et al., Reference Wechsler, Lee, Kuo, Seibring, Nelson and Lee2002). Furthermore, extreme drinking in college is particularly pronounced among students at highly competitive colleges (Wechsler et al., Reference Wechsler, Lee, Kuo, Seibring, Nelson and Lee2002) and those from affluent and better-educated families (Dantzer, Wardle, Fuller, Pampalone, & Steptoe, Reference Dantzer, Wardle, Fuller, Pampalone and Steptoe2006). Parallel findings have been reported with marijuana and illicit drug use (Gledhill-Hoyt, Lee, Strote, Wechsler, Reference Gledhill-Hoyt, Lee, Strote and Wechsler2000).
Admittedly, some adolescents eventually “mature out” of heavy drinking; at the same time, substance use during high school is among the strongest predictors of use during college (Reifman & Watson, Reference Reifman and Watson2003). Thus, at least a subgroup of our affluent samples is likely to show serious substance use in college. Similarly, there could be a decrease in use once these affluent samples complete college (given new social and career roles and responsibilities; see Schulenberg & Zarrett, Reference Schulenberg, Zarrett, Arnett and Tanner2006). Again, this possibility must be weighed against evidence that 40 and 70% of people remain stable in their drinking patterns (Jackson, Sher, Gotham, & Wood, Reference Jackson, Sher, Gotham and Wood2001), with alcohol abuse becoming serious for some (Schulenberg & Maggs, Reference Schulenberg and Maggs2002).
Aside from substance use, our three samples all showed elevations in one or more hypothesized serious internalizing and externalizing symptoms. It is interesting that the Northwest suburban youth (who were the lowest of the three samples on substance use) showed the highest vulnerability on anxious–depressed symptoms, as well as rule breaking. In previous research, this same group had also shown significant elevations on nonsuicidal self-injurious behavior (Yates et al., Reference Yates, Tracy and Luthar2008). It should be noted too that the Northwest suburban group had the poorest levels of attachment to parents, in five of the six dimensions we considered: trust, communication, and alienation in relation to mothers and fathers each; they were also the highest on parent criticism.
Across all three samples, the specific domains of students’ vulnerability, mirror, to some degree, the community concerns that had sparked research with the groups, respectively. All our studies of affluent samples had begun with requests from community/school leaders to help tackle specific areas of concern: substance use in the East Coast suburb; depression, suicidality, and feelings of isolation in the Northwest suburb; and generalized high stress levels in the East Coast independent school. Overall, therefore, the heterotypy in the specific types of maladjustment (Price & Ingram, Reference Price, Ingram, Ingram and Price2010) seen among affluent youth may, to some degree, be related to local community awareness and prevention efforts specific to each.Footnote 4
Vulnerability and protective factors: Predictors of adjustment problems
Among the “risk modifiers” we examined, findings were the most compelling on parents’ containment for substance use. Across all samples, youth reported high levels of use when they felt their parents were lax in consequences for substance use. At the same time, high Cont-Drugs in itself was not necessarily a fail-safe protective factor; youth with the strictest of parents were not necessarily abstinent. These findings probably reflect, in part, the power of peer influences, incredibly potent in sustaining high substance use in the subculture of affluent adolescence (Luthar & Becker, Reference Luthar and Becker2002). In addition, individual vulnerability factors could be implicated, including the tendencies to use substances in efforts to self-medicate (Brown, Reference Brown, Beauchaine and Hinshaw2008; Luthar & Becker, Reference Luthar and Becker2002; Luthar & D'Avanzo, Reference Luthar and D'Avanzo1999).
In addition to, and independent of, Cont-Drugs, parents’ knowledge of their children's whereabouts after school was linked to substance use and with rule-breaking behaviors across subgroups. As we noted earlier (Luthar & Sexton, Reference Luthar, Sexton and Kail2004), affluent parents may be less than vigilant of their children's activities, lulled into a sense of security given the physical safety of their neighborhoods. In addition, some teenagers routinely lie to their parents. Thus, the parents’ “lack of knowledge” may be as much a result of teenagers’ deliberately withholding information, as it is about parents’ lack of vigilance.
Of the affective indicators of parent–child relationships, parent criticism was the only dimension that showed relatively strong associations across subgroup analyses (although beta weights were sometimes nonsignificant, limited by sample sizes). The potency of this negative indicator, relative to others of a positive valence such as attachment, is supported by prior research on resilience: acrimony from parents to children is highly destructive, especially if it is a consistent pattern (Luthar, Reference Luthar, Cicchetti and Cohen2006).
As with prior results on eight graders (Luthar et al., Reference Luthar, Shoum and Brown2006), we found with parenting dimensions considered, hours in extracurricular activities was unrelated to maladjustment, even among these teens in the thick of “resume building” for college applications. There was just one dimension showing negative links: hours in academics was related to some form of internalizing symptoms among girls across geographic locations. Luthar et al. (Reference Luthar, Shoum and Brown2006) had also found this dimension to be related to multiple symptoms among girls. These findings probably reflect high pressures for girls to succeed across multiple areas: to be attractive, popular, well-behaved, and empathic, as well as every bit as academically proficient as boys (Hinshaw & Kranz, Reference Hinshaw and Kranz2009). Thus, it is plausible that girls who are struggling academically (and thus receiving extra help as in tutoring after school) are feeling the strains of the inordinately high expectations across multiple domains.
Supporting this argument, girls in all three schools reported higher anticipated consequences from parents for misbehavior across domains. Gender differences were significant for parental containment for rudeness and delinquency, as was shown by Luthar and Goldstein (Reference Luthar and Goldstein2008) with eighth graders. It is clear, therefore, that affluent young women face competing and sometimes impossible demands: (a) to be on par with boys in the male dominated worlds of academics and career and (b) and to surpass boys in the traditional, other-centered, feminine roles (Zahn-Waxler, Klimes-Dougan, & Slattery, Reference Zahn-Waxler, Klimes-Dougan and Slattery2000) of being well-behaved, polite, considerate, and physically attractive to boot (see Becker & Luthar, Reference Becker and Luthar2007).
Discrete aspects of relationships with mothers and with fathers
Our findings replicate earlier findings on the critical importance of relationships with mothers. As with younger affluent youth (Luthar & Becker, Reference Luthar and Becker2002), even the late adolescents in this sample showed much greater variations, in their self-reported symptoms, as a function of quality of relationships with mothers as opposed to fathers. Across the six analyses, the ratios of variance explained by the blocks of mother versus father attachment variables ranged from 1.2 to a high of 17.0, with a median value of almost 4. Similarly, alienation from mothers was the only parent attachment dimension to be linked with at least one maladjustment dimension across the multiple subsamples (with the exception of E-Urban youth).
That the magnitudes of adolescents’ mother-attachment associations were at least three times as as high (conservatively averaged) than those of father attachment, probably reflects, in part, differences in times spent with each parent. Mothers are generally primary caregivers of their children, across diverse cultural contexts. In affluent communities, children are even more likely to spend more time with their mothers than with fathers, as the latter are usually the primary wage earners with careers demanding long hours (Luthar & Sexton, Reference Luthar, Sexton and Kail2004).
Parent attachment relative to norms
Negative stereotypes about affluent parents are rampant, and they are sometimes fueled by trends in the popular media (perhaps inadvertently). Discussing her book called The Price of Privilege, author Madeline Levine (Reference Levine2008) was quoted in the New York Times as saying that, “wealthy parents today . . . are more likely to be emotionally distant from their children, and at the same time to insist on high levels of achievement, a potentially toxic blend of influences that can create ‘intense feelings of shame and hopelessness’ in affluent children” (Tough, Reference Tough2011).
This inference, which was cited as deriving from our research, is not entirely correct. Our programmatic studies do indicate, as contended, that, children of affluent parents exhibit “unexpectedly high rates of emotional problems beginning in junior high school” (Tough, Reference Tough2011). On the other hand, this by no means implies that all, or even most, wealthy youth are troubled, or that most of their parents are deficient in any way. To the contrary, we have explicitly asserted that our data counter presumptions of generally “poor” parenting in wealthy communities, which is a statement strongly supported by comparisons, in this study, of mean levels of parent attachment with values from economically diverse samples. We have repeatedly cautioned that, “. . . the range of perceived parenting adequacy is no more constrained among the very wealthy than the very poor” (Luthar & Latendresse, Reference Luthar and Latendresse2005b, p. 223). In all settings there are inevitably some parents who are disengaged, lax, or critical; and in all settings, the quality of parent–child relationships is inevitably related to children's adjustment outcomes.
Bailing out
Our exploratory analyses counter yet another widespread stereotype: that affluent parents inappropriately bail their children out of all offenses, minor and major. Based on his research in independent schools, Weissbourd (Reference Weissbourd2009, p. 118) describes views, among teachers, of parents as being “out of control,” tenaciously demanding them to overlook teen misbehaviors ranging from rudeness to plagiarism.
Data in this study show that from the children's perspective, parents’ anticipated intervention varies with the seriousness of offense, more likely with relatively minor infractions (being unprepared for a test) but not necessarily with egregious ones. At the same time, even in the latter category—incidents of outright plagiarism, and a repeat offense involving vodka at school—a distinct subgroup of youth believed their parents would, probably or definitely, protest on their behalf: about 10% for the former offense, and 23% for the latter. These data support Weissbourd's (Reference Weissbourd2009) assertion that in privileged settings, there is actually a subgroup of parents (albeit perhaps small) who aggressively, even litigiously, protest disciplinary actions imposed by schools.
Our failure to find links between parent bailing out scores and adjustment may partly be because this dimension, like “overinvolvement” in extracurriculars, does not really contribute to maladjustment. A second possibility is that there are curvilinear effects, with negative repercussions for parents either too willing, or inexorably unwilling to intervene, regardless of the infraction. A third possibility is that linear findings actually do exist and might be captured with refinements of our measure. Although the PBO had good reliability levels, it combines variations in both (a) type of offense (e.g., academic, substance use) and (b) seriousness of disciplinary actions. In future research, it might be useful to separately query problem behaviors in discrete areas, all engendering serious disciplinary actions from schools.
Parental depression
We were somewhat surprised to find multiple links between adolescent boys’ perceptions of fathers’ depression and both externalizing and internalizing symptoms. Several factors render these associations noteworthy. First, they emerged in stringent analyses, even after considering multiple aspects of parent–teen relationships. Second, as noted earlier, symptom levels of affluent boys and girls have consistently varied more relative to relationships with mothers than with fathers. Yet, there were no associations here for perceived depression among mothers.
It is possible that patterns we found among these older adolescent boys are a by-product of the young men's identification with their fathers. On the brink of leaving home to enter the “real world,” these young men may be particularly sensitive to fathers’ visible emotional vulnerability. Alternatively, it is plausible that depressive symptoms may be most manifest in the relationships between men in highly successful, demanding careers and their expectations for, and thus their interactions with, their almost-adult sons.
It is interesting that overall levels of perceived parental depression were generally commensurate among mothers and fathers, if not slightly higher among the latter; this is in stark contrast to the fact that adult women are twice as likely to experience depression than men (Hammen et al., Reference Hammen, Bistricky, Ingram, Ingram and Price2010). Our findings may well reflect gender differences in affluent parents’ willingness to seek help when depressed (men are typically more reluctant; see Hinshaw, Reference Hinshaw2007), and also, in how parents manifest their experienced distress. As Shelley Taylor (Reference Taylor2002, Reference Taylor2006) has extensively documented, males typically respond to threats and distress with tendencies to “fight or flight,” that is, behaviors that connote aggressiveness (irritability) or distancing. Women's instinctive defense mechanisms, by contrast, are to “tend and befriend,” and in particular, to focus on intensively nurturing their offspring. Thus, even though mothers in our research may have actually experienced as many or more symptoms of depression as fathers, their distress simply may not have been as evident in interactions with their children.
Limitations, caveats, and future directions for research and practice
Prominent among the limitations of this work is its cross-sectional nature; this precludes any firm conclusions about the direction of links documented here. It is just as likely, for example, that misbehavior among children leads to parental criticism and emotional withdrawal, as are links in the opposite direction. In the future, the use of longitudinal analyses could enhance understanding of the bidirectional links between different parent dimensions and adolescent outcomes.
The sole use of self-report indices to measure parent–adolescent relationships might be criticized, but this has reflected a deliberate choice in our ongoing programmatic research (Luthar & Becker, Reference Luthar and Becker2002; Luthar & Goldstein, Reference Luthar and Goldstein2008; Luthar & Latendresse, Reference Luthar and Latendresse2005b). Our interest is not so much in others’ opinions of parents’ effectiveness, but rather, in adolescents’ own perceptions of their relationships with parents, and how these perceptions might play out in different aspects of their adjustment.
There is a possibility of Type II errors in our findings, so that we did not identify some links that actually did exist. This is particularly true for the E-Urban sample, which was small in size, rendering significant none but the most substantial regression coefficients. Similarly, the reliability of measurement was low for perceived parental depression. In this regard, it should be noted that low reliability limits the likelihood of finding significant links rather than inflating them, so there is little question about the authenticity of significant associations that were found for this construct.
A final limitation is that family “affluence” is confounded with ethnicity in these samples as in others, with the wealthy families generally being of Caucasian backgrounds. Disentangling ethnicity and income in such research is difficult, however, given contemporary demographic patterns; multiple school districts will have to be sampled simultaneously to recruit sufficiently large cohorts of ethnic minority youth from very wealthy families (Luthar & Latendresse, Reference Luthar and Latendresse2005a).
In terms of future research directions, it will be useful to examine vulnerability and resilience among affluent youngsters via individual-based analyses rather than only variable-based ones (Luthar et al., Reference Luthar, Cicchetti and Becker2000; Masten, Reference Masten2007). Much could be learned from focusing on the subgroup of youth and families who stand out from others in being particularly troubled, and then identifying factors distinguishing them from groups who function well (e.g., Latendresse, Reference Latendresse2005; McMahon & Luthar, Reference McMahon and Luthar2006).
Concerted attention to both aspects of communities and of the students’ personal attributes is also critical. In empirically considering major risk modifiers, our attempts thus far have generally been to disentangle the relative significance of various perceived parenting dimensions, which are clearly critical for youth across contexts (Luthar, Reference Luthar, Cicchetti and Cohen2006). In future efforts to understand the major sources of pressure faced by affluent youth, it is important to examine also aspects of school climate (particularly rigorous expectations and standards around academics; see Anderson, Reference Anderson2011), peer relationships and romantic attachments, as well as individual attributes such as personal values and life goals.
Even as we continue to explore these various dimensions, one directive is already clear for practice and policy, based on our own findings and recently, those of others (see Chassin, Beltran, Lee, Haller, & Villalta, Reference Chassin, Beltran, Lee, Haller, Villalta, Ingram and Price2010; Hanson & Chen, Reference Hanson and Chen2007; Trim & Chassin, Reference Trim and Chassin2008). This is that parents must be particularly attentive to substance use among affluent youth. We admit that this is easier said than done, especially given that some experimentation with substances is normative—and even perhaps “healthy” (Shedler & Block, Reference Shedler and Block1990)—during adolescence. Thus, if parents were to categorically disallow 18-year-olds a single drink, even with appropriate adult supervision and discussions about the associated hazards, this could result in a backlash among youth as we have clearly seen in our focus groups. Draconian punitive measures often backfire, with teenagers simply disclosing less and less to their parents, resorting to frequent marijuana use (not as easily detected), and ultimately, engaging in binge drinking once away from home, at college. This said, parents would be wise to guard against extreme laxness around their adolescents’ use of substances. Particularly essential are clear, consistent messages about the unequivocal unacceptability of parties entailing unlimited consumption of alcohol. As common as such social events might be among today's affluent teens, the dangers are simply far too grave for adults to allow their occurrence, tacitly or otherwise.
With regard to parents’ relentless, and even unethical or illegal pursuit of their children's high achievement, our findings show that there is a subgroup of wealthy parents who do fit this profile, but this is by no means true for all or even most of them. Affluent adults are typically judged as complicit in their children's breaking the rules to “get ahead,” as exemplified in recent discoveries that several students paid another highly skilled youth to impersonate them while taking the SAT examinations (Anderson & Applebome, Reference Anderson and Applebome2011). In one investigative story, a parent was quoted as saying that “he could not ‘imagine that my child would be able to do that and come up with $1000 or $2000 and me not know about it’” (Anderson & Applebome, Reference Anderson and Applebome2011). Caution regarding such inferences is critical; our own work has shown that raising such sums of money can be trivial for many youth in affluent communities. Aside from misappropriating money from family or friends (see Luthar & Ansary, Reference Luthar and Ansary2005), income can easily be derived by writing academic papers for struggling students, for example, and from sales of alcohol and even marijuana to others.
Considering these issues in tandem, our central message regarding “privileged” parents is, first, that communities and schools adopt a strict zero-tolerance policy regarding students’ law breaking. Countering the few powerful, litigious parents who hotly protest punitive actions, the much larger group of civic-minded parents must equally vocally support administrators who, like the principal of the school involved in the SAT cheating described earlier, retain a “moral and legal obligation” to report criminal activities to the police (Anderson & Appelbome, 2011). In the words of the district attorney investigating these incidents, “We have to put accountability into the system, and there is none right now. . . . If we can't teach 16-, 17- and 18-year-olds that cheating is wrong,” she added, “shame on us” (Anderson & Appelbome, 2011).
Second, another message for parents is that they remain vigilant about their almost grown children's activities outside school. Even the brightest, most academically successful students (and sometimes, especially these) will be drawn to break the rules to get ahead, and as our data show, there can be strong protective effects if parents stay attuned to their children's friends and leisure activities, beginning even with relatively simple measures like being aware if cases of alcohol are stored in cars or in homes (for pending sales to other minors).
Third, we need more proactive prevention efforts for families in distress. Talks and workshops in affluent communities (Luthar & Sexton, Reference Luthar, Sexton and Kail2004), can be used to help parents see the potential harm, to their children (a) of their belittling, critical communication patterns, and (b) of high depressive problems in the parents themselves, for which they are reluctant to seek help. Particularly useful would be regular support groups held for mothers, who disproportionately shoulder the task of shepherding teens through the diverse challenges of life in privileged settings.
Of the most importance for practice and policy, we in science must proactively disseminate central research findings on this still little-studied “at-risk group,” including results of stringent multivariate analyses, as well as descriptive data that can direct future quantitative hypothesis testing (see Luthar, Reference Luthar1999). Above all, it is critical, always, to underscore that the “pressure-cooker” lives of affluent teens stem from a complex web of multiple influences. Problems in families certainly contribute, as they do in all contexts. The peer group actively reinforces substance use (Balsa, Homer, French, & Norton, Reference Balsa, Homer, French and Norton2010; Luthar& Latendresse, 2005a). Intimacy in close friendships, which is critical during adolescence, is inevitably thwarted by competition with one's closest friends (see Anderson, Reference Anderson2011). Schools relentlessly pursue attendance in college level courses, and the highest possible SAT scores. And ultimately, all these pressures stem from, and are reinforced by, these ubiquitous, core tenets in the macrocosm of American society: more is better; material wealth makes for ultimate happiness; and this, in turn, is best acquired through attendance at elite colleges.
Scientists must regularly describe these pressures to the lay public, via books, commentaries in newspapers, and workshops, with appropriate directions for change. Increasingly, we have seen effective models of such efforts, such as Schwartz's (Reference Schwartz2007) writings on ways to reduce academic pressures (e.g., with college admission decisions decided by lotteries of qualified applicants), Weissbourd's (Reference Weissbourd2011) descriptions about ways in which parents and teachers unwittingly contribute to students’ stress, and by Zimbardo's (as cited in Tugend, Reference Tugend2011) efforts to foster ethical decision-making patterns among high school students.
Conclusions
In his early writings on resilience among at-risk youth, Norm Garmezy (Reference Garmezy1971, Reference Garmezy1974, Reference Garmezy, Garmezy and Rutter1983) presciently established two principles that have remained cardinal within the field (Luthar, Reference Luthar, Cicchetti and Cohen2006). First, regardless of the risks in a particular socioeconomic setting, some children will thrive even as others falter. Second, that as we in science study resilience, we must retain a concerted focus on “modifiable modifiers.” We have attempted to live up to Garmezy's legacy in our decade-long research on ostensibly privileged youth, identifying aspects of family functioning that are strongly linked with youth maladjustment, and at the same time, are amenable to change via preventive interventions. Prominent among these salient risk modifiers are parents’ attitudes toward teen substance use; high levels of parent criticism and low expectations of their children; the quality of relationships with mothers, in particular; and teens’ perceptions of depressive problems in their parents. In our future work, we hope to further illuminate the most potent, tractable sets of factors at the community, individual, and family levels that can help youth thrive despite the relentless pressures of upward mobility in the culture of affluence—or what Kasser (Reference Kasser2002) has called “The American Nightmare.”
Appendix A: Measure of Parents Bailing Out
Directions: When teenagers get into trouble, parents differ in how quickly they come to defend their children. Please indicate how your parents would probably react in the following situations (according to a 5-point scale: 1 = definitely not, 2 = unlikely, 3 = neutral, 4 = likely, and 5 = definitely, yes).
1. You and a group of friends were seen laughing at a classmate in the hallway, making fun of the student and loudly using names such as “loser.” As punishment, the principal said you could not attend a fun overnight school trip for your grade. Would your parents protest?
2. You put off completing a very important school assignment, and it was due the next day. You could not finish it without help. Your parents knew that you had left it for the last minute. Would your parents help you with the assignment?
3. For the third time, you and your friends were caught with vodka on the school premises; the principal planned to report it to the police. Would your parents try and stop the report?
4. For a major academic course, you copied part of an essay from an internet source. The teacher discovered this and plans to fail you for cheating. Would your parents protest?
5. You are a star athlete but during a game, you lost your temper and yelled at the head coach. You were thrown off the team. Would your parents try and get you back on the team?
6. You have a test the next day and you feel stressed out and feel unprepared to take it. Would your parents call you in sick the next day to give you more time to study?