Introduction
Canola (Brassica napus L.), rapeseed/mustard (Brassica rapa L.), sunflower (Helianthus annus L.) and cotton (Gossypium hirsutum L.) are the major oilseed crops in Pakistan. Pakistan grows these oilseed crops on 3.32 × 10⁶ ha, producing 3.80 × 10⁶ t of grain yield and 0.57 × 10⁶ t of oil yield. Most of the oil produced is dedicated to meet the country's internal needs. However, Pakistan has to import edible oil to satisfy its increasing domestic consumption (Noreen et al., Reference Noreen, Noor, Ahmad, Bibi and Hasanuzzaman2016; Ahmad et al., Reference Ahmad, Abbas, Abbas, Fatima, Atique-ur-Rehman, Naz, Younis, Khan, Nasim, Habib ur Rehman, Ahmad, Rasul, Khan and Hasanuzzaman2017a, Reference Ahmad, Abbas, Fatima, Khan, Anjum, Ahmed, Khan, Porter and Hoogenboom2017b; Government of Pakistan, 2018; Tariq et al., Reference Tariq, Ahmad, Fahad, Abbas, Hussain, Fatima, Nasim, Mubeen, Habib ur Rehman, Khan, Adnan, Wilkerson and Hoogenboom2018). The average canola grain yield of 0.95 t/ha in Pakistan is very low compared to other canola-producing countries (Mahmood et al., Reference Mahmood, Ejaz-ul-Hasan, Ali and Hussain2012; Noreen et al., Reference Noreen, Noor, Ahmad, Bibi and Hasanuzzaman2016). This is mainly due to poor farmer management that results in a large gap with attainable yield. Factors such as management practices, genotype and environment determine crop yield. Understanding such factors can help in determining the magnitude of the yield-gap between attainable and farmer yield (Anderson et al., Reference Anderson, Johansen and Siddique2016; Dias and Sentelhas, Reference Dias and Sentelhas2018). For example, yield-gap analysis can help design guiding research and developing policies seeking to progress the livelihoods of resource-limited farmer communities. Yield-gap analysis might support site-specific recommendations aiming at developing sustainable practices within farming communities to better cope with in-season weather-related shocks that affect attainable yields (van Ittersum et al., Reference van Ittersum, Cassman, Grassini, Wolf, Tittonell and Hochman2013; Robertson et al., Reference Robertson, Kirkegaard, Peake, Creelman, Bell, Lilley, Midwood, Zhang, Kleven, Duff, Lawes and Riffkin2016). Yield-gap estimations can be obtained from field trials designed to minimize yield reducing factors (Boote et al., Reference Boote, Jones and Pickering1996; Affholder et al., Reference Affholder, Poeydebat, Corbeels, Scopel and Tittonell2013; Schulthess et al., Reference Schulthess, Timsina, Herrera and McDonald2013) -or process-based crop growth simulation models (Farre et al., Reference Farre, Robertson, Walton and Asseng2002; Abbas et al., Reference Abbas, Ahmad, Ahmad, Nasim, Fatima, Hussain, Habib ur Rehman, Khan, Hasanuzzaman, Fahad, Boote and Hoogenboom2017; Tariq et al., Reference Tariq, Ahmad, Fahad, Abbas, Hussain, Fatima, Nasim, Mubeen, Habib ur Rehman, Khan, Adnan, Wilkerson and Hoogenboom2018). When using crop simulation models, they must first be calibrated and evaluated for an extensive range of environments (Robertson and Lilley, Reference Robertson and Lilley2016). The major strength of the modelling approach is that they can integrate seasonal climate variability over several years with crop management to determine the magnitude and inconsistency of the attainable grain yield.
Crop simulation models have been extensively used to extrapolate results from field-specific research to larger areas (Probert et al., Reference Probert, Keating, Thompson and Parton1995; Bouman and van Laar, Reference Bouman and van Laar2006; Abbas et al., Reference Abbas, Ahmad, Ahmad, Nasim, Fatima, Hussain, Habib ur Rehman, Khan, Hasanuzzaman, Fahad, Boote and Hoogenboom2017; Tariq et al., Reference Tariq, Ahmad, Fahad, Abbas, Hussain, Fatima, Nasim, Mubeen, Habib ur Rehman, Khan, Adnan, Wilkerson and Hoogenboom2018) and have been applied to crop productivity analysis (Mourice et al., Reference Mourice, Rweyemamu, Tumbo and Amuri2014) and yield-gap analysis (Bindraban et al., Reference Bindraban, Stoorvogel, Jansen, Vlaming and Groot2000; Bhatia et al., Reference Bhatia, Singh, Wani, Chauhan, Kesava Rao, Mishra and Srinivas2008; Lobell et al., Reference Lobell, Cassman and Field2009; van Ittersum et al., Reference van Ittersum, Cassman, Grassini, Wolf, Tittonell and Hochman2013; Poulton et al., Reference Poulton, Vesna, Dalgliesh and Seng2015; Dias and Sentelhas, Reference Dias and Sentelhas2018; Zu et al., Reference Zu, Mi, Liu, He, Kuang, Fang, Ramp, Li, Wang, Chen, Li, Jin and Yu2018). Crop models within the Decision Support System for Agrotechnology Transfer (DSSAT; Jones et al., Reference Jones, Hoogenboom, Porter, Boote, Batchelor, Hunt, Wilkens, Singh, Gijsman and Ritchie2003; Hoogenboom et al., Reference Hoogenboom, Porter, Boote, Shelia, Wilkens, Singh, White, Asseng, Lizaso, Moreno, Pavan, Ogoshi, Hunt, Tsuji, Jones and Boote2019a, Reference Hoogenboom, Porter, Shelia, Boote, Singh, White, Hunt, Ogoshi, Lizaso, Koo, Asseng, Singels, Moreno and Jones2019b) are widely used for different environmental conditions and management practices (Jones et al., Reference Jones, Hoogenboom, Porter, Boote, Batchelor, Hunt, Wilkens, Singh, Gijsman and Ritchie2003; Timsina and Humphreys, Reference Timsina and Humphreys2006; Ahmad et al., Reference Ahmad, Ashfaq, Rasul, Wajid, Khaliq, Rasul, Saeed, Habib ur Rahman, Hussain, Baig, Naqvi, Bokhari, Ahmad, Naseem, Hoogenboom, Hillel and Rosenzweig2015; Abbas et al., Reference Abbas, Ahmad, Ahmad, Nasim, Fatima, Hussain, Habib ur Rehman, Khan, Hasanuzzaman, Fahad, Boote and Hoogenboom2017; Tariq et al., Reference Tariq, Ahmad, Fahad, Abbas, Hussain, Fatima, Nasim, Mubeen, Habib ur Rehman, Khan, Adnan, Wilkerson and Hoogenboom2018). The primary objective of crop simulation models is to determine crop productivity, resource management and environmental effect as a function of crop management practices, soil physiochemical characteristics and local weather conditions (Tsuji et al., Reference Tsuji, Hoogenboom and Thornton1998; Hoogenboom et al., Reference Hoogenboom, Porter, Boote, Shelia, Wilkens, Singh, White, Asseng, Lizaso, Moreno, Pavan, Ogoshi, Hunt, Tsuji, Jones and Boote2019a, Reference Hoogenboom, Porter, Shelia, Boote, Singh, White, Hunt, Ogoshi, Lizaso, Koo, Asseng, Singels, Moreno and Jones2019b). This ability of crop models may be used in conjunction with on-station trials, and farm surveys, to help advance our understanding of the yield-gap between current and attainable crop yield.
The low canola yield in Pakistan is associated with management practices such as sowing time, plant density, fertilizer and irrigation (Qian et al., Reference Qian, Jing, Bélanger, Shang, Huffman, Liu and Hoogenboom2018). Proper N and irrigation water management are both essential practices for maximum grain and oil yield of canola. Nitrogen affects canola growth and development (Ozer, Reference Ozer2003) and grain and oil yield (Rathke and Schuster, Reference Rathke, Schuster, Horst, Schenk, Burkert, Claassen, Flessa, Frommer, Goldbach, Olfs, Romheld, Sattelmacher, Schmidhalter, Schubert, Wiren and Wittenmayer2001). Fertilization strategies such as split applications of N fertilizer have resulted in an increase in canola grain yield and quality (Faramarzi et al., Reference Faramarzi, Barzegar, Zolleh, Mohammadi, Ardakani and Normohammadi2009a, Reference Faramarzi, Abbaspour, Schulin and Yang2009b; Jing et al., Reference Jing, Shang, Qian, Hoogenboom, Huffman, Liu, Ma, Geng, Jiao, Kovacs and Walters2016) and a reduction of N losses via leaching, denitrification, runoff/erosion and volatilization (Grant et al., Reference Grant, Wu, Selles, Harker, Clayton, Bittman, Zebarth and Lupwayi2012; Fatima et al., Reference Fatima, Abbas, Khan, Hussain, Ali, Abbas, Younis, Naz, Ismail, Shahzad, Nadeem, Farooq, Khan, Javed, Khan, Ahmed, Khan and Ahmad2018). Previous studies have shown that canola grain yield increases when N is split into two side-dress applications (1/2 at sowing and 1/2 at first irrigation) (Tamagno et al., Reference Tamagno, Chamorro and Sarandon1999) or 50–70% of N applied as a basal dose and a top dressing (Ali and Ullah, Reference Ali and Ullah1995).
Best irrigation management practices are also helpful in increasing canola grain yield. Johnston et al. (Reference Johnston, Tanaka, Miller, Brandt, Nielsen, Lafond and Rieveland2002) found that drought stress at anthesis largely influences the canola yield components. Supplemental irrigation at the flowering and grain-filling stage can increase canola grain and oil yields (Dogan et al., Reference Dogan, Copur, Kahraman, Kirnak and Guldur2011). If irrigation water is limited, a single application of water at flowering stage should minimize the risk of yield losses due to water stress (Istanbulluoglu et al., Reference Istanbulluoglu, Arslan, Gocmen, Gezer and Pasa2010). If farmers rely only on conventional water management practices, there is a need for a participatory approach for the adoption of improved farming practices in the common canola growing regions of Pakistan.
Until now, the CROPGRO-Canola model of DSSAT has not been used for exploring the yield-gap of canola for conditions in water limiting regions such as Punjab, Pakistan or elsewhere. The goal of this study was, therefore, to integrate on-station trials and survey data with modelling to identify the limiting factors of current management practice and to quantify the yield-gap of irrigated canola in a water limiting environment. The specific objectives were to evaluate the ability of the CSM-CROPGRO-Canola model to (a) simulate on-station trial results, (b) to simulate farm survey data from four districts in southern Punjab, Pakistan and (c) to identify limitations on production technology and develop strategies for the bridging yield-gap.
Materials and methods
Four field experiments with canola were grown in the research unit of Bahauddin Zakariya University Multan Pakistan to determine the yield-gap between attainable and farmers’ yield. Soil samples were obtained in each trial prior to sowing. Sowing dates, cultivars, N levels and N application treatments were applied in each experiment separately. Grain and biomass yield data were obtained from each experiment. Meanwhile, farmers’ field survey data were also collected. The CSM-CROPGRO-Canola model was used to simulate canola yield and support the yield-gap analysis.
Experimental site
Field experiments were conducted during the winter seasons of 2015–2016 and 2016–2017 at Bahauddin Zakariya University (BZU), Multan, Punjab, Pakistan (30.19° latitude N, 71.46° longitude E and 125 m above the sea level). The soil of the experimental site belongs to ‘Sindhlianwali’ soil series (fine silty, mixed, hyperthermic, sodic haplocambids) (Ahmad et al., Reference Ahmad, Raza, Ali, Shahzad, Atique-ur-Rehman and Sarwar2014). Soil measurements for physical and chemical properties were obtained prior to sowing of canola in both years.
Experimental procedure
The canola experiments (Table S1) were sown following a randomized complete block design. The experimental field was irrigated eight days before seed-bed preparation and then ploughed three times, followed by planking. Canola was hand drilled in rows at a spacing of 45 cm and around 15 cm between plants. Weeds were controlled manually and mechanically. Irrigation water was provided via tube wells. All other management practices were implemented in accordance with the instructions of the local agriculture department and consistent across all trials and years.
Plant sampling and measurements
Growth and development data were obtained weekly following the methodology described by Deligios et al. (Reference Deligios, Farci, Sulas, Hoogenboom and Ledda2013) and Jing et al. (Reference Jing, Shang, Qian, Hoogenboom, Huffman, Liu, Ma, Geng, Jiao, Kovacs and Walters2016). Development stages were recorded when half of the plants from each experimental unit reached a given stage. Plants in a 1 m2 quadrat were collected at 25-day intervals from each plot for growth final biomass and yield and yield components. Samples were oven-dried for 72 h at 65°C for dry weight. A leaf area meter (model LI-3100; LICOR Inc., Nebraska, USA) was used to obtain leaf area. Canola was hand-harvested with the help of a sickle in all experiments during the third week of March in 2016 and 2017 to obtain for final yield and yield components. The samples were then dried for five days and manually threshed.
On-farm survey data
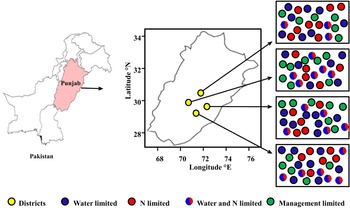
A survey, prepared following the procedure from Fermont et al. (Reference Fermont, van Asten, Tittonell, van Wijk and Giller2009), was used to obtain information from 100 growers across four districts (Multan, Khanewal, Vehari and Bahawalpur) (Fig. 1) in Punjab, Pakistan during the 2016–2017 growing season. We recorded on-farm canola yield along with management practices including the seeding rate, sowing time, sowing method, canola cultivar, N fertilizer strategy and irrigation strategy. The CROPGRO-Canola model was then used to simulate canola grain yield from each of the 100 farmer fields surveyed using traditional farming practices.
The selected locations for the simulation of potential and achievable yield of canola and the major causes for the yield cap, i.e. water limited, nitrogen limited, water and nitrogen limited and other crop management practices, for four districts in southern Punjab, Pakistan. The circles indicate locations of field experiments used for CSM-CROPGRO-Canola model calibration and evaluation.

CSM-CROPGRO-Canola model description
The CSM-CROPGRO-Canola model (Deligios et al., Reference Deligios, Farci, Sulas, Hoogenboom and Ledda2013; Jing et al., Reference Jing, Shang, Qian, Hoogenboom, Huffman, Liu, Ma, Geng, Jiao, Kovacs and Walters2016) of the Decision Support System for Agro-technology Transfer (DSSAT v4.7.5; Hoogenboom et al., Reference Hoogenboom, Porter, Boote, Shelia, Wilkens, Singh, White, Asseng, Lizaso, Moreno, Pavan, Ogoshi, Hunt, Tsuji, Jones and Boote2019a, Reference Hoogenboom, Porter, Shelia, Boote, Singh, White, Hunt, Ogoshi, Lizaso, Koo, Asseng, Singels, Moreno and Jones2019b), was used in this study. The model simulates the growth and development of canola based on carbon, water, N and energy balance principles. The model requires information on crop management practices, soil characteristics, genetic coefficients and weather parameters for the simulation of daily growth and development and final yield prediction.
The model was calibrated with results from a nitrogen rates study conducted during the 2015–2016 growing season for the cultivar Faisal at a rate of 150 kg N/ha. A trial-and-error procedure was used for calibration by comparing the model predicted data with the field experimental observed data (Table S2) and the process generated Genetic coefficients for canola cultivars (Table S3).
The performance of the model was evaluated with the N rate treatments that were not used for calibration and three other field experiments that included irrigation regimes, N strategies and sowing dates as treatments.
Weather conditions
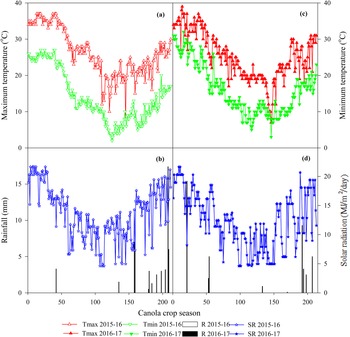
The climate of the region is of continental type with hot and dry summers and cold and dry winters (Ahmad et al., Reference Ahmad, Ashfaq, Rasul, Wajid, Khaliq, Rasul, Saeed, Habib ur Rahman, Hussain, Baig, Naqvi, Bokhari, Ahmad, Naseem, Hoogenboom, Hillel and Rosenzweig2015; Tariq et al., Reference Tariq, Ahmad, Fahad, Abbas, Hussain, Fatima, Nasim, Mubeen, Habib ur Rehman, Khan, Adnan, Wilkerson and Hoogenboom2018). During the 2015–2016 and 2016–2017 growing seasons, weather conditions were characterized by daily maximum and minimum temperatures that ranged from 8 to 37°C and 2 to 27°C, total solar radiation that ranged from 4.6 to 21.6 MJ/m2/d, and total seasonal rainfall that ranged from 45 to 56 mm (Fig. 2).
Daily maximum and minimum temperatures (a, c), solar radiation and precipitation (b, d) for canola growing seasons 2015–2016 (a, b; unfilled symbols) and 2016–17 (c, d; filled symbols) in Multan, Pakistan.

Simulation scenarios for yield-gap analysis
Long-term simulations of canola yield were conducted for conditions for all the 100 farms that were surveyed using historical weather data. The simulation scenarios of included potential yield (Y P, without water and N limitations), achievable yield (Y A, recommended/approved management practices), water-limited yield (Y WL, limited water conditions), N-limited (Y NL, N-limited conditions), water and N-limited yield (Y WNL, both water and N limited conditions) and overall farmer field (Y OFF, observed yield at a farm). Observed canola yield from 1980 to 2016, collected for selected districts from the Department of Agriculture (Extension Wing), Government of the Punjab, Pakistan were also used. Management practices other than water and N were kept the same across the simulations. We defined the yield-gap (YG) as follows:

where i correspond to yield gap under conditions of WL, NL, WNL and OFF; j = Y P, Y A; and k = Y WL, Y NL, Y WNL and Y OFF. The YG was then expressed as per cent loss of the potential and achievable yields, as follows:

The percentages indicating how close Y WL, Y NL, Y WNL and Y OFF are from the simulated Y P and achievable yield Y A (Zu et al., Reference Zu, Mi, Liu, He, Kuang, Fang, Ramp, Li, Wang, Chen, Li, Jin and Yu2018).
Statistical analysis
The results from the field experiments were subjected to analysis of variance techniques using STATISTICS 8.1. Treatment means were subjected to post-hoc comparisons using the least significant difference test (Steel et al., Reference Steel, Torrie and Dickey1997) at alpha = 0.05. The farm survey data were analysed using linear regression and probability of exceeding. The performance of the CSM-CROPGRO-Canola model was evaluated using the root mean square error (RMSE) and normalized RMSE (RMSEn) (Wallach and Goffinet, Reference Wallach and Goffinet1987) and the Wilmott (Willmott, Reference Willmott1981) index of agreement (d-index):


where ‘Si’ and ‘Oi’ are simulated and observed values ‘N’ is the sample size, $\bar{O}$ is the average for the observed values, $S^{\prime}_i = ( {S_i-\bar{O}} )$
 and $O^{\prime}_i = ( {O_i-\bar{O}} )$
 . The lower values of RMSE represent a better fit. The RMSEn provides a comparative change of simulated v. observed data expressed in percentage. Simulations were considered excellent, good, fair and poor when RMSEn is <10%, >10 and <20%, >20% and <30% and >30%, respectively (Loague and Green, Reference Loague and Green1991). According to Willmott (Reference Willmott1981), a value of 1 indicates a perfect match while a value of 0 indicates no agreement.
Results
Model calibration
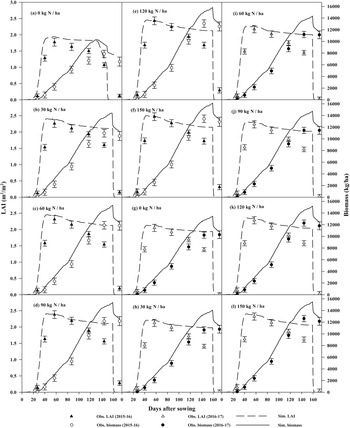
Research trials were conducted under well-management practices for all treatments throughout the 2015–2016 and 2016–2017 growing seasons. The genetic coefficients for canola cultivars were determined by trial and error. The model was calibrated using experimental data from a trial conducted during the 2015–2016 growing season on the canola cultivar Faisal with results from the 150 kg N/ha treatment. Simulated phenology showed a good agreement with the observed results. The difference in the simulated days to anthesis, first pod, first seed and physiological maturity compared to the observed data was 1, 1, 0 and 0, respectively (Table 1). The simulated maximum leaf area index (LAI) was in good agreement with the observed results as well; simulated LAI ranged from 2.23 to 2.49 m2/m2 while observed LAI ranged from 2.18 to 2.47 m2/m2. The RMSE and the d-index of agreement were 0.39 and 0.93, respectively (Figs 3(a)–(l)). The simulated and observed above-ground biomass ranged from 7709 to 13 285 kg/ha and 6538 to 12 919 kg/ha, respectively. The RMSE and d-index of agreement were 1384 kg/ha and 0.99, respectively (Figs 3(a)–(l)). The simulated and observed grain yield also showed good agreement, with RMSE of 113 and d-index of agreement of 0.92 (Table S4).
Simulated LAI (dotted lines) and observed LAI (triangular filled and unfilled symbols) and simulated biomass (continuous lines) and observed biomass (round unfilled and filled symbols) of canola at variable nitrogen application rates (Model calibration and evaluation data) during 2015–2016 (a, b, c, d, e and f) and 2016–2017 (g, h, i, j, k and l) at the study site.

Observed (O) and simulated (S) phenology, root mean square error and d-index of agreement for growth from model calibration and evaluation during the 2015–2016 and 2016–2017 growing seasons

a d to a given stage of development, LAI, leaf area index (m2/m2) and Biomass corresponds to aboveground biomass (kg/ha).
Model evaluation
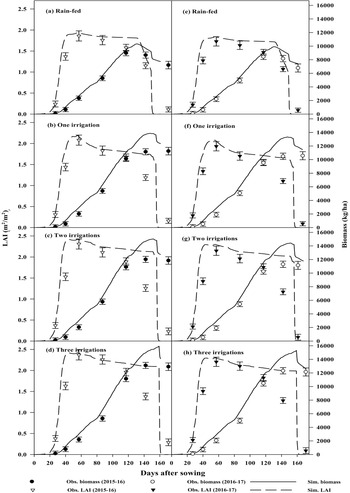
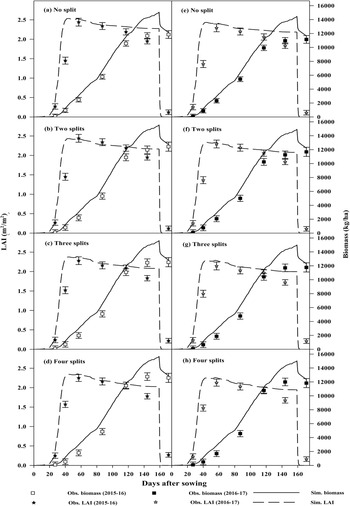
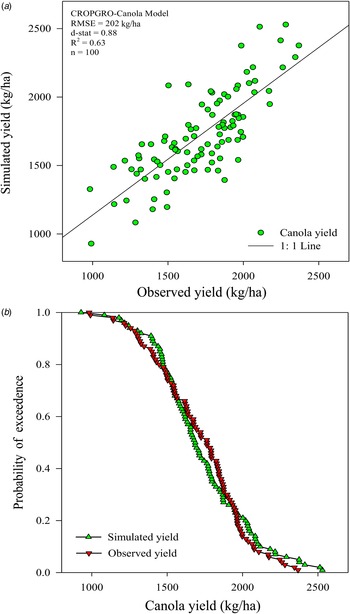
The performance of the canola model was assessed against results from field experiments and farmers’ surveys. The canola model simulations were in agreement with observed results from the field experiments and the survey data. Simulated phenology was in good agreement with observed results for all four trials for both years (Table S5). Across experiments and years, RMSE and d-index of agreement, varied from 0.31 to 0.53 and 0.90 to 0.97 for LAI; from 436 to 1683 and 0.95 to 0.99 for aboveground biomass, and 60 to 194 and 0.92 to 0.98 for grain yield. The simulation results for conditions for the 100-farmer fields showed a RMSE of 202, a d-index of 0.88, and a R 2, of 0.63. Simulated grain yield ranged from 845 to 2804 kg/ha, while, observed grain yield ranged from 783 to 2782 kg/ha across N rates experiment (Fig. 3). For irrigation experiment simulated yield ranged from 783 to 2865 kg/ha, observed yield ranged from 695 to 2648 kg/ha (Fig. 4). Simulated yield for N application strategies ranged from 2281 to 2785 kg/ha, however, observed yield ranged from 2281 to 2736 kg/ha (Fig. 5). For sowing dates experiment simulated yield ranged from 2250 to 2858 kg/ha and observed yield ranges from 2139 to 2791 kg/ha (Fig. 6). The grain yield of canola from the survey varied from slightly under 1000 kg/ha to slightly above 2500 kg/ha. On average, 19 : 50, 2 : 5 and 11 : 50 of farmer yields from the survey data were between 1000 to 1650, 1651 to 1945 and 1946 to 2500 kg/ha. Overall, the model effectively simulated high yields but tended to overestimate the low yields (Fig. 7).
Simulated LAI (dotted lines) and observed LAI (downward triangular unfilled and filled symbols) and simulated biomass (continuous lines) and observed biomass (round filled and unfilled symbols) of canola at variable irrigation regimes (Model evaluation data) during the 2015–2016 (a, b, c and d) and 2016–2017 (e, f, g and h) growing seasons at the study site.

Simulated LAI (dotted lines) and observed LAI (star filled and unfilled symbols) and simulated biomass (continuous lines) and observed biomass (square unfilled and filled symbols) of canola at variable nitrogen application strategy (Model evaluation data) during 2015–2016 (a, b, c and d) and 2016–2017 (e, f, g and h) at the study site.

Simulated LAI (dotted lines) and observed LAI (star unfilled and filled symbols) and simulated biomass (continuous lines) and observed biomass (square filled and unfilled symbols) of canola at variable sowing dates (Model evaluation data) during year 2015–2016 (a, b and c) and 2016–2017 (d, e and f) at the study site.

Relationship between simulated and observed 100 farm canola yield (a) using CSM-CROPGRO-Canola model and probability of exceeding (b) in all four strata of canola crop in southern Punjab, Pakistan during 2016–2017 (Model evaluation at farmer field data).

Yield-gap analysis of canola
After calibration and evaluation, the CSM-CROPGRO-Canola model was used to simulate scenarios for Y P and Y A using the seasonal analysis tool of DSSAT (Thornton and Hoogenboom, Reference Thornton and Hoogenboom1994; Thornton et al., Reference Thornton, Hoogenboom, Wilkens and Bowen1995, Reference Thornton, Hoogenboom, Wilkens, Jones, Tsuji, Uehara and Balas1998). Average simulated grain yield for Y P was 3056 kg/ha and for Y A was 2310 kg/ha that which already accounted for a yield-gap of 746 kg/ha, equivalent to over 6 : 25 proportion (Table 2). The mean observed canola grain yield grown under various scenarios like nitrogen limited was 1530 kg/ha, water limited 1658 kg/ha, nitrogen and water limited 1169 kg/ha and on farmer field was 867 kg/ha. The average yield-gap between potential yield with nitrogen limited was 1525 (1 : 2), water limited 1398 (23 : 50), nitrogen and water limited 1887 (31 : 50) and on farmer field 2189 (18 : 25). Similarly, the average yield-gap between achieved yield and nitrogen limited 780 (17 : 50), water limited 652 (7 : 25), nitrogen and water limited 1141 (7 : 50) and on farmer field 1443 (31 : 50) (Fig. 8).
Farmer-Scientist determined yield-gap at farmer fields in southern Punjab, Pakistan.

The minimum, maximum and mean values of long-term (1980–2016) average of simulated potential (Y P), achievable (Y A), observed N-limited (Y NL), water-limited (Y WL), N and water limited (Y NWL) and overall farmers field (Y OFF) yield

Discussion
Both the on-station research and survey results show the need to improve crop management practices to reduce the current yield-gap in canola production in Punjab, Pakistan. However, the yield-gap analysis encompasses complexities that require the use of crop modelling to complement the results obtained from on-station and on-station research. We, therefore, used the CROPGRO-Canola model of DSSAT to tackle the problems facing local farmers in making decisions specifically linked to irrigation, fertilizer, sowing date and cultivars with a superior genetic potential. This study showed that the main causes for a low yield are associated with inefficiencies in crop management practices. Such a reality has a cascading effect resulting in a very large yield gap. For example, the use of low-quality seed with little attention to other management practices such as sowing dates, fertilization strategy and irrigation management is a recipe for failure. In other words, failing to adopt improved agronomic practices was the principal reasons for marginally lower canola grain yield than the research trial grain yields. In fact, sowing high-yielding canola cultivars under improved agronomic practices could translate into an attainable yield of ≈2500 kg/ha.
The results showed that canola yield from surveyed farmers’ fields were lower than the maximum achievable yield. This poor performance evidenced, once more, that less than optimum management practices are the main cause for the low actual yield. Often, farmers do not follow the recommendations of best management practices obtained from research because of the lack of proper extension programmes to reach a mostly non-educated population who have an urgent need for basic information. For example, farmers tend to sow canola in early November to mid-December, which is too late compared to the recommended optimum sowing date that ranges from 20 September to 31 October in Punjab, Pakistan. The consequence of this is a low canola germination resulting ultimately in a low grain yield. Similarly, most farmers apply a sub-optimal amount of fertilizer-N and practice a single application at sowing, resulting in N loss through leaching, denitrification, runoff and volatilization (Faramarzi et al., Reference Faramarzi, Barzegar, Zolleh, Mohammadi, Ardakani and Normohammadi2009a, Reference Faramarzi, Abbaspour, Schulin and Yang2009b; Ahmad et al., Reference Ahmad, Ali, Ismail, Shahzad, Nadeem, Anjum, Zia-Ul-Haq, Firdous and Khan2012, Reference Ahmad, Ali, Farooq, Khan, Atique-ur-Rehman, Sarwar, Shahzad, Dogan, Hussain, Sultan, Waheed, Zia-ul-Haq, Hussain and Khan2016a, Reference Ahmad, Nadeem, Abbas, Fatima, Khan, Ahmed, Ahmad, Rasul and Khan2016b; Fatima et al., Reference Fatima, Abbas, Khan, Hussain, Ali, Abbas, Younis, Naz, Ismail, Shahzad, Nadeem, Farooq, Khan, Javed, Khan, Ahmed, Khan and Ahmad2018). In a region where water is one of the most important inputs that affects crops growth, proper irrigation management is strategically critical. The farmers inability to properly supply water at critical periods of canola growth results in an avoidable reduction in yield. This study showed that proper irrigation alone can increase the expected grain yield for each canola variety (Table S3). Farmers’ management practices in the region shows that their maximum expected yield corresponds to 2/3 of the minimum and less than half of the maximum achievable yield (Table 1). As discussed earlier, corrective measures exist, but there seems to be a disconnect between the research findings, extension to small-holder farmers and the adoption of appropriate management practices.
In this study we used a combination of field experiments, a survey of on-farm practices and yield and modelling to advance our understanding on factors driving low yield of canola in southern Punjab, Pakistan. The canola model successfully simulated growth and yield of canola for both farmer and best management practices scenarios. The yield-gap analysis revealed inefficiencies related to basic management practices, including poor quality seed, sowing dates, fertilization strategy and irrigation water management as the main causes for a low canola yield. There was a difference between simulated and observed results, but in general the model performed satisfactorily although spatial variability is well-known to be associated with differences in management practices (van Ittersum et al., Reference van Ittersum, Cassman, Grassini, Wolf, Tittonell and Hochman2013; Yanga et al., Reference Yanga, Yangb, Liub and Hoogenboom2014; Poulton et al., Reference Poulton, Vesna, Dalgliesh and Seng2015; Ahmad et al., Reference Ahmad, Abbas, Abbas, Fatima, Atique-ur-Rehman, Naz, Younis, Khan, Nasim, Habib ur Rehman, Ahmad, Rasul, Khan and Hasanuzzaman2017a, Reference Ahmad, Abbas, Fatima, Khan, Anjum, Ahmed, Khan, Porter and Hoogenboom2017b). In general, the simulated yield for various canola management practices correlated well with the average observed farmers’ yield but for some instances the observed yield was not adequately simulated. This might be due to the high variation on farmer practices like sowing time. Overall, the results from this study contributed to the revision of potential and achievable yield of canola. The simulated yield was found to be within the results from research on best management practices.
Conclusions
The CSM-CROPGRO-Canola model satisfactorily simulated growth, development and yield of canola under scenarios of potential, achievable, N-, water-, N –and -water limited and overall farmer field conditions in southern Punjab, Pakistan. A large gap between simulated potential, achievable and on-station yields for canola showed a high potential to increase canola productivity in the study region. The yield-gap resulting from drought stress was less compared to N stress, probably due to canola being grown in a region with limited water and, thus, the need for irrigation. Finally, the canola yield-gap can be overcome through management practices including the selection of the best cultivar and sowing date and an appropriate N fertilizer strategy. This research showed that applied research can play an important role in bridging the gap in canola yield in southern Punjab, Pakistan. This, however, will need an aggressive outreach programme including government support policies aiming at adapting extension strategies to reach canola producers.
Supplementary material
The supplementary material for this article can be found at https://doi.org/10.1017/S0021859623000187.
Author contributions
SA, SH, MA and MAG conceived and designed the study. GA and ZF conducted data gathering. MAR performed statistical analyses. AG and CJW read the first and second drafts. GH overall supervised the study. All the authors read the manuscript before submission.
Financial support
This research work was supported by Higher Education Commission, Islamabad, Pakistan through research grant (NRPU-17084) and Bahauddin Zakariya University, Multan, Pakistan.
Conflict of interest
The authors declare that they have no conflict of interest.
Ethical standards
Not applicable.