I. INTRODUCTION
The need for cost effective and sustainable technologies for storing intermittent solar power spurs a growing interest in artificial photosynthesis and solar fuels. Reference Lewis and Nocera1,Reference Barber and Tran2 Photoelectrochemical (PEC) cells combined in tandem with photovoltaic cells offer a viable solution to this need by splitting water, using solar power, to hydrogen, and oxygen. Reference Gratzel3,Reference Walter, Warren, McKone, Boettcher, Mi, Santori and Lewis4 The hydrogen can be stored and converted to electricity on-demand (e.g., by fuel cells), or be used as renewable feedstock for sustainable synthesis of liquid fuels (e.g., by hydrogenation of CO2). Reference Olah5,Reference Wang, Wang, Ma and Gong6 One of the greatest challenges in this route is the development of stable, efficient, and inexpensive photoanodes for water photo-oxidation. Hematite (α-Fe2O3) is a leading photoanode candidate Reference Sivula, Le Formal and Grätzel7–Reference Young, Klahr, Zandi and Hamann11 due to its abundance, stability in alkaline aqueous solutions, high catalytic activity for water oxidation Reference Smith, Prévot, Fagan, Zhang, Sedach, Siu, Trudel and Berlinguette12 and band gap energy of 2.1 eV which is nearly optimal for tandem cells in combination with lower band gap semiconductors such as Si. Reference Prévot and Sivula13 Unfortunately, hematite also displays deleterious charge transport properties Reference Morin14 that give rise to photocurrent and photovoltage losses due to charge carrier recombination, which complicates the development of high efficiency photoanodes. Various strategies have been scrutinized to reduce these losses, aiming to achieve large photocurrents (the theoretical limit for hematite is 12.6 mA/cm2 at AM1.5G insolation) Reference Sivula, Le Formal and Grätzel7 at low anodic bias (the ultimate limit is the flat-band potential, which is typically 0.4–0.6 VRHE, i.e., volts against the reversible hydrogen electrode, for heavily doped hematite photoanodes in alkaline aqueous solutions). Reference Sivula, Le Formal and Grätzel7 Among the most successful strategies, resonant light trapping in ultrathin (∼20–30 nm) compact (i.e., nonporous) films Reference Dotan, Kfir, Sharlin, Blank, Gross, Dumchin, Ankonina and Rothschild15 or nanostructuring of thicker (∼400–500 nm) mesoporous layers Reference Warren, Voïtchovsky, Dotan, Leroy, Cornuz, Stellacci, Hébert, Rothschild and Grätzel16,Reference Kim, Magesh, Youn, Jang, Kubota, Domen and Lee17 were found to enhance the charge collection efficiency by confining the absorbed light close to the surface, thereby reducing bulk recombination. Underlayers were found to enhance charge separation and suppress recombination at the interface with the current collector. Reference Hisatomi, Dotan, Stefik, Sivula, Rothschild, Grätzel and Mathews18 Surface treatments and overlayers were found to reduce surface recombination and enhance the photovoltage of hematite photoanodes. Reference Barroso, Cowan, Pendlebury, Grätzel, Klug and Durrant19–Reference Tilley, Cornuz, Sivula and Grätzel21 These strategies have yielded improvement in the performance of hematite photoanodes, but the progress has been slow and consequently the performance still remains far below the theoretical limit and is currently too low for technological implementation in PEC cells for solar water splitting.
To speed up the development of high efficiency hematite photoanodes, systematic investigations of the effect of material properties such as dopants and microstructure on PEC properties that determine the photoanode performance are crucial. This is difficult to pursue with mesoporous layers produced by chemical routes such as hydrothermal synthesis, spray pyrolysis, or aerosol assisted chemical vapor deposition for which the microstructure is very sensitive to even small changes in precursors and deposition conditions. Reference Warren, Voïtchovsky, Dotan, Leroy, Cornuz, Stellacci, Hébert, Rothschild and Grätzel16 This makes it difficult to decouple and distinguish between chemical composition and microstructural effects. Thus, thin films produced by physical vapor deposition routes such as sputtering or pulsed laser deposition (PLD) are better suited for such systematic investigations because these deposition methods can be readily tuned to produce films with reproducible microstructure that can be doped with different dopants without changing the microstructure. This work presents a route for reproducible deposition of hematite thin films on transparent conducting substrates by means of PLD, highlighting the role of rigorous substrate cleaning prior to the deposition to achieve reproducible results.
II. EXPERIMENTAL
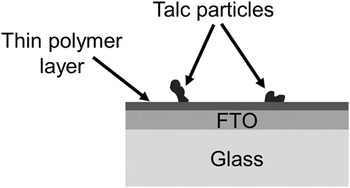
Transparent conducting oxide coated glass substrates comprising fluorinated tin oxide (F-doped SnO2, FTO) coated soda-lime glass substrates (TEC15; Pilkington, Tokyo, Japan) were used throughout this work. The substrates arrived with a thin polymer coating that protects the FTO layer from scratches and contamination. In addition, they were packed with talc to reduce friction scratches. Figure 1 shows a schematic cross-section illustration of the TEC15 substrates, as received.
Schematic cross-section illustration of TEC15 substrates, as received.

The protective polymer coating and talc particles must be removed prior to deposition of the hematite film. The standard cleaning process involves rinsing with isopropanol [(CH3)2CHOH, analytical grade] followed by rinsing with deionized (DI) water and subsequently drying in N2 (99.995%) gas flow. As shown in the results and discussion section, the standard cleaning process was found to leave massive carbonaceous residues on the FTO surface and it yielded irreproducible PEC results. To rectify this flaw we examined a rigorous cleaning process described in Scheme 1. This rigorous cleaning process yielded clean FTO surface and reproducible PEC results, as described in the Sec. III.
Rigorous cleaning process. All the cleaning steps were carried out in an ultrasonicator bath using analytical grade solvents.

After the cleaning process the surface morphology and chemical composition of the FTO layer were examined by high resolution scanning electron microscopy (HRSEM, Zeiss Ultra Plus; Carl Zeiss AG, Oberkochen, Germany) and energy dispersive x-ray spectroscopy (EDS; Oxford Instruments, Oxfordshire, UK), respectively. The surface roughness was examined by atomic force microscopy (AFM, Park Systems XE-70; Park Systems Corp., Suwon, Korea). Thin (50 nm) films of Ti-doped hematite (α-Fe2O3) were deposited by PLD from a 1 cation% Ti-doped Fe2O3 target. The deposition was carried out using a PLD system (2” PLD Workstation; Surface Systems & Technology, Hueckelhoven, Germany) equipped with a KrF (λ = 248 nm) excimer laser (COMPexPro 102; Coherent Inc., Santa Clara, California). The film was deposited using 9000 laser pulses with a fluence of 1 J/cm2 and repetition rate of 3 Hz. The distance between the substrate and the target was 70 mm, and the heater set-point temperature was 500 °C which corresponds to a substrate temperature of approximately 450 °C. The deposition was carried out in O2 gas atmosphere at a constant pressure of 25 mTorr. The target was produced by solid state reaction route using high purity powders of Fe2O3 (99.99%, Alfa Aesar) and TiO2 (99.995%, Alfa Aesar). The powders were mixed in appropriate amounts to obtain a Ti concentration of 1 cation% (Fe1.98Ti0.02O3). The mixture was ball-milled for 24 h using YTZ milling balls (Tosoh, Tokyo, Japan), and subsequently pressed in a stainless steel mold and sintered in air at 1200 °C for 12 h, resulting in a 1” disk-shaped pellet with relative density of 88% and Ti concentration of 1.32 ± 0.22 cation% (measured by EDS) from which the hematite films were deposited. The surface morphology and roughness of the films were examined by HRSEM and AFM, similarly to the substrates. X-ray diffraction (XRD) was used for phase identification. X-ray diffractograms were acquired using an x-ray diffractometer (SmatLab, Tokyo, Japan) in parallel beam configuration with Cu Kα radiation in the range of 20–75° at a scan rate of 0.01 °/s. The film thickness was measured by cross-section transmission electron microscopy (TEM) using a monochromated and aberration (image) corrected TEM (Titan 80-300 kV S/TEM; FEI, Hillsboro, Oregon). Cross-section TEM specimens were prepared by the lift out technique Reference Sivel, Van den Brand, Wang, Mohdadi, Tichelaar, Alkemade and Zandbergen22,Reference Reyntjens and Puers23 using a dual-beam focused ion beam (FIB, Strata 400S; FEI, Hillsboro, Oregon). High angle annular dark field (HAADF) micrographs and EDS composition maps and line-scans were acquired in the scanning transmission electron microscopy (STEM) mode to examine the chemical composition across the layered structure.
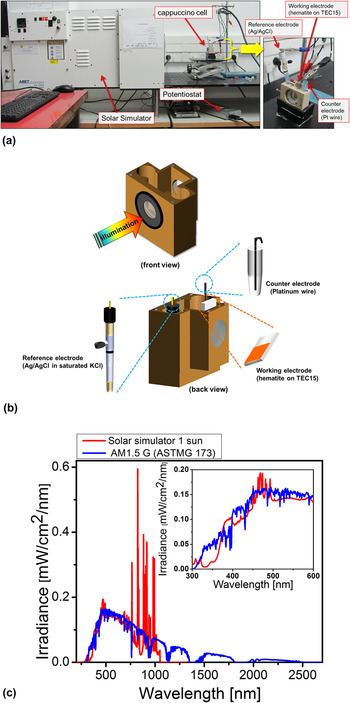
The optical properties of the photoanodes (hematite films on TEC15 substrates) were examined by spectrophotometry measurements in reflection and transmission modes using a spectrophotometer (Cary 5000; Agilent Technologies, Santa Clara, California) equipped with an integrating sphere. PEC measurements were carried out in a dedicated PEC test system shown in Fig. 2(a). The hematite photoanodes were immersed in 1M NaOH in DI water solution (pH = 13.6 ± 0.1, measured by a pH 700 pH-meter from Eutech Instruments, Singapore) inside a PEC cell known as the “cappuccino cell” designed by École Polytechnique Fédérale de Lausanne (EPFL), Switzerland. Reference Krol, van de Krol and Grätzel24 Schematic illustrations of the “cappuccino cell” in front and back views are shown in Fig. 2(b). An area of 0.28 cm2 within the hematite photoanode, defined by a through hole in the wall against which the photoanode was pressed inside the cappuccino cell (with an O ring sealing), was exposed to the electrolyte and to the incident illumination. Current versus potential linear sweep voltammograms were measured in dark, light, and chopped light (with 3 s intervals) conditions using a potentiostat (CompacStat; Ivium Technologies B. V., Eindhoven, The Netherlands) set in the three electrode mode configuration and a solar simulator (Sun 3000 class AAA solar simulator; ABET Technologies, Milford, Connecticut). The hematite photoanode served as the working electrode, a platinum wire served as the counter electrode, and a saturated Ag/AgCl electrode served as the reference electrode. The potential of the working electrodes was ramped from 0 to 0.6 V versus silver chloride electrode (saturated in NaCl solution) (VAg/AgCl) at a rate of 10 mV/s. The results are presented in terms of the potential against the Reversible Hydrogen Electrode (RHE) scale (VRHE) instead of the Ag/AgCl scale (VAg/AgCl), and the transformation from the Ag/AgCl scale to the RHE scale was done according to the formula VRHE = VAg/AgCl + 0.192 (V) + 0.059 (V) · pH = VAg/AgCl + 0.994 (V) at pH 13.6. The intensity of the solar simulator was set to 1 Sun (100 mW/cm2) at the position of the hematite photoanode using a calibrated dye solar cell (AK-300 Dye-Sensitized Reference Cell, Singapore). Figure 2(c) compares the spectrum of the solar simulator, measured by a spectrophotometer at the 1 Sun position, with the standard AM1.5G spectrum (ASTM G173-03 Reference Spectra 25 ).
(a) Photographs of the PEC test system and the cappuccino cell. (b) Schematic illustration of the cappuccino cell. (c) Irradiance spectrum of the solar simulator in comparison with the AM1.5G standard insolation.

III. RESULTS AND DISCUSSION
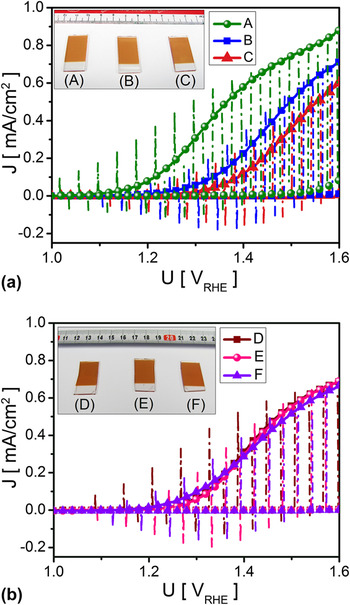
Figure 3 shows dark (dashed line curves), light (full line curves), and chopped-light (dash-dotted line curves) voltammograms of six hematite photoanodes deposited on TEC15 substrates that were cleaned by the standard cleaning process [samples A, B, and C, Fig. 3(a)] and by the rigorous cleaning process [samples D, E, and F, Fig. 3(b)]. The first thing to note is that in all cases the light and chopped-light voltammograms overlap each other (except for the light turn-on and turn-off spikes). This indicates that the measurements were carried out at a proper ramp rate to probe the steady-state current. Repeated voltammetry measurements were found to overlap each other, indicating that the results are reversible with no deleterious decomposition of the photoanode. Another indication of the photoanode stability is the fact that no visual changes were observed following the PEC measurements. This can be seen by the homogenous color of the photoanodes in the inset of Figs. 3(a) and 3(b) that shows photographs taken after repeated PEC measurements. The photoanode color is very sensitive to decomposition and if there were any decomposition effects this would have shown up as a region with different contrast at the center of the photoanode which was exposed to the electrolyte during the PEC measurements.
Dark (dashed line curves), light (full line curves) and chopped-light (dash-dotted line curves) voltammograms measured with hematite photoanodes on FTO substrates which were cleaned by the standard (a) and rigorous (b) cleaning processes. Besides the substrate cleaning process the fabrication was exactly the same for all six photoanodes. The inset in Figs. 3(a) and 3(b) shows photographs of the respective photoanodes taken after the PEC measurements.

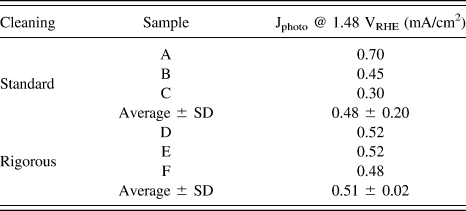
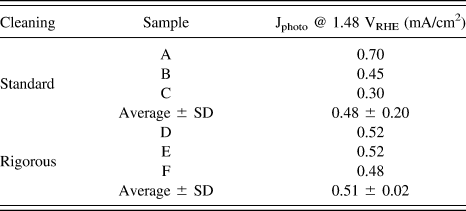
The second thing to note is the striking difference between the wide spread in the voltammograms in Fig. 3(a) compared to the narrow spread in Fig. 3(b). The spread in the results is quantified in Table I by comparing the photocurrent (i.e., the light current minus the dark current) measured at the thermoneutral potential of the water oxidation reaction (1.48 VRHE) with photoanodes prepared by the standard and rigorous substrate cleaning processes. The former ones had a standard deviation of 33% of the average value, whereas for the latter ones the standard deviation was only 4% of the average value. These results demonstrate the importance of rigorous substrate cleaning to obtain reproducible results, which is a prerequisite for studying the influence of control parameters such as dopants on PEC properties and performance. Clearly, the standard cleaning process is insufficient for systematic investigations of such effects, whereas the rigorous cleaning process yields reproducible results that can serve as solid basis for comparison between different photoanodes.
Comparison of the photocurrent measured at the thermoneutral potential (1.48 VRHE) with photoanodes prepared by the standard and rigorous substrate cleaning processes.
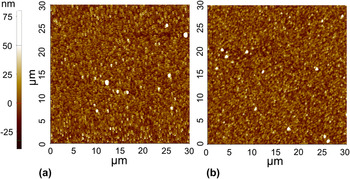
To identify the root cause underlying the striking difference between the spread of the results obtained with photoanodes prepared by the standard and rigorous substrate cleaning processes, the surface roughness and topography of TEC15 substrates that had been cleaned by the two processes were examined following the respective cleaning processes (and before deposition of the hematite films). Figure 4 shows typical AFM images of TEC15 substrates taken after cleaning by the standard (a) and rigorous (b) cleaning processes. The surface topography looks very similar in both cases, displaying the same average surface roughness (R a = 8 nm). This indicates that the rigorous cleaning process does not etch the surface, despite the soak in KOH solution on the last step before the final rinse with DI water (see Scheme 1).
AFM images of TEC15 substrates cleaned by the standard (a) and rigorous (b) cleaning processes.

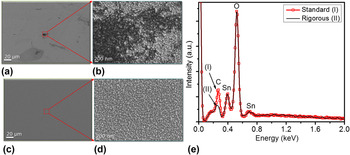
The surface morphology and chemical composition of TEC15 specimens that had been cleaned by the standard and rigorous cleaning processes were examined by HRSEM and EDS, respectively. Figure 5 shows typical HRSEM images of TEC15 substrates taken after cleaning by the standard (a and b) and rigorous processes (c and d), and EDS spectra (e) of the two specimens (curves I-red and II-black, respectively). The substrate that was cleaned by the standard process shows dark gray patches [Fig. 5(b)] that are typical to carbonaceous contamination. Indeed, EDS measurements taken from this specimen display high carbon content [curve I in Fig. 5(e)], well above the rigorously cleaned specimen (curve II). The HRSEM images of the rigorously cleaned specimen [Figs. 5(c) and 5(d)] show uniform contrast without any gray patches as observed in the standard clean specimen [Fig. 5(b)]. Thus, we conclude that the rigorous cleaning process removes the polymer coating and talc very effectively, leaving a clean surface with no significant carbonaceous residues. In contrast, the standard cleaning process does not suffice, leaving carbonaceous contamination at the surface that can be easily observed by HRSEM [Fig. 5(b)]. This carbonaceous contamination could lead to poor adhesion between the hematite film and the FTO-coated glass substrate. It could also act as a source for carbon diffusion into the hematite film during the high-temperature deposition process. We suspect that these causes underlie the large spread in the PEC results obtained with the standard cleaning process [Fig. 3(a)] compared to the narrow spread of the rigorously cleaned specimens [Fig. 3(b)]. Therefore, we adopted the rigorous cleaning process (Scheme 1) and in the remaining of the article we shall discuss the characteristics of photoanodes that were cleaned by the rigorous process.
HRSEM image of TEC15 substrates that were cleaned by the standard (a, b) or rigorous (c, d) cleaning processes, and EDS spectra (e) of the two substrates (curves I and II correspond to the standard and rigorous cleaning processes, respectively).

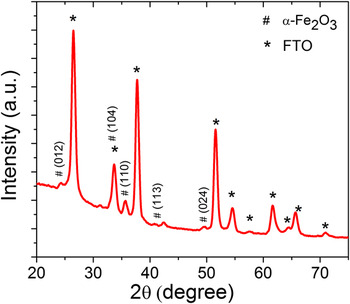
Figure 6 presents a typical XRD diffractogram of a photoanode, the substrate of which was cleaned rigorously before the hematite deposition. The peaks are labeled with respect to the Bragg reflections from different planes in the Fe2O3 hematite phase (α-Fe2O3, JCPDS 01-080-5413) and the SnO2 rutile phases (JCPDS 01-079-6887). No other peaks are observed, confirming the existence of a single-phase hematite film on the FTO-coated glass substrate.
Typical x-ray diffractogram of a thin film hematite photoanode.

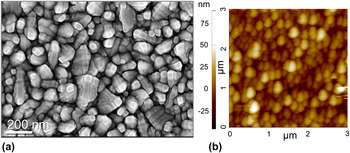
Figure 7 shows typical HRSEM (a) and AFM (b) images of the same thin film hematite photoanode as in Fig. 6. The surface morphology of the hematite film is a bit more ragged than that of the TEC15 substrate [see Fig. 5(d)] and the average roughness is a bit higher (R a = 9 nm), but other than that the morphology is homogenous across the entire field of view, indicating quite uniform conformal coverage of the hematite film of the rigorously cleaned substrate.
Typical HRSEM (a) and AFM (b) images of a thin film hematite photoanode.

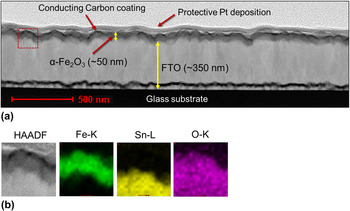
Figure 8 shows a typical cross-section STEM-HAADF micrograph (a) of the same photoanode, and EDS elemental maps of the Fe K-edge, Sn L-edge and O K-edge (b) taken from the region of interest marked by the red box in Fig. 8(a). The hematite film coats the FTO layer conformally, with a film thickness of 48 ± 5 nm. The EDS elemental maps [Fig. 8(b)] confirm the uniform coverage of the hematite film on the FTO-coated glass substrate, and no intermixing of the hematite and FTO layers is observed.
Typical cross-section STEM-HAADF micrograph image of the hematite film on the FTO-coated glass substrate (a), and a magnified STEM-HAADF micrograph with EDS elemental maps of the Fe K-edge, Sn L-edge, and O K-edge (b) taken from the region of interest marked by the red box in Fig. 8(a).

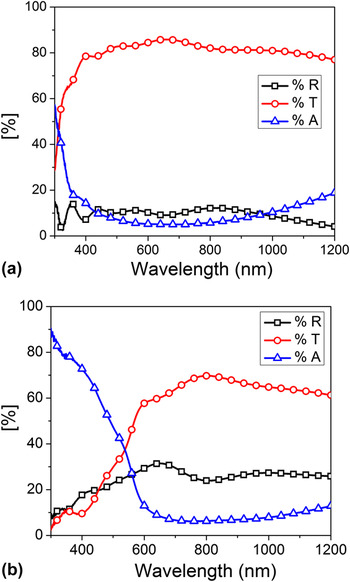
Figure 9 presents typical absorptance (A), transmittance (T) and reflectance (R) spectra measured with a pristine TEC15 substrate (a) and with a thin film (50 nm) hematite coated TEC15 substrate (b). The absorptance spectra, A(λ) wherein λ is the wave length, were calculated using the formula A(λ) = 1 − T(λ) − R(λ) and the measured transmittance (T) and reflectance (R) spectra of the respective specimens. The TEC15 substrate absorbs wavelengths smaller than ∼400 nm [Fig. 9(a)] due to band-to-band transition in the FTO. The thin film hematite photoanode displays much stronger absorption [Fig. 9(b)] than the pristine TEC15 substrate [Fig. 9(a)] up to 600 nm, the absorption edge of hematite.
Typical absorptance (A), transmittance (T), and reflectance (R) spectra of a pristine TEC15 substrate (a) and a thin film hematite photoanode (b).

IV. SUMMARY AND CONCLUSIONS
FTO-coated glass substrates are often coated with polymer layer to protect the FTO surface from scratches and contamination. This layer must be removed prior to the photoanode deposition to enable good adhesion. Standard cleaning by rinsing in isopropanol followed by rinsing in DI water and subsequently drying in N2 gas flow removes most of the polymer coating but leaves carbonaceous residues at the surface, yielding irreproducible PEC characteristics. To overcome this problem a rigorous cleaning process was developed. The process involves sonicating in soap solution followed by DI water, acetone, ethanol, alkaline solution, and finally DI water. It gives rise to a clean surface with no carbonaceous residues. Thin (50 nm) film hematite photoanodes deposited by PLD on substrates that were cleaned by the rigorous process display conformal and uniform coating with no voids or pinholes, yielding reproducibly PEC characteristics with very little spread in properties. This is a crucial prerequisite for systematic investigation of hematite photoanodes.
ACKNOWLEDGMENT
The research leading to these results has received funding from the European Research Council under the European Union's Seventh Framework Program (FP/2007–2013)/ERC Grant Agreement n. 617516, and from the Israeli Ministry of Science, Technology and Space (Grant No. 3–9699). The results were obtained using central facilities at the Technion's Hydrogen Technologies Research Laboratory (HTRL), supported by the Adelis Foundation and by the Solar Fuels I-CORE program of the Planning and Budgeting Committee and the Israel Science Foundation (Grant No. 152/11), the Photovoltaic Laboratory, supported by the Nancy & Stephen Grand Technion Energy Program (GTEP) and by the Russell Berrie Nanotechnology Institute (RBNI), and the Micro and Nano Fabrication Unit (MNFU).