Introduction
The dye-sensitized solar cell (DSSC) has become one of the most promising solar cells in the renewable energy research and development field for its potential low fabrication cost and higher photoelectric conversion efficiency [Reference O’Regan and Graetzel1, Reference Fan, Yu and Ho2, Reference Li, Wu, Rao, Chen, Feng, Kuang and Su3, Reference Liu, Yue and Zheng4, Reference Cui, Ma, Wu and Wu5, Reference Liu, Mai, Chen, Ren, Liu, Li, Gao, Wang, Zhang, He and Guo6, Reference Kim, Lee, Shin, Jeong, Son, Lee, Park, Lee, Son and Ko7, Reference Wu, Feng, Chen, Kuang and Su8]. As one of the most important parts of the DSSC, the photoanodes have attracted special concerns. For many years, TiO2 has been widely used as an ideal photoelectrode material because of its large surface area for loading more dye molecules, which not only plays a crucial role in the charge transport and the amount of adsorbed dye molecules but also significantly affects the overall energy conversion [Reference Chen, Zhang, Liu and Li9, Reference Ding, Xia, Chen, Hu, Mo, Huang and Dai10]. To further improve the photovoltaic conversion efficiency of DSSC, some attempts have been adopted to modify TiO2, such as doping of metal or nonmetal elements, surface modifications, and combination with narrow band gap semiconductors [Reference Wang, Wang, Li, Wu, Zhang, Hong and Sun11, Reference Yang, Cai, Lv, Wu, Wang, Xu, Li, Li and Xu12, Reference Liu, Hou and Qua13, Reference Qi, Wang, Wang, Li, Ouyang and Chen14, Reference Wang, Liu, Qu, Chen, Tad and Shao15].
C3N4 has been investigated extensively in many energy and environment-related fields because of its superior catalytic, optical, and electronic properties [Reference Zhang, Ji, Wu, Wang, Liu, Qu and Li16, Reference Lü, Shen, Wu, Wang and Xie17, Reference Liu, Guo, Chen, Zhang and Fang18, Reference Liang, Li, Bai, Huang, Kang and Yang19]. More importantly, C3N4 not only can absorb a large part of visible light directly but also has more negative conduction band position than that of TiO2, which may effectively prevent the migration of electrons from TiO2 to the electrolyte [Reference Li, Wang, Pan, Jiang, Tian, Zhou and Fu20, Reference Casalucia, Gemmib, Pellegrinic, Carloa and Bonaccorso21]. So far, C3N4 has been applied in LEDs, photocatalysts, solar cells, and so on [Reference Li, Qu, Pan and Wang22, Reference Xu, Shalom, Piersimoni, Antonietti, Neher and Brenner23, Reference Xu, Brenner, Chen, Neher, Antonietti and Shalom24, Reference Xu, Brenner, Chabanne, Neher, Antonietti and Shalom25].
Recently, luminescent nanocrystals are widely applied in many fields due to their interesting luminescent properties [Reference Wang and Li26, Reference Xia and Meijerink27, Reference Xu, Han, Cheng, Yang, Bi, Yang, Niu, He, Gai and Lin28, Reference Bai, Wang, Xu and Wang29, Reference Hao, Shang, Li, Ågrenb, Yang and Chen30]. To the best of our knowledge, by using luminescence of rare earth ions, the ultraviolet or infrared light in the sunlight can be transferred into visible light and then is reabsorbed by the sensitized dye [Reference Suyver, Aebischer, Biner, Gerner, Grimm, Heer, Krämer, Reinhard and Güdel31, Reference Cui, Li, Liu, Chen, Xu, Ma, Fang, Zhu, Wu, Zhao, Wang and Huang32, Reference Ding, Li, Zhang, Yu and Hua33]. Therefore, the conversion efficiency of DSSCs can be improved effectively. Y2O3 has many advantages, such as good chemical and photochemical stability, high melting point, large energy band gap of 5.8 eV, and can be easily doped with rare earth ions [Reference Yu, Su, Wang and Li34, Reference Lin, Yeh, Chen, Wu, Vittal and Ho35]. In particular, Y2O3:Eu3+ material offers many advantages over other phosphor materials as a candidate for red-emitting applications due to its characteristic energy levels. For example, Chen et al. have reported that the photoelectrical performance of DSSCs can be improved by doping Y2O3:Tb3+ nanorods due to the enhancement of the Fermi level of TiO2 film [Reference Chen, Lin and Wu36]. However, it is well known that the incorporation of Y2O3 into photoanodes can lead to poor charge transfer due to the poor electrical conductivity of Y2O3. More importantly, large-size Y2O3 nanorods can result in poor quality of the anode film, which limits the significant enhancement of photoelectric conversion efficiency of DSSCs.
In this paper, we have successfully synthesized small Y2O3:Eu3+ particles and Y2O3:Eu3+/C3N4 nanocomposites, which have the ability to improve the efficiencies of the solar cells. The efficiencies of TiO2-Y2O3:Eu3+–C3N4 composite cells were not only higher than those of pure TiO2 cells but also higher than those of TiO2-Y2O3:Eu3+ or TiO2-C3N4 composite cells, which can be attributed to the synergetic effect of small Y2O3:Eu3+ particles and C3N4.
Results and discussion
Crystal structure and morphology
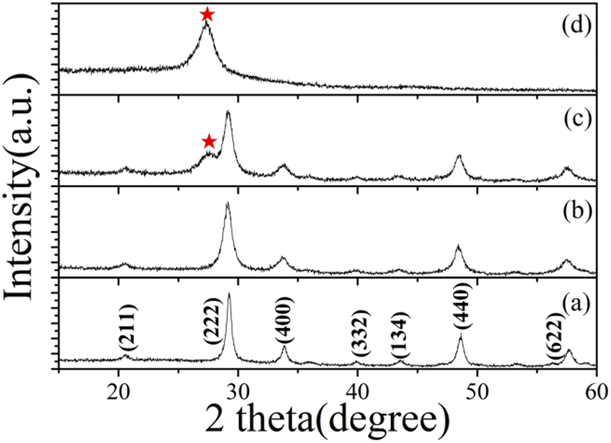
Figures 1(a) and 1(b) shows the X-ray diffraction (XRD) patterns of small Y2O3:Eu3+ nanoparticles (abbreviated as YONP) and Y2O3:Eu3+ nanotubes (abbreviated as YONT), which are assigned to (211), (222), (400), (440), and (622) planes of the pure cubic phase Y2O3 (JCPDS 43-1036). Obviously, the peaks of the YONP are much broader than those of YONT, indicating that the crystallite size of YONP is smaller than that of YONT. The XRD pattern of YONP/C3N4 nanocomposites indicates that YONP and C3N4 coexist in YONP/C3N4, as shown in Fig. 1(c). For comparison, the XRD pattern of hexagonal phase C3N4 is also shown in Fig. 1. The pure phase C3N4 had one distinct peak at 27.3°, which was indexed as (002) diffraction plane (JCPDS87-1526) of C3N4. The crystal phase YONP did not change after compositing with C3N4. The XRD patterns of YONT/C3N4 nanocomposites with different mass ratios are shown in Fig. S1.
XRD patterns of (a) YONT, (b) YONP, and (c) YONP/C3N4 (1:2) nanocomposites and (d) C3N4.

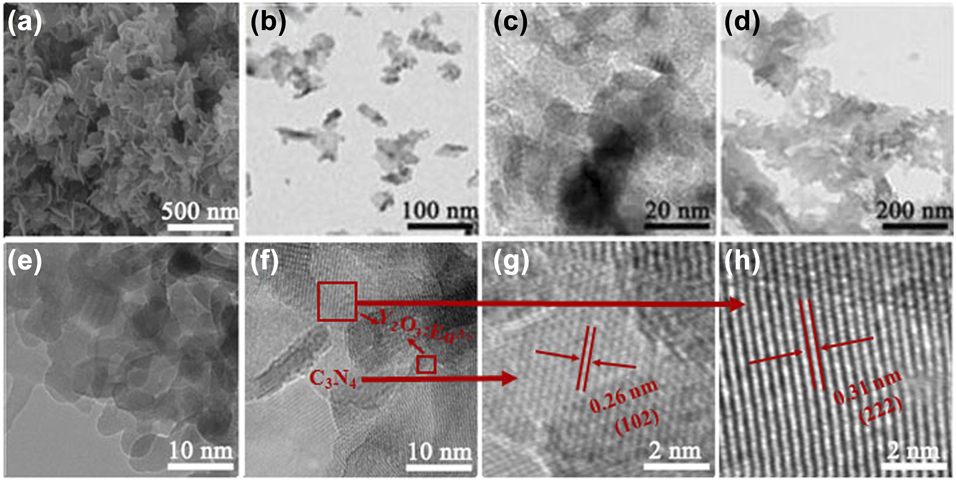
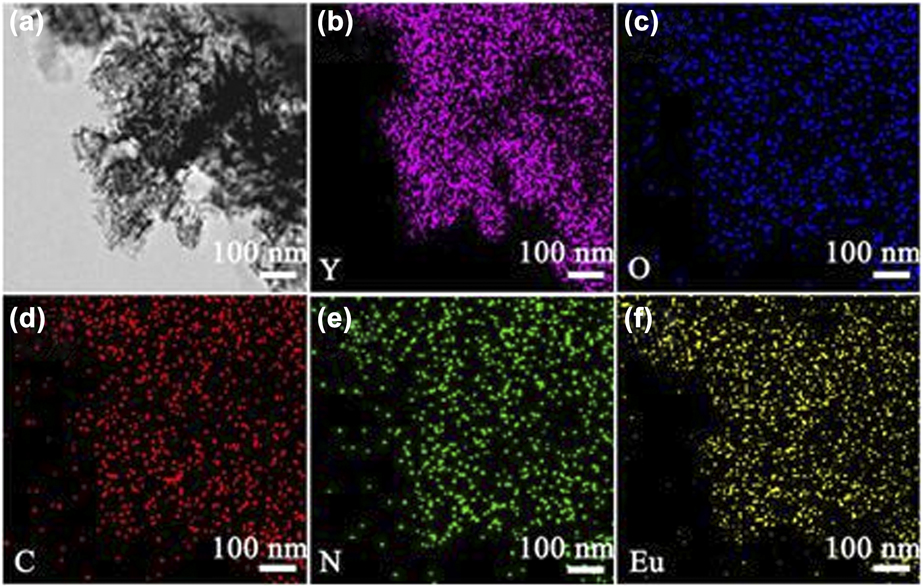
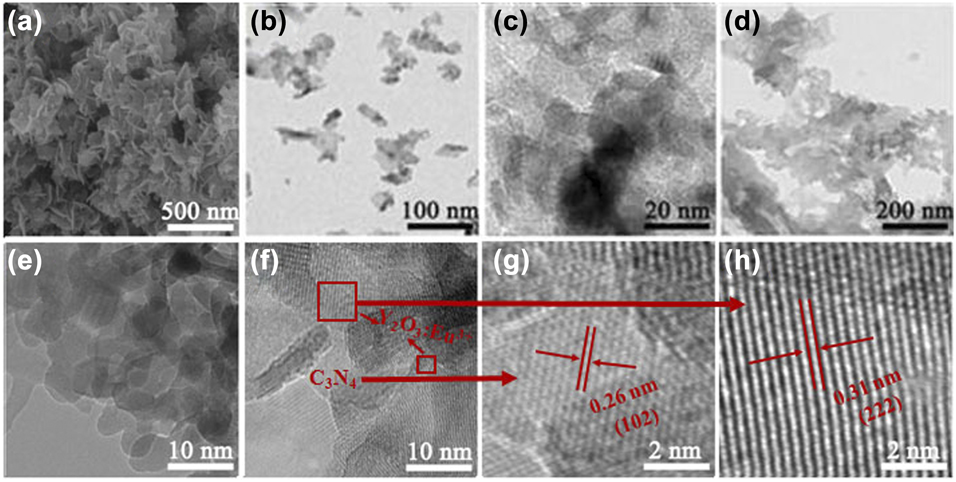
Figures 2(a)–2(c) show the scanning electron microscopy (SEM) and transmission electron microscopy (TEM) images of YONP prepared at 100 °C for 5 h after annealing at 600 °C, which are sheet-like nanocrystals. Each nanosheet consists of many nanoparticles, as shown in Figs. 2(b) and 2(c). Figure 3(d) shows the TEM image of C3N4 nanocrystals. Figures 2(e)–2(h) show the TEM and high-resolution TEM (HRTEM) images of YONP/C3N4 (1:1) nanocomposites. The HRTEM images show interplanar spacings of 0.31 and 0.26 nm corresponding to the (222) plane of Y2O3 and (102) plane of C3N4, respectively. The morphology of YONP did not change after compositing with C3N4. The results indicate that YONP and C3N4 coexist in YONP/C3N4 nanocomposites. The SEM and TEM images of YONT/C3N4 nanocomposites with different mass ratios are shown in Fig. S2. Energy dispersive x-ray spectroscopy (EDX) elemental mapping (Fig. 3) showed that the elements Y, Eu, O, N, and C were evenly distributed over the YONP/C3N4 nanocomposites. Surface oxygen not only comes from YONP but also comes from the surface of C3N4, and thus, the distribution of O is different from the Y.
(a–c) SEM and TEM images of YONP. (d) TEM image of C3N4. (e–h) TEM and HRTEM images YONP/C3N4 (1:1) nanocomposites.
EDX elemental mapping of the YONP/C3N4 (1:1) nanocomposites. (a) STEM images of YONP/C3N4 (1:1) nanocomposites. (b–f) The distribution of Y, Eu, O, N, and C in the YONP/C3N4 (1:1) nanocomposites.
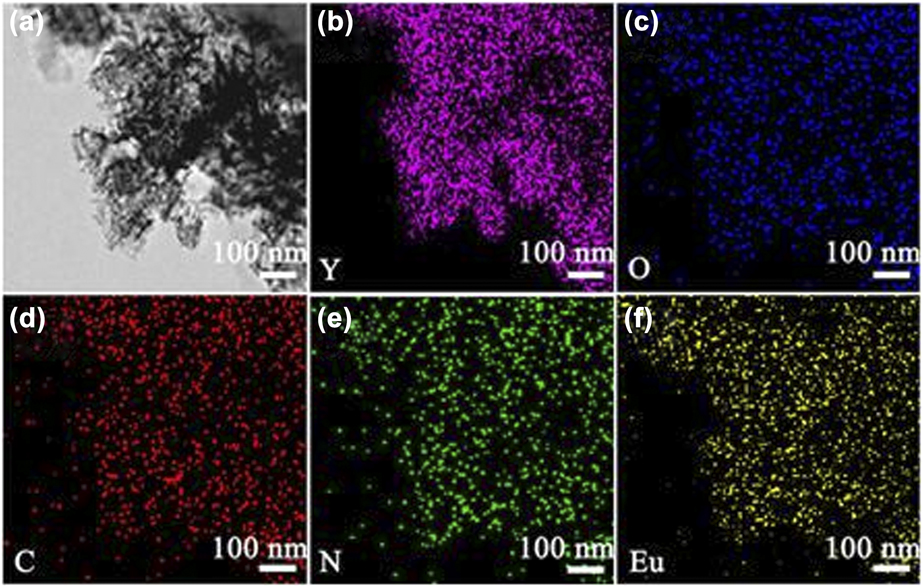
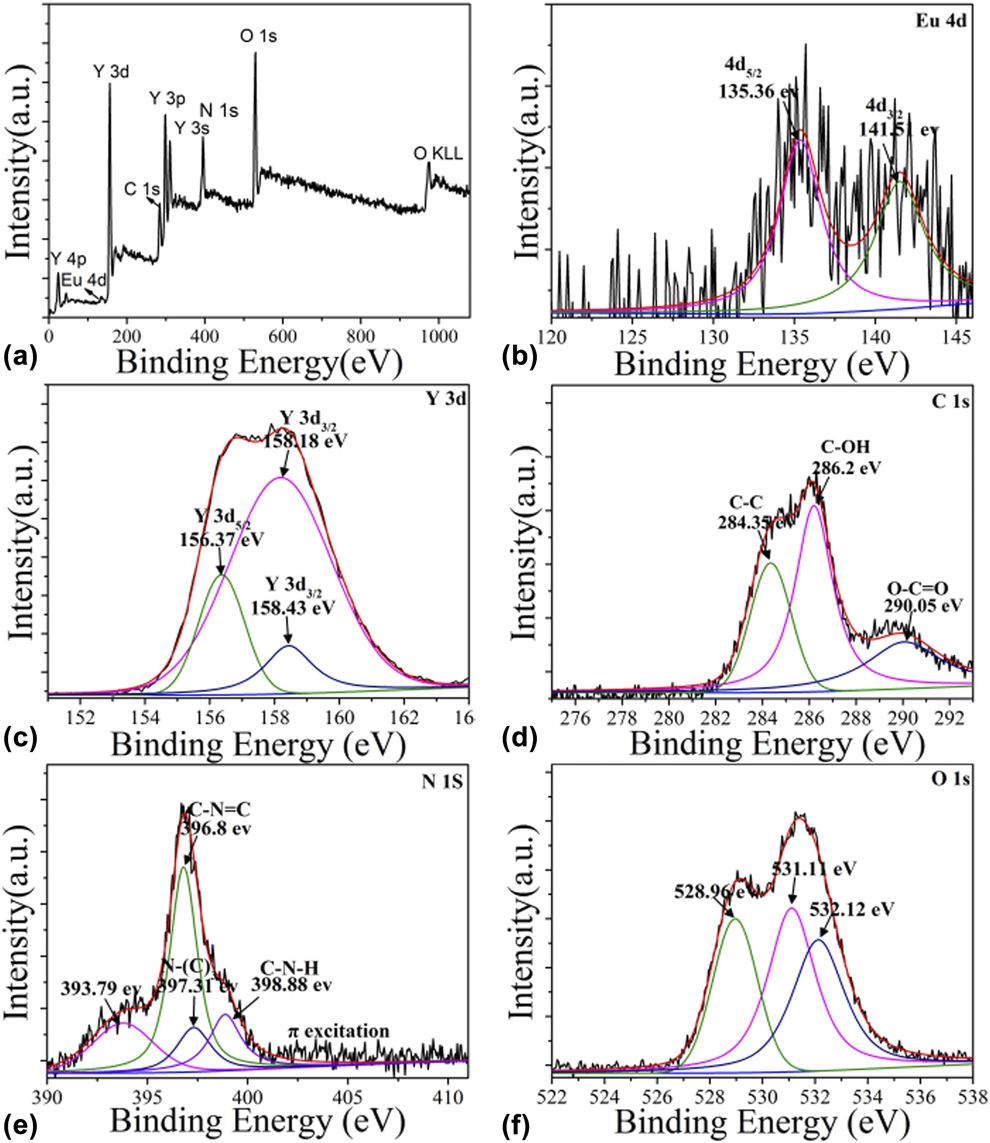
Figure 4 shows the X-ray photoelectron spectroscopy (XPS) spectra of YONP/C3N4 nanocomposites. Obviously, Y3+ was identified by its Y 3s, Y 3p, Y 3d, and Y 4p peaks, and O2− was identified by the O 1s and O KLL peaks. The peaks of O 1s at 528.96 and 531.11 eV are lattice oxygen, and the peak at 532.11 eV is surface oxygen. Eu3+ was identified by the Eu 4d peak, C was identified by the C 1s peak, and N was identified by the N 1s peak. The Y 3d 3/2 spectral peaks were at 156.37, 158.18, and 158.43 eV. The O 1s spectrum can be fitted by three peaks located at 528.96, 531.11, and 532.12 eV. The C 1s spectral peaks were at 284.35, 286.2, and 290.05 eV. The N 1s spectral peaks were at 396.74, 397.27, and 398.76 eV. In addition, the peak at 393.45 eV was attributed to Y 3s.
(a) The survey XPS spectrum of YONP/C3N4 (1:1) nanocomposites. (b–f) High-resolution XPS spectra of Eu, Y, C, N, and O.
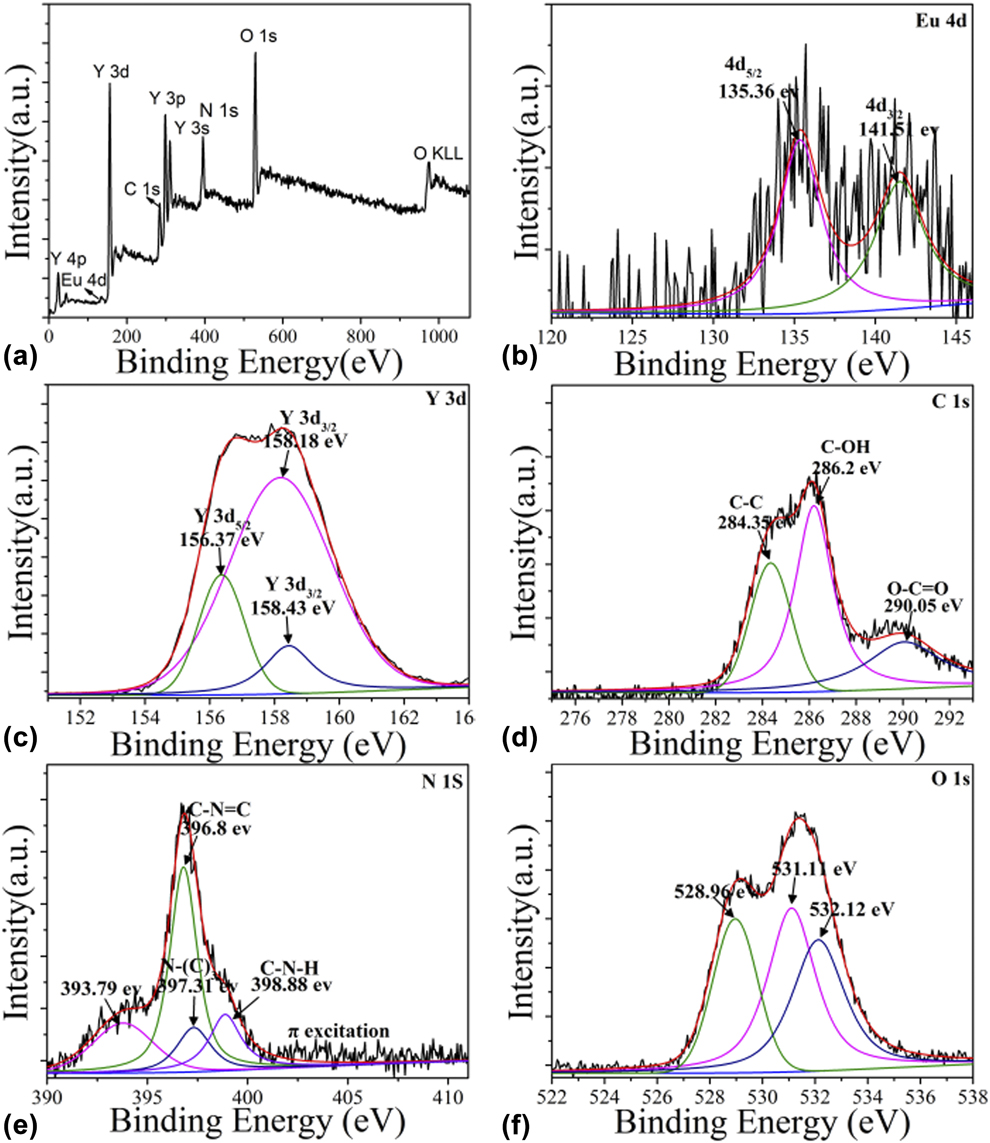
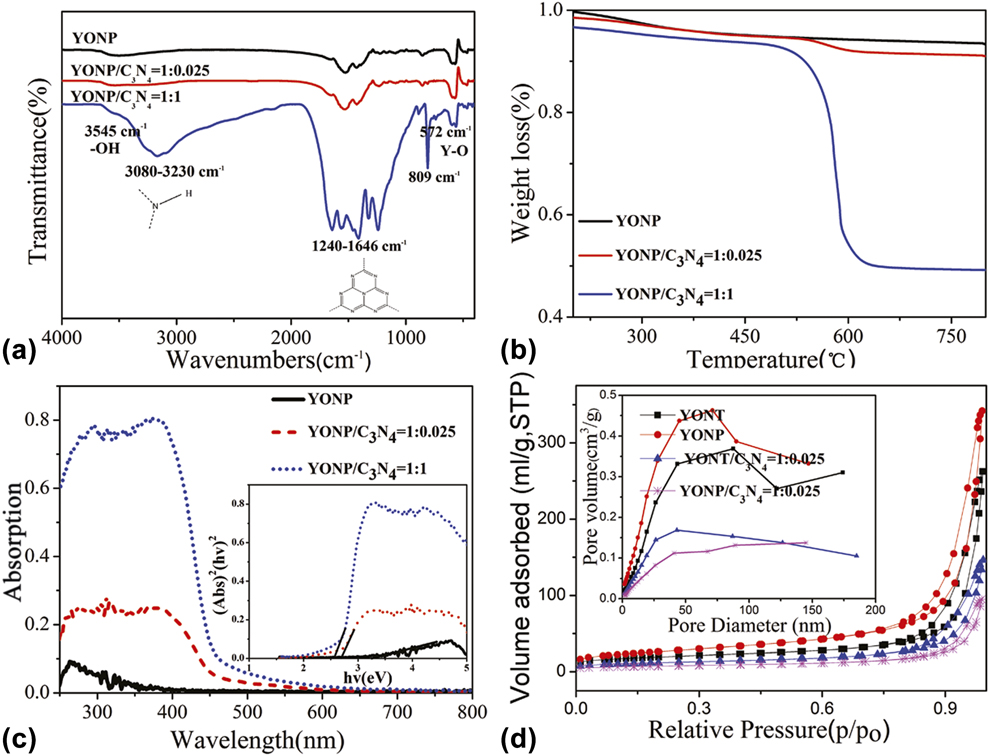
Figure 5(a) shows the IR spectra of YONP and YONP/C3N4 nanocomposites with different YONP/C3N4 mass ratios. The peak at 572 cm−1 can be attributed to Y–O lattice vibrations. The peak at 803 cm−1 was related to the s-triazine ring modes. Several strong absorption bands in the range of 1240–1646 cm−1 were originated from the skeletal stretching of C–N heterocycles with peaks positioned at 1646, 1565, 1418, 1322, and 1241 cm−1, comprising both trigonal N–(C)3 (full condensation) and bridging C–NH–C units (partial condensation). The peak position of C–N (1238 cm−1) stretching vibration peak deviates after compositing YONP, suggesting the formation of YONP/C3N4 nanocomposites. The broad peak ranging from 3000 to 3700 cm−1 was assigned to the N–H and O–H stretches due to the free amino groups and adsorbed hydroxyl species, respectively. It can be clearly seen that all the main characteristic peaks of C3N4 and Y2O3 appeared in the YONP/C3N4 nanocomposites. With the increase in the content of C3N4, the characteristic peaks of C3N4 become stronger. The IR spectra of YONT and YONT/C3N4 nanocomposites with different mass ratios are shown in Fig. S3.
(a) FT-IR spectra. (b) TGA curves of YONP and YONP/C3N4 nanocomposites with different YONP/C3N4 mass ratios. (c) UV-Vis absorption spectra of YONP and YONP/C3N4 (1:0.025) nanocomposites. (d) N2 adsorption–desorption isotherm curves and pore size distribution (inset) of YONP, YONT, YONP/C3N4, and YONT/C3N4 nanocomposites.
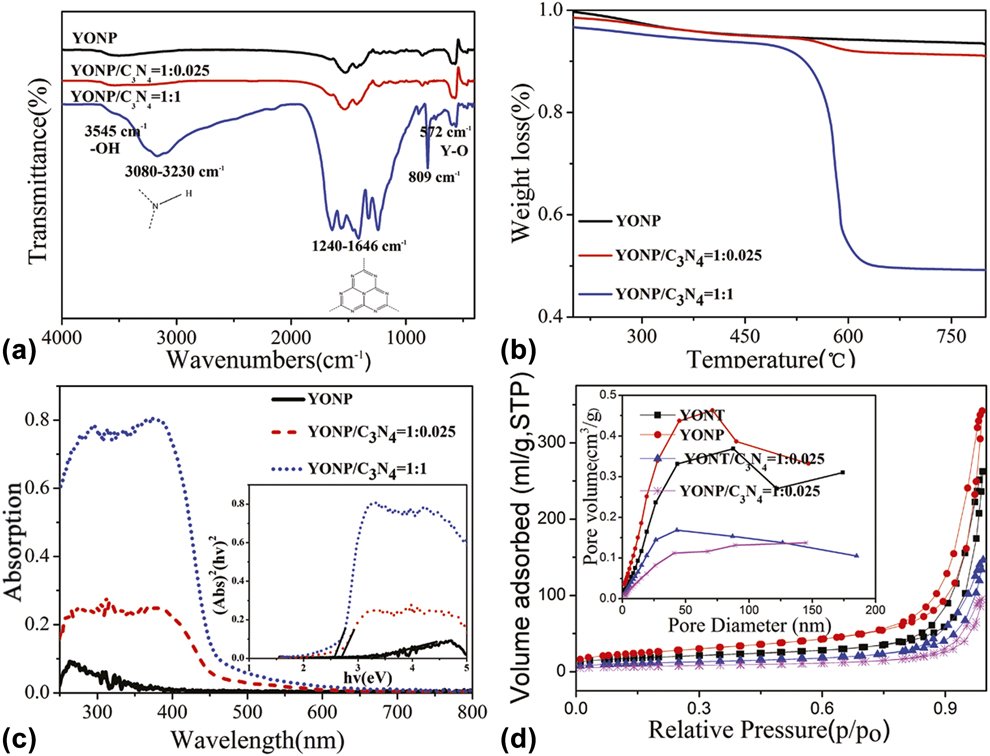
To quantificationally analyze the amount of C3N4 in the YONP/C3N4 nanocomposites, we have performed thermogravimetric analysis (TGA) for these samples. The TGA curves of the corresponding YONP/C3N4 nanocomposites in an air stream at a heating rate of 10 °C/min to the final temperature of 800 °C are shown in Fig. 5(b). Two weight loss regions could be seen in the TGA curves. The first weight loss could be attributed to the dehydration reaction. The second weight loss occurring from 500 to 600 °C could be assigned to the burning of C3N4. The amount of C3N4 in YONP/C3N4 nanocomposites could be calculated from the second weight loss, and the results indicated that the amount of C3N4 was nearly consistent to the dosage of C3N4 added.
The optical absorption of the YONP and YONP/C3N4 nanocomposites was conducted with an ultraviolet–visible (UV-Vis) absorption spectrometer, as shown in Fig. 5(c). It is noted that YONP shows the absorption band edge in the UV light region. The band edge shift was observed, and the band gap of YONP/C3N4 nanocomposites becomes narrow with increasing the amount of C3N4, which is benefit for the absorption of excitation light, as shown in the inset of Fig. 5(c).
Figure 5(d) depicts the N2 sorption of isotherm and the corresponding Barrett-Joyner-Halenda (BJH) pore size distribution plots of YONP and YONP/C3N4 (1:0.025) nanocomposites. It is found that the surface area of YONP, YONP/C3N4, YONT, and YONT/C3N4 are 93.91, 25.50, 67.52, and 42.07 m2/g, respectively. Obviously, the surface area of YONP is much larger than that of YONT; however, the surface area of YONT/C3N4 nanocomposites is larger than that of YONP/C3N4 nanocomposites. We suggested that C3N4 can be loaded much easier on the surface of YONP than on YONT. In addition, the surface areas of YONP/C3N4 nanocomposites decrease after compositing with C3N4, which can be attributed to the loading of YONP on the surface of C3N4.
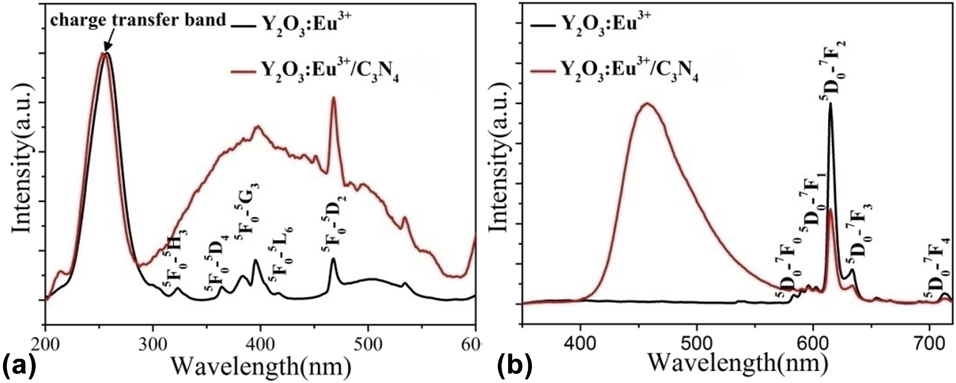
The normalized (a) excitation and (b) emission spectra of Y2O3:Eu3+ and Y2O3:Eu3+/C3N4 (1:2) composite nanoparticles.

Photoluminescence properties
Figure 6(a) shows the excitation spectra of YONP and YONP/C3N4 nanocomposites monitored at 615 nm. The broad band extending from 200 to 300 nm is assigned to the charge transfer transitions from the 2p orbital of O2− to the 4f orbital of Eu3+, which is related closely to the covalency between O2− and Eu3+ and the coordination environment around Eu3+. Obviously, the charge transfer bands showed a little blue-shift after compositing with C3N4. More interestingly, the sharp lines originate from Eu3+ f–f electron transitions overlapped with a broad excitation band from C3N4 nanoparticles, which can be attributed to the energy transfer from C3N4 to YONP.
Figure 6(b) shows the emission spectra of YONP and YONP/C3N4 nanocomposites excited at 257 nm. It is noted that a very strong peak is observed at 460 nm, which corresponds to the transition from C3N4 nanoparticles. The excitation spectra of YONP monitored at different wavelengths as well as the emission spectra excited at different wavelengths are shown in Fig. S4. It is found that the emission intensity was the strongest when the excitation was performed at 257 nm. The excitation spectra of YONP/C3N4 (1:2) nanocomposites monitored at different emission wavelengths are shown in Fig. S5(a). Obviously, the spectral shapes were dependent on emission wavelengths. Figure S5(b) shows the emission spectra of YONP/C3N4 (1:2) nanocomposites excited at different emission wavelengths.
Photoelectrical properties of TiO2–YONP–C3N4 composite DSSCs
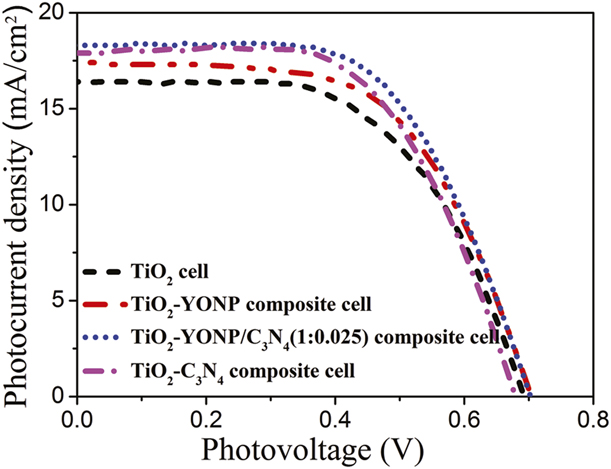
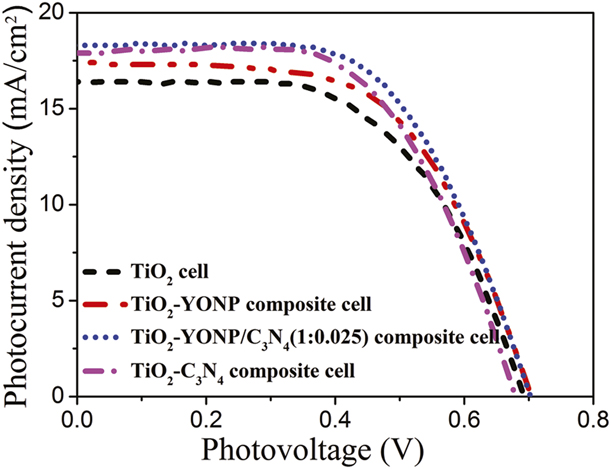
The photocurrent density–voltage (J–V) curves of pure TiO2, TiO2–YONP, TiO2-C3N4, and TiO2-YONP–C3N4 composite cells are shown in Fig. 7. The photovoltaic parameters of the DSSCs, including open-circuit voltage (V oc), short-circuit current density (J sc), fill factor (FF), and overall conversion efficiency (η) obtained from the curves of solar cells, are shown in Table I. The results indicate that the photoelectric conversion efficiency of TiO2–YONP–C3N4 composite cells was not only higher than that of pure TiO2 cells but also higher than that of TiO2–YONP or TiO2-C3N4 composite cells. More importantly, the photoelectric conversion efficiency of TiO2–YONP–C3N4 composite cells was higher than that of TiO2–YONT–C3N4 composite cells. In addition, the photoelectric conversion efficiencies of the DSSCs were also enhanced by the incorporation of YONP/C3N4 nanocomposites with different mass ratio of YONP:C3N4.
J–V curves of DSSCs based on the pure TiO2, TiO2–C3N4, TiO2–YONP, and TiO2–YONP–C3N4 (1:0.025) composite photoelectrodes under simulated solar light radiation.
Solar cell parameters of the best performing devices and the average values of the pure TiO2, TiO2-C3N4, TiO2–YONP, and TiO2–YONP–C3N4 composite cells.

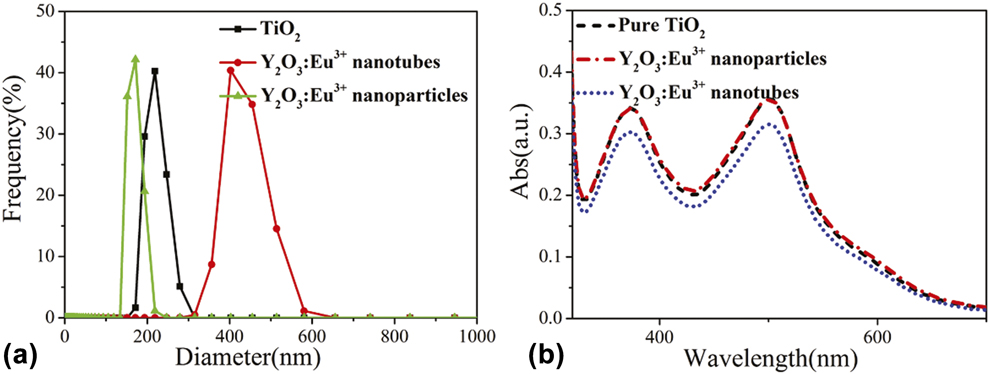
Figure 8(a) shows the dynamic light scattering spectra of TiO2, YONT, and YONP. The results indicated that the diameter of YONP is smaller than that of YONT and TiO2, which agrees with the XRD results. As mentioned above, the photoelectric conversion efficiencies of DSSCs are related to the amount of dye adsorption. Figure 8(b) shows the UV-Vis absorption spectra of desorption dye from N719-sensitized TiO2 and TiO2–YONP and TiO2–YONT photoanodes. Obviously, the amount of dye adsorption of photoanodes decreased a little after adding YONP, which was attributed to the decrease in TiO2 in the photoanodes. Moreover, the amount of dye loading for the TiO2-YONP photoanode is higher than those of the TiO2 -YONT photoanodes. It was thereby responsible for the high photoelectric conversion efficiency of the TiO2–YONP cells compared with that of TiO2–YONT cells.
(a) Dynamic light scattering spectra of TiO2, YONT, and YONP in ethanol. (b) The UV-Vis absorption spectra of desorption dye from N719-sensitized TiO2 and TiO2–YONP photoanodes.

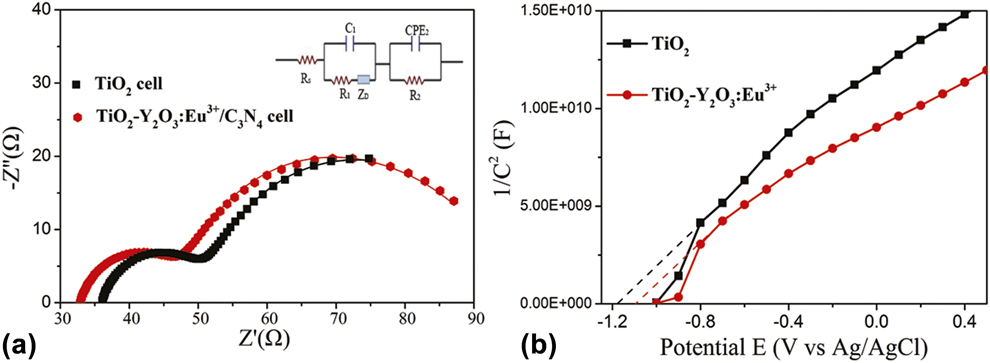
The electrochemical impedance spectroscopy (EIS) is a powerful method to investigate the electrochemical process and the interfacial charge transfer for the regeneration of a redox couple. Figure 9(a) shows the Nyquist diagrams of the impedance spectra of pure TiO2 cell and TiO2–YONP–C3N4 composite cell by applying sinusoidal perturbations of −0.8 mV. The inset in Fig. 9(a) shows the equivalent circuit fitting of the impedance spectra, R s[C 1(R 1O 1)](R 2CPE), which was used for all the composite DSSCs, and the corresponding parameters are summarized in Table SI. It can be clearly seen that R 2 is 17.23 Ω for the pure TiO2 cell and 12.27 Ω for the TiO2–YONP–C3N4 cell. The lower interfacial resistance can result in higher interfacial electron transfer, which is a beneficial factor for enhanced photoelectric conversion efficiency. In addition, R s of the pure TiO2 cell and TiO2–YONP–C3N4 cell are 36.06 and 32.84 Ω, respectively, indicating that the incorporation of TiO2–YONP–C3N4 composite is beneficial for the interfacial electron transfer of fluorine-doped tin oxide (FTO)|TiO2.
(a) Nyquist plots of DSSCs comprising TiO2 and TiO2–YONP–C3N4 cells. Inset is the equivalent circuit used to represent interfaces in composite solar cells composed of FTO|TiO2 dye|I3−/I−||Pt|FTO. (b) MS plots of TiO2 and TiO2–YONP.

Mott–Schottky (MS) plots can be used to reflect the type of semiconductors, the flat band, and the charge density. Figure 9(b) shows the MS plots of TiO2 and TiO2–YONP. The result demonstrates that these samples are n-type semiconductors from the positive slopes. More importantly, the flat band potential can be determined as an x-intercept in the MS plot. The flat band potential of TiO2 is −1.16 V versus an Ag/AgCl electrode, and the flat band potential of TiO2–YONP is −1.09 V versus an Ag/AgCl electrode, which is much more positive than that of TiO2. The slope of the plot is inversely proportional to the charge density, the smaller it is, the higher the charge density. TiO2–YONP showed a substantially smaller slope than other samples on the MS plot, illustrating that TiO2–YONP possesses higher charge density. It was thereby responsible for the high photoelectrical activities of the TiO2–YONP.
As discussed above, compared with YONT, the small Y2O3:Eu3+ particles are beneficial for dye adsorption. The results of MS plots indicate that doping small Y2O3:Eu3+ particles can improve the Fermi level of TiO2. The size of Y2O3:Eu3+ affects not only the quality of the photoanode film but also the transport of electrons. Additionally, the UV-Vis absorption band of YONP/C3N4 increases with increasing the amount of C3N4, which is beneficial for the absorption of visible light. More importantly, C3N4 has more negative conduction band position than that of TiO2, which may effectively prevent the migration of electrons from TiO2 to the electrolyte. And thus, the significantly improved photoelectric conversion efficiency of DSSC is ascribed to the synergetic effect of C3N4 and Y2O3:Eu3+.
Conclusion
In conclusion, small YONP, Y2O3:Eu3+ nanorods, and C3N4 nanocrystals were synthesized, and then Y2O3:Eu3+/C3N4 nanocomposites were further obtained by a chemisorption method, which not only are a promising luminescent material but also can be chosen to design TiO2-Y2O3:Eu3+–C3N4 composite photoanodes. The photoelectric conversion efficiency of the TiO2-Y2O3:Eu3+–C3N4 composite cells is up to 8.14%, which is much higher than that of the pure TiO2 cell (7.16%) and TiO2-Y2O3:Eu3+ (nanotubes)–C3N4 composite cells (6.9%). The results of EIS indicated that the incorporation of TiO2–YONP–C3N4 composite is beneficial for the interfacial electron transfer.
Experimental
Synthesis of small YONP and Y2O3:Eu3+ nanorods: 3 mL of Ln(NO3)3 (Ln = Y and Eu) aqueous solution (0.5 mol/L) was added to 3 mL deionized water, and the solution was thoroughly stirred, then an aqueous solution of NaOH (0.25 M) was added into the above solution. Subsequently, the milky colloidal solution was transferred to a 50 mL Teflon-lined autoclave and heated at 100 °C for 5 h. The systems were then allowed to fast cool to room temperature. The final products were collected by means of centrifugation, washed with deionized water and ethanol, dried at 80 °C for 4 h in air, and finally sintered at 600 °C for 2 h. YONT were prepared by the same procedure, except for heat treatment at 130 °C for 20 h at the hydrothermal treatment stage.
Preparation of Y2O3:Eu3+/C3N4 composite nanomaterials
The C3N4 was first prepared by heating melamine at 550 °C for 2 h in N2 atmosphere. An appropriate amount of C3N4 was added into methanol, then the beaker was placed in an ultrasonic bath for 30 min to completely disperse the C3N4. The Y2O3:Eu3+ powder was added into the above solution and stirred in a fume hood for 24 h. After volatilization of the methanol, an opaque powder was obtained after drying at 100 °C in N2 atmosphere.
Fabrication of photoelectrodes and assembly of DSSCs
Several pastes were prepared by homogeneously mixing Y2O3:Eu3+/C3N4 composites and TiO2 (Degussa P25) into 1.5 mL of a TiO2 colloid. The TiO2 colloid was prepared following a previously published synthetic procedure [Reference Wang, Dai, Zakeeruddin, Forsyth, MacFarlane and Grätzel37]. The screen-printed double layer of TiO2-Y2O3:Eu3+–C3N4 was used as the photoanode. The first layer was prepared using the doctor-blade method on a FTO substrate and then sintered at 450 °C for 30 min. Subsequently, the second layer of TiO2-Y2O3:Eu3+–C3N4 was covered on the surface of the first TiO2-Y2O3:Eu3+–C3N4 film and then sintered at 450 °C for 30 min again. Sensitization of the photoelectrodes was achieved by immersing them in 0.5 mM ((C4H9)4N)2[Ru(4-carboxy-4′-carboxylate-2,2′bipyridine)2(NCS)2] dye (N719; Solaronix SA, Aubonne VD, Switzerland) in acetonitrile and tert-butanol (volume ratio of 1:1) for 48 h at room temperature. The Pt counter electrodes were prepared following procedures previously described [Reference Hagfeldt and Grätzel38]. The dye-sensitized photoanode was assembled with a Pt counter electrode into a sandwich-type cell. The sandwich-type cell was further fixed together with epoxy resin to prevent leakage of the electrolyte solution. The electrolyte solution filling into the space between the electrodes consisted of 0.6 mol/L 1-propyl-2, 3-dimethyl-imidazolium iodide, 0.05 mol/L I2, 0.1 mol/L LiI, and 0.5 mol/L tert-butylpyridine in 3-methoxypropionitrile.
Characterization
The composition of the Y2O3:Eu3+/C3N4 composite nanomaterials was characterized by XRD using a Rigaku D/max-IIIB diffractometer (Rigaku Corporation, Tokyo, Japan) with Cu Kα (λ = 1.5406 Å, 40 kV, 40 mA). The size and morphology of the final products were determined using SEM (Hitachi S-4800 with an operating voltage of 15 kV, Hitachi, Ltd., Tokyo, Japan) and TEM (JEOL JEM-2010F, JEOL, Ltd., Akishima, Japan) at 200 kV. XPS analysis was performed on a VG ESCALABMK II (VG Instruments, Manchester, UK) with an Mg Kα (1253.6 eV) achromatic X-ray source. Fourier transform infrared (FTIR) spectra of the samples were recorded at room temperature with a PerkinElmer Spectrum one FTIR spectrometer using the KBr pellet method. Thermogravimetric measurements were carried out on a thermal analyzer (TGA-7; PerkinElmer, Waltham, Massachusetts) using a 2 mm internal diameter Teflon tube at a heating rate of 10 °C per minute under a flow of air. The UV-Vis absorption spectra were acquired with a UV-Vis spectrophotometer with an integrating sphere accessory (Shimadzu UV-2550, Tokyo, Japan). The nitrogen adsorption–desorption isotherms were collected using a Tristar II 3020 (Micromeritics, Norcross, Georgia) at 77 K. The photoluminescence spectra were recorded with a Hitachi F-4600 fluorescence spectrophotometer (Hitachi, Ltd., Tokyo, Japan) at room temperature.
Photovoltaic measurements were carried out with an Oriel solar simulator (Newport Corp., Irvine, California) equipped with an AM 1.5G radiation (1 sun conditions, 100 mW/cm2) filter as the light source. The effective irradiation area of the cell was about 0.09 cm2. The EIS was measured with a computer-controlled IM6 impedance measurement unit (Zahner IM6, Zennium, Gundelsdorf, Germany) by applying sinusoidal perturbations of 10 mV under a bias of −0.8 V at the frequency range from 10 to 1 MHz. The obtained spectra were fitted with ZsimpWin software (AMETEK, Inc., Berwyn, Pennsylvania) in terms of appropriate equivalent circuits.
Supplementary material
To view supplementary material for this article, please visit https://doi.org/10.1557/jmr.2018.482.
Acknowledgments
This work was supported by the National Natural Science Foundation of China (21471050 and 21871079) and the Innovative Project of Postgraduate of Heilongjiang University (YJSCX2018-181HLJU).