1. INTRODUCTION
In this paper, laser irradiation of a silicon target and the resulting effects on the ablation mechanisms were studied using a 800 nm, 40 fs laser pulse. Similar studies have been conducted on various materials (Sokolowski-Tinten et al., Reference Sokolowski-Tinten, Bialkowski and Von Der Linde1995; Vonderlinde et al., Reference Vonderlinde, Sokolowskitinten and Bialkowski1997; Hohlfeld et al., Reference Hohlfeld, Wellershoff, Güdde, Conrad, Jähnke and Matthias2000; Bonse et al., Reference Bonse, Baudach, Krüger, Kautek and Lenzner2002; Komashko, Reference Komashko2003; Coyne et al., Reference Coyne, O'connor, Mannion, Magee and Glynn2004; Fisher et al., Reference Fisher, Fraenkel, Zinamon, Henis, Moshe, Horovitz, Luzon, Maman and Eliezer2005; Lin et al., Reference Lin, Zhigilei and Celli2008; Kirkwood et al., Reference Kirkwood, Tsui, Fedosejevs, Brantov and Bychenkov2009; Byskov-Nielsen et al., Reference Byskov-Nielsen, Savolainen, Christensen and Balling2010; Derrien et al., Reference Derrien, Sarnet, Sentis and Itina2010), though most of these studies were focused exclusively on either the theoretical or experimental aspects of the ablation. Very few theoretical studies have been conducted on semiconductors or dielectrics (Sokolowski-Tinten & Von Der Linde, Reference Sokolowski-Tinten and Von Der Linde2000; Derrien et al., Reference Derrien, Sarnet, Sentis and Itina2010). We began our study by investigating the change in the ablation rate with respect to average laser fluence, as shown in Figure 1. It was found that unlike ablation in metals (M. Polek & Hassanein, Reference M. Polek and Hassanein2015), silicon has an almost constant rate of increase in the ablation depth as a function of fluence. Furthermore, as metals typically have the highest ablation efficiency at fluences near the ablation threshold, it was found that the ablation efficiency of silicon remained almost constant over a broader range of fluences. In order to investigate the reason behind this type of variation in the ablation depth, we modeled the femtosecond laser–material interaction with silicon targets. This model was used to predict the variation in ablation depth as a function of fluence and the results were compared with experimental values. Additionally, we modeled the variation in the optical and ion properties during the laser–silicon interaction and compared the results with experimental data including reflectivity (Section 3) and Faraday cup ion analysis (Section 4.2).
Variation in silicon ablation depth and ablation efficiency as a function of laser fluence.

2. EXPERIMENTAL SETUP
A schematic of the experimental setup used in this experiment can be found in reference (Anoop et al., Reference Anoop, Polek, Bruzzese, Amoruso and Harilal2015). In this experiment, an 800 nm, 40 fs, Gaussian beam with a maximum energy of 10 mJ was focused through a 75 mm focal length BK7-Schott lens onto a silicon target. The energy of the laser was controlled through the use of a waveplate and polarizer as well as neutral density filters. The target was translated between pulses using a motor controlled stage. All experiments were conducted at normal incidence. A Faraday cup was placed at an angle of 23° with respect to the normal in order to collect ion data. Ablation depth was determined using white interferometry analysis of the ablated surface.
Ion heat capacity for silicon at various ion temperatures.
3. MODEL
In order to model the femtosecond laser–material interaction, it is necessary to determine how the laser energy is transferred to the material. This is done through a set of coupled heat equations, typically referred to as the two-temperature model, in order to determine the variation in electron and ion temperatures as shown (M. Polek & Hassanein, Reference M. Polek and Hassanein2015):
 $${C_{\rm e}}\displaystyle{{{\rm \partial} {T_{\rm e}}} \over {{\rm \partial} t}} = \displaystyle{{\rm \partial} \over {{\rm \partial} x}}\left( {{k_{\rm e}}\displaystyle{{{\rm \partial} {T_{\rm e}}} \over {{\rm \partial} x}}} \right) - G\left( {{T_{\rm e}} - {T_{\rm i}}} \right) + {\dot q_{{\rm laser}}}$$
 $${C_{\rm i}}\displaystyle{{{\rm \partial} {T_{\rm i}}} \over {{\rm \partial} t}} = \displaystyle{{\rm \partial} \over {{\rm \partial} x}}\left( {{k_{\rm i}}\displaystyle{{{\rm \partial} {T_{\rm i}}} \over {{\rm \partial} x}}} \right) + G\left( {{T_{\rm e}} - {T_{\rm i}}} \right)$$
where C e,i are the electron and ion heat capacities, T e,i are the electron and ion temperatures, k e,i are the electron and ion thermal conductivities, G is the coupling factor which determines how quickly the electrons transfer their energy to the ions, and  ${\dot q_{{\rm laser}}} = 2{k_0}{n_2}{I_0}{e^{ - 2{k_0}{n_2}z}}$ (Komashko, Reference Komashko2003) is the rate of heat transfer to the electrons by the incident laser. Note that each of these parameters will vary depending on the electron temperature. Due to the very short time scale of the laser–material interaction, the ion temperature will not have a large impact on the properties of the material (Vonderlinde et al., Reference Vonderlinde, Sokolowskitinten and Bialkowski1997).
In order to solve the two-temperature equations, it is necessary to determine the variation in the heat capacity of the electrons and ions. In the case of ions, the heat capacity is given by the phonon heat capacity equation (Kittel & Kroemer, Reference Kittel and Kroemer1980):
 $${C_{\rm i}} = {\left. {\displaystyle{{d{U_{\rm i}}} \over {d{T_{\rm i}}}}} \right \vert _V} = 9{n_{\rm i}}{k_{\rm B}}{\left( {\displaystyle{{{T_{\rm i}}} \over {{{\rm \theta} _{\rm D}}}}} \right)^3}\int_0^{\displaystyle{{{{\rm \theta} _{\rm D}}} \over {{T_{\rm i}}}}} {\displaystyle{{{{exp}(x)x^4}} \over {{{\left[ {exp(x) - 1} \right]}^2}}}dx} $$
where n i is the ion density, T i is the ion temperature, and  ${{\rm \theta} _{\rm D}} = \hbar\! {c_{\rm s}}/{k_{\rm B}}{(6{{\rm \pi} ^2}{n_{\rm i}})^{1/3}}$ is the Debye temperature. The variation in the silicon ion heat capacity is shown in Figure 2.
Average charge state of silicon at various electron temperatures.
Next, the heat capacity of the electrons was modeled by approximating the energy of the electrons as the sum of their kinetic energy and the energy needed to move the electron across the band gap, such that:
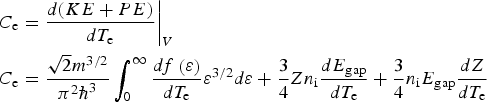 $$\eqalign{& C_{\rm e} = {\displaystyle{{d(KE + PE)} \over {dT_{\rm e}}} \bigg \vert_V} \cr & C_{\rm e} = \displaystyle{{\sqrt 2 {m^{3/2}}} \over {{{\rm \pi} ^2}{\hbar ^3}}}\int_0^{\infty} \displaystyle{{df\left( {\rm \varepsilon} \right)} \over {d{T_{\rm e}}}}{{\rm \varepsilon} ^{3/2}}d{\rm \varepsilon} + \displaystyle{3 \over 4}Z{n_{\rm i}} \displaystyle{{d{E_{{\rm gap}}}} \over {d{T_{\rm e}}}} + \displaystyle{3 \over 4}{n_{\rm i}}{E_{{\rm gap}}}\displaystyle{{dZ} \over {d{T_{\rm e}}}}} $$
where it was assumed that the average energy of each electron is given by PE = 1/2Zn i(1.5E gap) (Van Driel, Reference Van Driel1987; Derrien et al., Reference Derrien, Sarnet, Sentis and Itina2010) and Z is the number of excited electrons. Note that the energy of the band gap also varied with temperature, as given by (Van Driel, Reference Van Driel1987):
 $${E_{{\rm gap}}} = {E_{{\rm gap,0}}} - 1.5_{\rm E}- 6n_{\rm e}^{1/3} \; eV $$
In order to solve the heat capacity equation above, it was also necessary to solve for the variation in chemical potential with temperature. It should be noted, however, that the equations used to estimate the chemical potential at low temperatures (where it was assumed that the free electron contribution comes from the heavy hole, light hole, and split off bands) become invalid at high temperatures (due to lattice distortion, free electrons contribution from other bands, etc.). Therefore, two different models were applied. For the low temperature case, the chemical potential was obtained using the following equality:
 $$\eqalign{ m_{{\rm hh}}^{3/2} & \int_{ - {E_{{\rm f,hh}}}}^0 {\displaystyle{{{{\left( { - {\rm \varepsilon}} \right)}^{1/2}}} \over {exp\left[ {\displaystyle{{{\rm \varepsilon} - {\rm \mu} \left( {{T_{\rm e}}} \right)} \over {{k_{\rm B}}{T_{\rm e}}}}} \right] + 1}}d{\rm \varepsilon} + m_{{\rm lh}}^{3/2}} \cr & \int_{ - {E_{{\rm f,lh}}}}^0 {\displaystyle{{{{\left( { - {\rm \varepsilon}} \right)}^{1/2}}} \over {exp\left[ {\displaystyle{{{\rm \varepsilon} - {\rm \mu} \left( {{T_{\rm e}}} \right)} \over {{k_{\rm B}}{T_{\rm e}}}}} \right] + 1}}d{\rm \varepsilon} + m_{{\rm so}}^{3/2}} \cr & \int_{ - {E_{{\rm f,so}}}}^{{E_{{\rm offset,so}}}} {\displaystyle{{{{\left( {{E_{{\rm offset,so}}} - {\rm \varepsilon}} \right)}^{1/2}}} \over {exp\left[ {\displaystyle{{{\rm \varepsilon} - {\rm \mu} \left( {{T_{\rm e}}} \right)} \over {{k_{\rm B}}{T_{\rm e}}}}} \right] + 1}}d{\rm \varepsilon} + m_{\rm c}^{3/2}} \cr & \int_{{E_{{\rm gap}}}}^\infty {\displaystyle{{{{\left( {{\rm \varepsilon} - {E_{{\rm gap}}}} \right)}^{1/2}}} \over {exp\left[ {\displaystyle{{{\rm \varepsilon} - {\rm \mu} \left( {{T_{\rm e}}} \right)} \over {{k_{\rm B}}{T_{\rm e}}}}} \right] + 1}} = \displaystyle{{3{{\rm \pi} ^2}{\hbar ^3}{n_{\rm i}}} \over {\sqrt 2}} \;}} $$
where E f,hh, E f,lh, E f,so, m hh, m lh, and m so stand for the Fermi energies and masses of the heavy hole, light hole, and split-off bands, respectively, and E offset,so is the offset energy of the split-off band. For the high temperature case, it was assumed that all electrons are free, with the average charge contribution from each ion taken from the FLYCHK model from reference (Chung et al., Reference Chung, Chen, Morgan, Ralchenko and Lee2005). For free electrons, the chemical potential can be determined from the following equality:
 $$\displaystyle{{\sqrt 2 m_{\rm e}^{3/2}} \over {{{\rm \pi} ^2}{\hbar\! ^3}}}\int_0^\infty {\displaystyle{{{{\rm \varepsilon} ^{1/2}}} \over {exp\left[ {\displaystyle{{{\rm \varepsilon} - {\rm \mu} \left( {{T_{\rm e}}} \right)} \over {{k_{\rm B}}{T_{\rm e}}}}} \right] + 1}}d{\rm \varepsilon} = Z{n_{\rm i}}} $$
where Z is the average charge state obtained from the FLYCHK model. A comparison between the average charge states obtained from Eqs (6) and (7) is shown in Figure 3. As an additional comparison, Eq. (6) was compared with the following semi-empirical equation found in reference (Pierret & Neudeck, Reference Pierret and Neudeck1987):
 $$\eqalign{Z = \displaystyle{{2{n_{{\rm intrinsic}}}} \over {{n_{\rm i}}}} & = \displaystyle{{2\sqrt {{N_{\rm C}}\,\left( {300\; K} \right)\,{N_{\rm V}}\,\left( {300\; K} \right)}} \over {{n_{\rm i}}}} \cr & \quad {\left( {\displaystyle{T \over {300\; K}}} \right)^{3/2}}exp\left( { - \displaystyle{{{E_{{\rm gap}}}} \over {2{k_{\rm B}}T}}} \right) \cr Z & = 9.74{\smallcaps\rm E}\!- \!4{\left( {\displaystyle{T \over {300\; K}}} \right)^{3/2}}exp\left( { - \displaystyle{{{E_{{\rm gap}}}} \over {2{k_{\rm B}}T}}} \right)} $$
Electron heat capacity for silicon. Plot includes the analytical heat capacity as well as the limiting high temperature case.
For the low temperature case, we used Eq. (6) in order to obtain the chemical potential. We switched to Eq. (7) at the point at which average charge state predicted by Eq. (6) exceeds the average charge state predicted by the FLYCHK model.
Using the variation in average charge state shown in Figure 3, the heat capacity of the silicon was determined using Eq. (4) and the result is shown in Figure 4. The result was compared with the approximate form of the heat capacity for a plasma:
 $${C_{\rm e}} = \displaystyle{3 \over 2}Z{n_{\rm i}}{k_{\rm B}}$$
Silicon collision frequency at different electron temperatures.
Note that the results are almost identical except at low temperatures, where the contribution of the potential energy term is large due to the presence of the band gap. This is caused by the very low number of electrons which are excited at low temperatures, which eliminates any degeneracy effects.
With the heat capacities obtained, it was possible to determine the variation in the thermal conductivities of the ions and electrons using (Kittel & Kroemer, Reference Kittel and Kroemer1980):
 $${k_{{\rm e,i}}} = \displaystyle{1 \over 3}\displaystyle{{v_{{\rm e,i}}^2 {C_{{\rm e,i}}}} \over {{{\rm \nu} _{\rm c}}}}$$
where C e,i are the heat capacities of the electrons and ions, v e,i are the velocities of the electrons and ions (equal to the speed of sound for ions), and νc is the effective collision frequency for the electrons and ions.
A description of the equations we used to model the collision frequency for the electrons and ions is available in reference (M. Polek & Hassanein, Reference M. Polek and Hassanein2015). Below, we will provide a brief overview of these equations. At very low temperatures, the total collision frequency is dominated by collisions between electrons and phonons, given by (Komashko, Reference Komashko2003):
 $${\rm \nu}_{{\rm e}-{\rm ph}} = {\rm \nu}_{{\rm e}-{\rm ph}}^0 \cdot \left( {\displaystyle{{{T_{\rm i}}} \over {300 K}}} \right)$$
where  ${\rm \nu}_{{\rm e- ph}}^0 = 1{\rm \smallcaps E}13\!-\!\! 1{\rm \smallcaps E}15$ (Sokolowski-Tinten & Von Der Linde, Reference Sokolowski-Tinten and Von Der Linde2000) is the room temperature collision frequency whose value is typically taken as a fitting parameter. In our case, we used
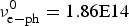 ${\rm \nu}_{{\rm e- ph}}^0 = 1.86{\rm \smallcaps E}14$. At higher temperatures, the material transitions into a plasma-like state where collisions occur between electrons and other electrons and between electrons and ions:
 $${{\rm \nu}_{{\rm ee}}} = \left( {\displaystyle{4 \over {3\sqrt {\rm \pi}}}} \right)\displaystyle{{Z{e^4}{n_{\rm i}}} \over {4{\rm \pi} {\epsilon} _0^2}} \displaystyle{{\,f_{\rm p}^2} \over {m_{\rm e}^{1/2} {{\left( {2{k_{\rm B}}{T_{\rm e}} + 2{\rm \mu}} \right)}^{3/2}}}}\ln \left( \Lambda \right)$$
 $${{\rm \nu}_{{\rm ei}}} = \left( {\displaystyle{4 \over {3\sqrt {\rm \pi}}}} \right)\displaystyle{{{Z^2}{e^4}{n_i}} \over {4{\rm \pi} {\epsilon} _0^2}} \displaystyle{{{\,f_{\rm p}}} \over {m_{\rm e}^{1/2} {{\left( {2{k_{\rm B}}{T_{\rm e}} + 2{\rm \mu}} \right)}^{3/2}}}}\ln \left( \Lambda \right)$$
where  ${\,f_{\rm p}} = 1/Z{n_{\rm i}}\int_{\rm \mu} ^\infty {\,f\left( {\rm \varepsilon} \right)\,D\left( {\rm \varepsilon} \right)d{\rm \varepsilon}} $ and ln (Λ) is the Coulomb logarithm. The resulting variation in the collision frequency is shown in by the solid green curve in Figure 5. Note that the jump in the collision frequency at 2 eV (the temperature at which there is a significant rise in the electron pressure) is caused by a transition from a solid state to a plasma-like state.
Variation in the silicon coupling factor as a function of temperature.
The collision frequency was also used to determine the variation in the coupling factor of silicon. For low fluences, the following approximation for the coupling factor was used (Van Driel, Reference Van Driel1987; Derrien et al., Reference Derrien, Sarnet, Sentis and Itina2010):
 $${{\rm \tau} _{{\rm eq}}} = \displaystyle{{{C_{\rm e}}} \over G}$$
where τeq = 1.5 ps is the equilibration time which we used based on our own experimental results. For higher fluences, where the material enters a plasma-like state, the plasma coupling factor was used given by (Callen, Reference Callen2003):
 $$G = 3\displaystyle{{{m_{\rm e}}} \over {{m_{\rm i}}}}{{\rm \nu} _{{\rm ei}}}Z{n_{\rm i}}{k_{\rm B}}$$
The final variation in the coupling factor of silicon is given in Figure 6.
Variation in absorptivity as a function of laser fluence.
Finally, in order to model the variation in the optical properties, a modified form of the Drude model was used which is valid at low temperatures (Sokolowski-Tinten & Von Der Linde, Reference Sokolowski-Tinten and Von Der Linde2000):
 $${{\rm \epsilon} _{\rm r}} = 1 + \left[ {{{\rm \epsilon} _1}\left( {{\rm \omega} + \displaystyle{{\Delta {E_{{\rm gap}}}} \over \hbar}} \right) - 1} \right]\left( {1 - Z} \right) - \displaystyle{{{\rm \omega} _{\rm p}^2} \over {i{\rm \omega} {{\rm \nu}_{{\rm eff}}} + {{\rm \omega} ^2}}}$$
where  ${{\rm \epsilon} _1}\left( {{\rm \omega} + \Delta {E_{{\rm gap}}}/\hbar} \right)$ is the room temperature permittivity of silicon as a function of frequency
 $\left( {{\rm \omega} + \Delta {E_{{\rm gap}}}/\hbar} \right)\comma \,\Delta {E_{{\rm gap}}} = $
 $- 1.5{\rm \smallcaps E}\!-\! 6n_{\rm e}^{1/3} \; eV$ is the deviation away from the original band gap at higher temperatures [Eq. (5)], ωp is the plasma frequency, and νeff is the effective collision frequency. Note that at Z > 1, the (1 − Z) term is simply set to zero and the equation reverts to the typical Drude model. Using Eq. 16, we modeled the variation in the absorptivity of the laser as a function of laser fluence as shown in Figure 7. The theoretical data was then compared with the experimental data found in reference (Riley et al., Reference Riley, Langley, Taday, Shaikh and Mccormack1998). From the figure, it can be seen that as the electron density approaches the critical density, the absorptivity begins to increase away from the room temperature value of the absorptivity. However, as the temperature continues to increase, the electron density begins to exceed the critical density and the silicon enters a plasma-like state resulting in a reduction in the absorptivity.
Variation of thermal ablation depth in silicon at various fluences. Blue data points were obtained from reference [12].
4. EXPERIMENTAL RESULTS
4.1. Laser ablation
Using our model, we made a qualitative comparison between the ablation depth shown in Figure 1 and the theoretical variation in the melt layer depth shown in Figure 8. Comparisons between reference (Coyne et al., Reference Coyne, O'connor, Mannion, Magee and Glynn2004) and results produced in the Center for materials under extreme environment (CMUXE) laboratory are also shown. Although melting does not always induce ablation, it indicates how far the laser energy is deposited into the material and gives insight into the ablation processes.
Ion temperature profile of silicon after 4 ps at a laser fluence of 0.35 J/cm2.
As can be seen from Figure 8, at low fluences the theoretical melt layer depth is much larger compared with the experimental ablation depth. This occurs as a result of a small extinction coefficient in silicon at low fluences, resulting in a deep penetration of laser energy into the target as shown in Figure 9. Further experimental verification of the melt layer depth can also be seen in Figure 10, which shows the formation of d = 200 nm pore structures on the surface of the silicon following laser irradiation near the melting threshold. Such pore structures will form following bubble nucleation beneath the surface (Bonse et al., Reference Bonse, Baudach, Krüger, Kautek and Lenzner2002), which requires a melt layer depth greater than d = 200 nm in order to form the bubbles. The small amount of ablation at these low fluences can be attributed to splashing of the melt layer as the bubbles move to the surface.
Surface morphology of silicon after 150 pulses of femtosecond laser irradiation at a fluence of F = F m,th, where (a) shows the irradiated profile and (b) shows the expanded view of the pore structures.
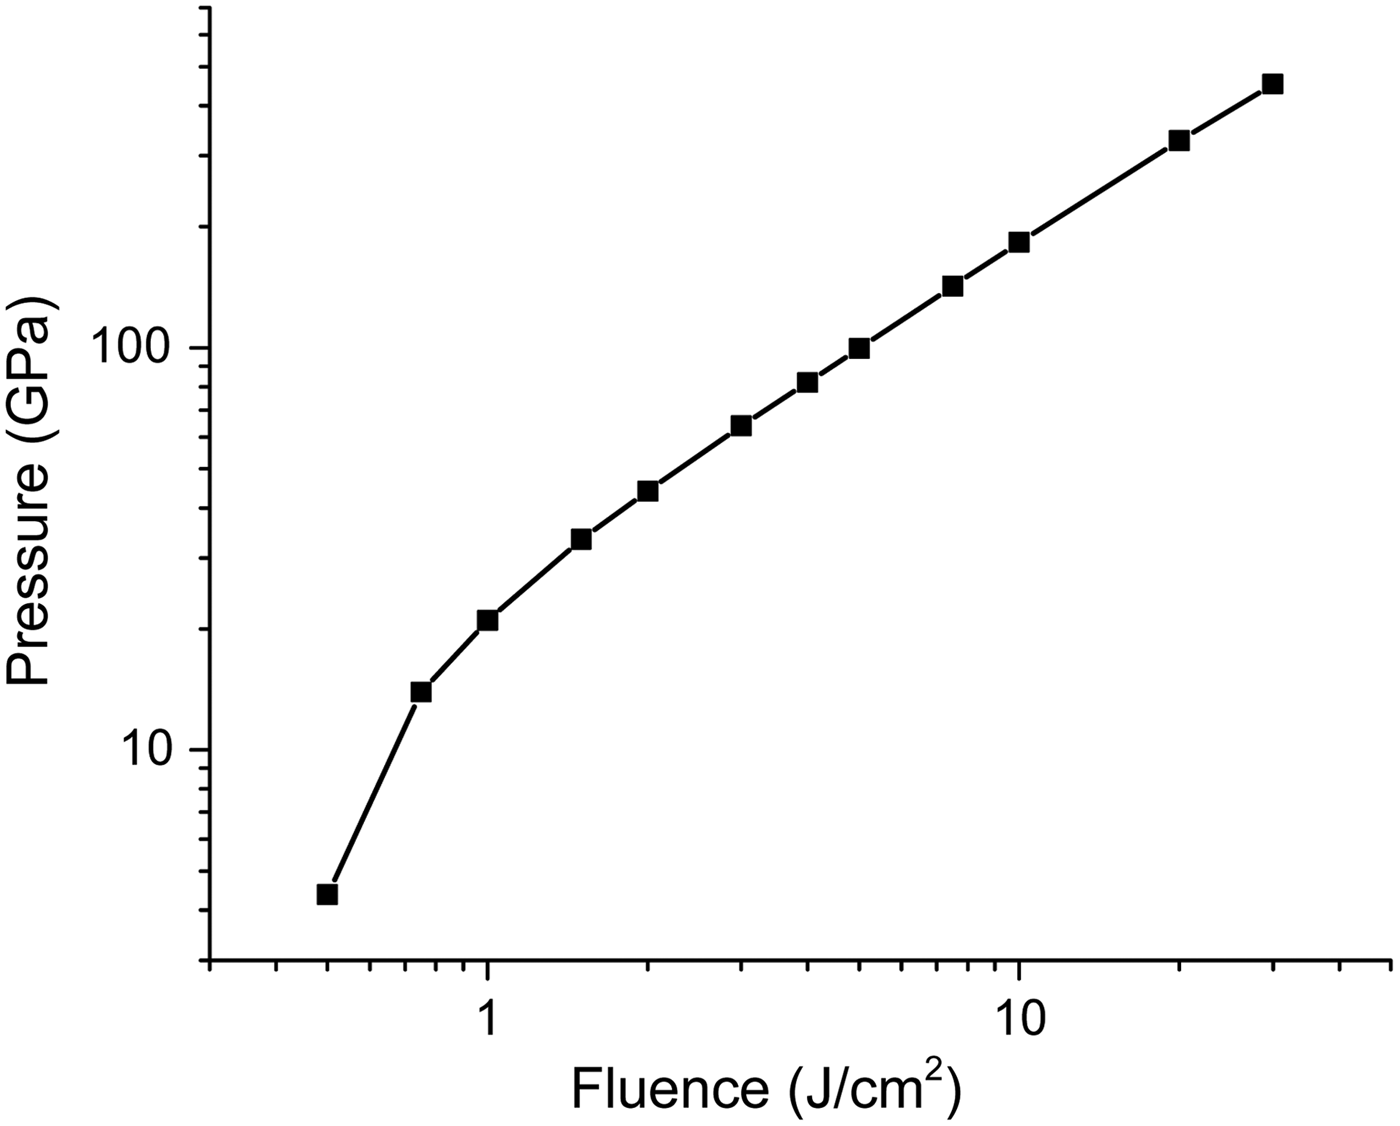
Variation in total pressure in silicon as a function of laser fluence.
At higher fluences, the theoretical melt layer depth peaks at a value of  $\sim\!\!300\; \,{\rm nm}$, with very little variation in the melt layer depth beyond 1.5 J/cm2. However, as shown by the experimental data in Figure 8, the ablation depth continues to increase. It is unlikely that thermal conduction is responsible for this increase in the ablation depth, as the target will undergo ablation and carry away most of the energy before a significant amount of energy transfer can occur. Instead, we looked at the variation in the pressure within the target as a function of laser fluence as shown in Figure 11. Note that the variation in pressure was calculated using (Drake, Reference Drake2010):
 $${\,p_{\rm T}} = Z{n_{\rm i}}{k_{\rm B}}{T_{\rm e}} \cdot {\,f_{\rm p}} - \displaystyle{3 \over {10}}\displaystyle{{{e^2}} \over {4{\rm \pi} {{\rm \varepsilon} _0}}}{Z^2}n_{\rm i}^{\textstyle{4 \over 3}} {T_{\rm e}} \cdot {\,f_{\rm p}} + {n_{\rm i}}{k_{\rm B}}{T_{\rm i}}$$
where the first term describes the electron contribution to the total pressure, the second term describes a correction factor applied to the electron contribution due to electron–ion interaction, and the third term describes the ion contribution to the total pressure.
Variation of the partition function for silicon as a function of electron temperature.
As can be seen from Figure 11, a large buildup of electron pressure takes place even at fluences near the theoretical melting threshold. This large buildup of pressure results in the formation of a shockwave, which propagates into the material while slowly dissipating its energy. This results in melting and ablation of the material above the typical optical depth of the material, as was seen for the higher fluences in Figure 8.
4.2. Faraday cup ion analysis
In addition to studying the variation in the ablative properties of silicon, the variation in the ion properties was also studied. We began by comparing the theoretical and experimental variation in the ion flux. In order to determine the variation in the theoretical ion flux, it was necessary to find the average charge state of the ions following ablation using the Saha equation, given by (Chen & Trivelpiece, Reference Chen and Trivelpiece1976):
 $$\displaystyle{{{n_{{\rm i + 1}}}{n_{\rm e}}} \over {{n_{\rm i}}}} = \displaystyle{2 \over {{\Lambda ^3}}}\displaystyle{{{U_{{\rm i + 1}}}} \over {{U_{\rm i}}}}exp\left[ { - \displaystyle{{{I_{{\rm i + 1}}}} \over {{k_{\rm B}}{T_{\rm e}}}}} \right]$$
where  $\Lambda = \sqrt {(2{\rm \pi} {\hbar ^2})/({m_{\rm e}}{k_{\rm B}}{T_{\rm e}})} $ is the de Broglie wavelength of an electron, U i is the partition function of the atoms in the i-th ionization state, I i is the i-th ionization energy of the ion, and T e is the electron temperature. The variation of the partition function as a function of electron temperature was obtained from reference (Martin & Zalubas, Reference Martin and Zalubas1983) and is shown in Figure 12. It was assumed that the silicon ions underwent free expansion with no change in temperature and no recombination following the formation of the plume in order to simplify the analysis.
Experimental and theoretical variation in silicon ion flux at various fluences.
Using the average charge state of the ions, the ion flux was calculated using (M. Polek & Hassanein, Reference M. Polek and Hassanein2015):
 $${\rm \varphi} = {Z_{{\rm avg}}}\displaystyle{{{n_{\rm i}}{A_{{\rm ss}}}{l_{{\rm nth}}}} \over {2{\rm \pi} {d^2}{I_{\rm f}}}}$$
where Z avg is the average charge state predicted using Eq. (18) (not the average free charge shown in Figure 3), A ss and l nth are the spot size of the laser and the optical depth of the laser (which together with n i gives us the total number of ions ablated), d and 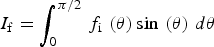 ${I_{\rm f}} = \int_0^{{\rm \pi} /2} {{\,f_{\rm i}}\,\left( {\rm \theta} \right)\sin \,\left( {\rm \theta} \right)\,d{\rm \theta}} $ are the distance between the target and the Faraday cup and an integration factor, respectively, and f i (θ) is the angular ion distribution function which was obtained experimentally. A comparison between the theoretical and experimental values of the ion flux is shown in Figure 13.
Comparison of the silicon ion velocity as a function of laser fluence.
As can be seen from Figure 13, the ion flux varied almost linearly with fluence, similar to the variation in the ablation depth. From our model, it was determined that the ion flux originates from a thin layer of material on the surface of the silicon, comparable with the melt layer. This results in saturation in the number of ions, which contribute to the ion flux at high fluences (as was seen in Figure 8). The main contribution to the increase in the ion flux at fluences above  $\sim\!\!1.5\; \,{\rm J/c}{{\rm m}^2}$ comes from the variation in the charge state of the ions. Note that unlike the ablation depth, the energy transfer to the material from shockwaves is not enough to induce significant ionization of the atoms.
In addition to the ion flux, the variation in the ion velocity was also modeled and compared with experimental results. The variation in the theoretical ion velocity was determined using the following equation (M. Polek & Hassanein, Reference M. Polek and Hassanein2015):
 $${v_{\rm i}} = \sqrt {2\displaystyle{{\left( {1 - R} \right)F} \over {{n_{\rm i}}{l_{{\rm nth}}}{m_{\rm i}}}}} $$
where (1 − R) is the value of the absorptivity, F is the incident fluence, l nth is the optical depth, and m i is the ion mass. Note that in this equation, it was assumed that all of the absorbed laser energy is converted into the kinetic energy of the ions and is transferred equally to both ions and neutrals. The resulting variation in the experimental and theoretical ion velocity is shown in Figure 14.
Figure 14 shows that the theoretical velocity qualitatively followed the variation in the experimental data of velocity. However, the values of the experimental data were much higher compared with the theoretical predictions. One reason for this discrepancy is the non-uniform distribution of laser energy to different particles. Following the absorption of laser energy by the electrons, the electrons will begin to expand away from the surface, dragging their ion cores through Coulomb interaction. This Coulomb interaction is larger for higher charge state ions, resulting in a larger transfer of energy from the electrons to ions with a higher charge state. This also results in very little energy being transferred to the neutral species. Consequently, more laser energy is transferred to a smaller ion population, resulting in higher average ion velocities. This issue is also compounded by shortcomings in Faraday cup ion analysis, where higher charge state ions with larger velocities are counted as multiple ions (M. Polek & Hassanein, Reference M. Polek and Hassanein2015). This results in an overestimation of the average ion velocity.
4. CONCLUSION
In this paper, the theoretical variation in the ablation and melt layer depth as well as the variation in ion properties of silicon during femtosecond laser irradiation were modeled and compared with experimental results. It was found that at low fluences, the melt layer depth exceeds the ablation depth due to the large optical penetration depth of the laser, resulting in the formation of a deep melt layer. At higher fluences, the ablation depth was found to exceed the melt layer depth due to a large increase in the electron pressure followed by shockwave ablation. A comparison between theoretical predictions and experimental data of ion properties revealed that the majority of ions originate from a thin surface layer of material, with the main variation in ion flux caused by a variation in the average ion charge. Discrepancies between experimental and theoretical values of the ion velocity was explained as caused by a non-uniform distribution of energy to different charge state ions, with a larger amount of energy being transferred to ions with higher charge states. Future work will be aimed at reducing the discrepancies between the theoretical and experimental results by reducing the number of assumptions made in our calculations. This will require a better understanding of the transient properties of the material during femtosecond laser irradiation, and how the material behaves immediately after the end of the laser pulse.
ACKNOWLEDGMENT
This work is supported by the National Science Foundation, PIRE Project.