1 Introduction
During the past 20 years, pension reforms all over the world have lowered pension benefits to (early) retirees and given individuals more responsibility in managing their saving decisions to support post-retirement incomes. Examples of such reforms are those in Italy (1992–95), Germany (2001–04) and the Netherlands (2004–10). Our research question is whether employees overestimate or underestimate the drop in income upon retirement. Next, we look at what factors drive this misperception. Is it because of uncertainty about the future or a lack of ability/knowledge in computing retirement benefits?
If the effects of pension reforms on future retirement income are not well understood, current consumption and saving decisions may be based on wrong perceptions. This question is even more relevant in systems that allow users to manage pension-saving decisions and reward postponing retirement with higher pension benefits. If this (new) mechanism is not understood, the short-run effects of system reforms, such as adapting current household savings, may not come into play. Policy-makers should consider this when designing pension reforms and when communicating these policies to the public.
The present study is relevant to different branches of the pension literature. First, it relates to the literature on the retirement consumption puzzle (Hamermesh, Reference Hamermesh1984). The empirical results on consumption smoothing suggest that individuals are possibly surprised by their drops in income upon retirement (see Banks et al. (Reference Banks, Blundell and Tanner1998) for the UK and Bernheim et al. (Reference Bernheim, Skinner and Steven2001) for the US). These findings are challenged by opposing results in other countries (Hurst (Reference Hurst2008) for the US, Alessie and Ree (Reference Alessie and Ree2009) for the Netherlands and Christensen (Reference Christensen2008) for Spain). More connected to our study is the paper of Hurd and Rohwedder (Reference Hurd and Rohwedder2003), who assess the expected consumption drop of a cohort approaching retirement and the realized consumption drops of current retirees. They find that the post-retirement consumption expectations of those approaching retirement are close to the realizations of current retirees and that the mismatch can be explained by substitution effects, such as home production.
The present study is more related to the literature on financial literacy. This literature shows that individuals have difficulties with the complex computations needed to make appropriate savings decisions. Alessie et al. (Reference Alessie, van Rooij and Lusardi2011) show that those who are more financially literate report lower replacement rates (RRs). In this study, we show that many individuals are poorly informed about the main features of their occupational pension plans. This is consistent with the literature that suggests that the degree of information is responsible for faulty expectations and therefore possibly interferes with the decision-making process (Van Els et al., Reference Van Els, Van den End and Van Rooij2004).
Finally, some studies have focused on expected replacement rate (E(RRs)). This is the main variable that we study, and our study is thus complementary to this literature. Particularly related is the study of Bottazzi et al. (Reference Bottazzi, Jappelli and Padula2006), which also documents an overestimation of the E(RR) following the Italian pension reforms of the 1990s.
The country of analysis in this study is the Netherlands. We choose this country not only because the system was recently reformed but also because a long series of panel data on E(RRs) is available. These data also allow for the computation of RRs based on individual pension records and earnings profiles. We label these computations estimated RRs.
In the present study, we decompose the mismatch between expected and estimated RRs into two components. The first is owing to the uncertainty about the future, while the second concerns the lack of knowledge of pension institutions. We find that the second explanation accounts for most of the mismatch. The level of the mismatch is more difficult to report conclusively, as we show that our results depend on some assumptions, which imply many sensitivity and robustness checks. We also show that lower future RRs may depend on higher than expected wage increases before retirement. Any of these explanations can be relevant to policy-makers. This implies that there is room to improve retirement financial planning by improving the institutional awareness of future retirees.
Relative to the study of Bottazzi et al. (Reference Bottazzi, Jappelli and Padula2006), who also show overoptimistic expectations of the RR, we examine the causes of the mismatch and the sensitivity of our results to the assumptions needed to compute the estimated RR. Therefore, our study makes two contributions. First, we research the origin of the mismatch between expected and estimated RRs. We propose that the lack of financial literacy and proper information are possible explanations. Second, we show how sensitive the results can be to certain underlying assumptions.
The remainder of the paper is organized as follows. Section 2 describes Dutch retirement institutions. In Section 3, we introduce the data contained in the DNB Household Survey (DHS). Our methodology is described in Section 4, where we show the analytical results. Section 5 summarizes and concludes. In the Appendix, we show how institutions are applied on our data.
2 Pension institutions in the Netherlands
As most part of this study is about correctly computing individual pension wealth, we first look at the Dutch retirement system. This is structured on three main pillars. The first pillar is a flat rate benefit for those who reach the normal retirement age of 65, namely the pay-as-you-go social security benefit or AOW. The AOW is not linked to a person's employment history and it only varies depending on the number of years that an individual has been resident in the country, on whether they have a partner and on the partner's income status. To make our measure of the AOW more realistic, we explicitly account for the survival of both partners.
The second pillar is exclusively based on final earnings (before 2004) or on a mixture of final earnings and average earnings (from 2004 onwards), which we account for by adapting the institutional parameters (accruals, etc.) of the different regimes over time. For a more comprehensive description of the Dutch pension system, we refer readers to Euwals et al. (Reference Euwals, van Vuuren and Wolthoff2005) ; hereafter, we only highlight those elements that are relevant in the computations of the estimated RRs.
There are special arrangements for individuals who want to retire before the age of 65. Although these arrangements differ greatly among pension funds, they (recently) introduced a certain degree of actuarial fairness. We show in the Appendix how these arrangements are incorporated into our computations.
In the pension system based on the final salary, pensions tend to be fully indexed to prices or wages and employees build up fixed entitlements. In the average wage system, employees build up entitlements as a percentage of their current wages. Using the subsequent indexation to prices and wages, these entitlements can grow to a certain percentage of average wages upon retirement (Van Ewijk, Reference Van Ewijk2005).
Participation in the third pillar of the pension system is voluntary. Institutions only provide limited fiscal facilitations to individuals with specific pension histories. Some individuals saved or bought annuities to finance their pensions, such as mutual funds or life insurances. In this study, we will concentrate on the first and second pillars of the Dutch pension system. Recent research on the third pillar shows that this will not be able to generate substantial increments to pension benefits after retirement (Mastrogiacomo and Alessie, Reference Mastrogiacomo and Alessie2011).
3 Data and descriptive analysis
The analysis is conducted using the DHS. The DHS, formerly known as the CentER Savings Survey, has been collected annually since 1993. We use 14 waves covering the period 1993–2006.Footnote 1 The survey focuses on savings but also covers a wide range of topics such as household background characteristics, labor market conditions, health, income and psychological concepts. We have approximately 4,000 individual observations with non-missing item responses on the questions regarding income, expected retirement age and RR. The question on planned retirement age is asked in the first nine waves only to those aged over 50. The focus of our study is on the questions about expectations in the DHS, which are formulated as follows:
• At what age do you expect to retire or make use of the early retirement arrangement?
• How much do you expect your net retirement pension (including general old age pension (AOW)) to be (in percentages) in relation to the net income you will have just before you retire?
In Figure 1, we plot mean RR expectations against planned retirement age to show the unconditional distribution of expected retirement age (vertical axis on the right). The latter shows the peaks at ages 60, 62 and 65 in accordance with the specific financial incentives available for early retirement and with social security rules.
Expected net retirement replacement (mean) rate over planned retirement age and its frequency. Source: DHS, own computations. Sample period 1993–2006; 4,157 observations.

There is no clear direction in the relationship between planned retirement age and E(RR). At the individual level, we would expect a positive relationship, because the new Dutch pension system rewards postponing future retirement. Here, however, average figures are shown and it is possible that those planning to retire early have more attractive early retirement schemes.
We have also looked at the distribution of the E(RRs) given the planned retirement age. For those expecting to retire at 65, approximately 40% expects a net RR of 70%, while 6% expects a drop in income above 50% or below 20%. From the figure, we also see that expectations of RRs are approximately 70% for all planned retirement ages. This is not surprising because this is the target figure for the main Dutch pension funds and, therefore, this RR is considered to be a goal for their retirements by most employees (Van Els et al., Reference Van Els, Van den End and Van Rooij2004). Most funds have actually designed their contribution plans to reach the 70% benchmark for a median career worker. Note that, however, this benchmark is related to gross income. Higher net RRs (Kerkhofs et al., Reference Kerkhofs, Lindeboom and Theeuwes1999) were registered in the past, up to 80–90%, because retirees are exempted from social security and pension premiums. In accordance with the expectation question above, we compute net RRs. This means that our computed RRs are lower than those documented by the literature in the 1990s.
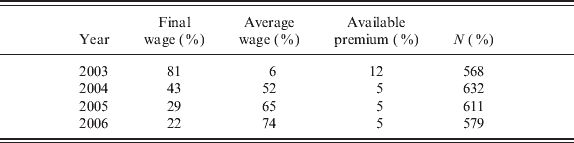
The DHS data also contain information on understanding the pension system. Respondents are asked how they build up entitlements: using the available premium, average earnings or final earnings. The latter system was abandoned by several large pension funds in 2004. Table 1 selects the funds that abandoned the final earnings program and shows that many participants in these funds are not well informed about the change in the program. Three years after the introduction of the average earnings system, approximately one-quarter of participants thinks that the previous program is still in place.
Individual believes about current pension system participation

Respondents are asked: ‘How is your pension built up?’ We have selected members of the ABP and PGGM funds.
In 2004, the final wage computation was dropped.
Source: DHS, own computations.
The data also show that those heads of the household employed in our sample change their labor supply little over time and still hold a full-time job (at least 38 hours a week) before retirement. The international consensus in the literature is indeed that the labor-supply elasticities of breadwinners are very low as they, also in the Netherlands, tend to work full-time (Bosch and van der Klaauw, Reference Bosch and van der Klaauw2012). This is why we assume continuous future careers when we consider future income.
To compute the estimated RR, we need to determine the expected future wage Et(wR) at the expected retirement moment R. We need an imputed benefit, and thus we also impute past wages. We do not need to base our computations exclusively on assumptions in order to impute expected future wages. This is because individuals are directly asked what their expected household income increases are in the short run and over the next 5 years. These questions give us a good proxy for the head's future wage increase. We use the answer to the statement ‘I do not expect any significant changes in the household income in the next 12 months’, which we translate into a constant income for the next year, and to the question ‘By what percentage do you think the total net income of your household will increase/decrease in the next year?’, which we use to determine wt+ 1. Before retirement, we use the answer to the question ‘What will your net income per month be when you will be 65 years old?’, which we assign as the income of 64-year-olds and those planning to retire at 65. For the period in between, we use information derived from the answer to the question ‘By what percentage do you think the total net income of your household will increase/decrease in the next 5 years?’ For 52–68% of our sample, we have missing information about these income expectations. No specific wage information is available about the past. We reconstruct wages in the past using the panel, which in some cases results in wage information that goes back 10 years including unemployment spells.
Unfortunately, such long wage histories are very rare in our data (only 2% have more than eight lags and 80% have fewer than five), so we use two different approaches to determine the missing past and future wages. For the past, sometimes we observe and use information on unemployment spells. In the first approach, we work with current income and combine this assumption with a spectrum of different growth rates if no expected income is available. This is different from studies that fix the growth rate ad hoc (Bottazzi et al., Reference Bottazzi, Jappelli and Padula2006; Burkhauser et al., Reference Burkhauser, Butler and Gumus2004), as we work with rates between 0% and 7% (these extremes are both unrealistic, but rates of 3–5% are used by most agencies of economic research, see OECD (2008) ). Next, we estimate a wage equation in order to fit future and past wages, which will be brought to current values using a wage index. In the Appendix, we show how we combine all the information presented above in order to compute the benefits and, therefore, the estimated RRs. We also show there our preferred wage model.
4 Empirical results
4.1 Estimated RRs
The study of RRs aims to understand whether there exist differences between the E(RR) and the estimated RR when we mimic pension institutions in a systematic way. We make some assumptions about past and future contributions into the system. This implies that we will not be able to produce one result only concerning the difference between these two RRs. We will thus report a series of results and sensitivity checks depending on the assumptions regarding the growth rate and formation of wage expectations.
Table 2 shows an overview of the scenarios that we have taken into account. For each scenario type, we have checked the sensitivity to the growth rate and found that the most interesting results were reached for a rate as high as 5%. As an illustration, we work with six rates, namely 0%, 1%, 3%, 4%, 5% and 7%.Footnote 2 The table shows that we run 54 scenarios for each individual.
Overview of the scenarios taken into account

Some of these scenarios depart from real institutions and also assume that individuals make ‘systematic mistakes’ in computing their RRs. Table 1 shows that many are poorly informed about their pension programs. To mimic this, we systematically add two ‘systematic mistakes’ in our scenarios. In this way, we can see whether the E(RR) is a good proxy for someone who misunderstood the rules. Our discussion on this issue is illustrative, as we only attempt to understand whether the mismatch is reabsorbed by assuming that respondents make systematic mistakes.Footnote 3
In a companion paper to this study,Footnote 4 we also show examples of the computation of the RR for a random individual in order to highlight how sensitive this variable is to different scenarios. In some cases, lower RRs are caused by higher pre-retirement incomes rather than by lower pension benefits. We do not show here the full set of results for each scenario. We only highlight selected scenarios that allow us to describe qualitatively the effect of our assumptions on the RR computations. We also show how many expectations fit our estimations.
Table 3 shows the estimated RRs under scenario type 5 with three growth rates. These rates are in line with the expected price changes of approximately 4% reported by Arnold and Lemmen (Reference Arnold and Lemmen2006). We see that the youth experience lower RRs upon retirement relative to the elderly, whereas expectations vary little among cohorts.Footnote 5 This result is driven by two main effects that specifically affect younger cohorts. The first effect passes through wages and enlarges the denominator of their estimated RRs. Younger cohorts have higher current incomes and given ages relative to older cohorts (cohort/time effect). The second effect passes through the pension institutions that are used to compute the pension benefit. The youth expect to retire earlier than the normal retirement age of 65 and thus they are more likely to be penalized by the actuarially fair correction relative to older cohorts. Elderly workers matured more entitlements in the (more generous) pre-2004 regime.
Estimated and E(RR) and planned retirement age, different scenarios of Type 5 (head)

RRs are computed on the basis of a wage equation (Type 5 in Table 2) to estimate future and past wages. In a companion paper, we also use current income which is yearly increased by fixed percentage and results are similar. The scenarios we report here are illustrative. We have also experimented with different wage equations, growth rates and different definitions of current income. These are net RRs at the expected retirement age, relative to net wage the year prior expected retirement. The shares reported indicate how many respondents fall within the interval that is created by the upper and lower counterfactual RRs (e.g., in the youngest group 4% of the expected replacement is between 37% and 55%) or are above the upper bound.
The average figures suggest that the E(RR) and expected retirement age vary little across cohorts, and this is striking. These averages hide some variations, mostly in expected retirement age. Figure 2 shows that younger cohorts do more often expect to retire at the normal retirement age of 65, while older cohorts expect age 62. At other ages, the differences are small. The distribution of the E(RR) is shown in Figure 3. Younger cohorts do not expect very often to receive a RR higher than 70%, but overall the different cohorts do not have very dissimilar distributions.
Distribution of the expected retirement age, different cohorts. Source: DHS, own computations. Sample period 1993–2006. The cohort years of birth are reported.

Distribution of the E(RR), different cohorts. Source: DHS, own computations. Sample period 1993–2006. The cohort years of birth are reported.

The main result of our scenario analysis is that our choice of the earnings growth rate matters more for younger cohorts than older. This has to do with the many unrealized future wages that need to be imputed. However, regardless of which rate is chosen, and regardless of the method we use to project future incomes, younger cohorts overestimate their RR by a substantial amount. This lack of awareness of future RR should be of concern for instance to pension funds.
In Table 3, we also add the share of E(RRs) that falls within the upper and lower estimated RRs (see Manski, Reference Manski2004) and the share above the largest RRs. Whereas only 4% of the youngest respondents report an RR between 37% and 55%, approximately 40% of those born between 1942 and 1946 reports E(RRs) between 67% and 72%. Although this seems to be suggestive of older respondents being more accurate, it may actually only show that most E(RRs) will fall within the interval when this includes the value of 70%, which is the most commonly reported. Manski's method is not always fully informative when we deal with scenario analysis, as we are able to produce scenarios with much wider ranges, thereby moving the boundaries to include more respondents. However, adding this information allows us to better see the limitations of using point expectation answers and to explore the tails of the distribution of the E(RRs). These results imply that a plan to retire early penalizes the youth and that the mismatches between expected and estimated RRs are largest for this group. These results come with three main concerns.
So far, we have suggested that the mismatches between the expected and estimated RRs of the youth depend either on the evolution of income or on the differential effect of the new (and more actuarially fair) pension institutions. Another argument is that being more distant from retirement, there are more ‘unknowns’ in their computations of future income. As we show that many people ignore pension institutions, this may result in a larger mismatch through the mistaken application of pension rules on a longer series of unknowns. There are also other possible explanations. Answers on the E(RR) could be driven by focal points (van Santen et al., Reference Van Santen, Alessie and Kalwij2011); in our sample, approximately 40% of those planning to retire at 65 reports a RR of exactly 70%. Those included in restrictive pension reforms are thus more likely to miss the correct distance from the focal point if this point is centered on current realizations of older cohorts. Our first concern is that any such competing explanations could be supported by our findings.
As discussed above, higher wage growth rates deliver lower RRs. In the Appendix, we explain exactly how we deal with price and wage indexes in the computation of the benefits. As we account for mortality, indexation is, in a sense, age-dependent, although the indexation rate itself is held constant to the reported level (if present) or to the fixed rate. The results show that for an indexation as high as 3% the RRs are lower than expected, whereas the results in line or above expectations are found with rates between 1% and 3%. Again, fixing the indexation ad hoc can determine whether we end up with an overestimation of E(RR) or not, which is our second concern.
The last concern is motivated by the wrong answers in Table 1. We have computed the RRs by thoroughly applying individual pension rules. However, respondents, as seen above, might have a different idea of what an RR actually is. Would the E(RR) comply with our estimations, if we assume a predictable misunderstanding of the rule? In order to test this, we allow for two ‘systematic mistakes’ in the computation of the pension benefit. In the first, we add the AOW of the spouse to that of the head and, in the second, we apply the computations of 65-year-olds to early retirees as well. We find that the latter mistake does not affect the RR of older cohorts much, who are less penalized by choosing early retirement owing to the old pension rules. However, it does have a very large effect on the youth (an RR of approximately 10–15% points extra when the growth rate of wages is zero). This shows how early retirement affects the RRs of the youth. The inclusion of the AOW of the partner has a similar average effect as does prolonging work until 65.
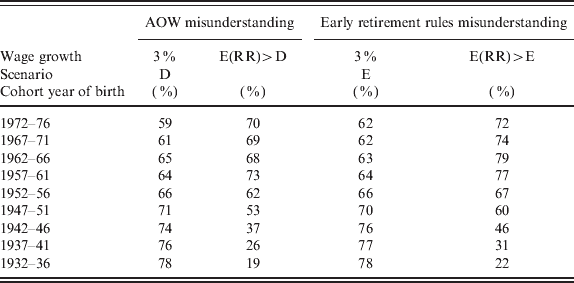
Comparing the positive effects of ‘age 65 misunderstanding’ and that of the AOW ‘misunderstanding’ on the RR, we notice that the latter is distributed differently by cohort. It affects the very young and the very old less than it does the middle-aged population. This means, for instance, that if all respondents make the ‘mistake’ of adding their spouse's AOW to their benefit or confuse their planned retirement age with 65, the scenarios of Table 3 would return RRs of approximately 70% for wage growth rates above zero and below 3%, making the E(RRs) more plausible. This is evident in Table 4. In this table, we show results for the AOW (scenario D) and early retirement rules (Scenario E) misunderstandings when the growth rates of wage is 3%. In general, the RRs are closer to the E(RR). The share of E(RR) above the computed ones drops by about 20% points (columns E(RR) > D and E(RR) > E, respectively) compared with the shares reported in Table 3 when no ‘systematic mistakes’ were made (column E(RR) > A). Only the oldest cohorts, those who are born before 1946, with an RR of about 70%, show smaller differences.
Estimated and E(RR) when respondents would incorrectly apply pension rules (Type 5)
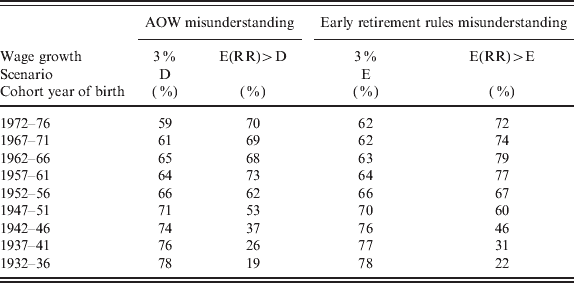
The AOW misunderstanding relates to a misinterpretation of the rules, when the AOW benefit of the partner is added to the one of the respondent. The AOW benefit is transferred to a household and not to individuals, though it depends on household composition and should be shared between partners. The early retirement misunderstanding assumes that respondent may be unaware of the actuarial correction of the retirement benefit due to early retirement. Therefore, those expecting to retire before 65, still accrue their benefit as if they had retired at 65. Compared to Table 3 less respondents now have a computed RR below expectation.
In order to address these three concerns, we analyze the difference between the expected and computed RRs by relating them to the observed characteristics. Higher educated individuals or tenured workers might be better at forming correct expectations compared with poorly educated and inexperienced workers (Gustman and Steinmeier, Reference Gustman and Steinmeier2001). Moreover, those with a good knowledge of pension institutions are more likely to form correct expectations. We can check these elements in a multivariate analysis.
Table 5 reports the results of two specifications of a model with the differences between expected and estimated RRs as a dependent variable. To illustrate our results, we have chosen two specifications with wage growth rates equal to 3% (Type 5 in Table 2). Education, experience and age (these are not linearly related because of employment gaps) are significantly related to the dependent variables in both models. The cohort indicators are also jointly significant. Table 5 suggests that there is a negative relationship between education and experience and that there is a difference between the two RRs (which is always above zero). These negative coefficients are consistent with the existence of a learning process. Age seems to have a counterintuitive positive effect, implying that workers make larger mistakes as they get older. The life-cycle effect that we expected is shown by the cohort/time indicators, which are negatively ordered as expected. Older cohorts report lower mismatches. The extra variables added into specifications (1) and (2) are not always significant with the exception of the indicator for civil servants. These results are plausible, and we use them further to decompose the mismatches derived from different sources.
Multivariate analysis

Model (1) looks at mismatches between expectations and realizations of the RR, when a wage model is used to predict future wage with an index equal to 3%. Model (2) shows similar results, but with less variables and, therefore, also a larger sample dimension.
In general, we find that the overestimation of the RR for low wage-growth rates is larger than zero in almost all scenarios. This overestimation increases with higher indexations and is as severe in the wage equation-based scenarios as it is in those with percentage increases (these results are shown in the companion study). When we allow for the two ‘systematic mistakes’ described above, the overestimation disappears for growth rated of wage up to 3%, but at a rate of 5% the overestimation reappears for most cohorts. This result is less than ideal and not at all conclusive. In this descriptive analysis, we can only state some of the conditions that need to be fulfilled to gain an overestimation rather than an underestimation of the RR. The conditions for an overestimation are, however, much more likely to be met.
4.2 Decomposition and factor analysis
The results above can be used for another purpose. We thus shift our attention from the level of the mismatch, because of the concerns above, to the composition of the mismatch itself. It is interesting to know how a poor knowledge of pension institutions relative to the uncertainty about the future affects the difference between the two RRs (expected minus estimated). With the information available, this question seems empirically impossible to answer. However, if one is willing to make additional (but not directly testable) assumptions, we could estimate these effects. Let us, for instance, assume that we can identify those individuals who know pension institutions and those who do not. Well-informed respondents will only miscompute their RRs if they solve their uncertainty (for instance, about future wages) in a different way to us. This suggests that there is some room for using an Oaxaca–Blinder decomposition where the well-informed group is separated from that ignorant about pension institutions. The effect of the difference in coefficients should pick up that part of the difference in RRs because of poor institutional knowledge. This is an appropriate method only if the division between well-informed and poorly informed people is exogenous.
We do not have an index that scores the likelihood (or level) of the information of individuals in terms of pension and financial matters, so we construct one. We can identify the group of well-informed respondents using factor analysis.Footnote 6 The factors used are personality traits and the answers to the questions related to the pension system. This analysis is used to score individuals on how likely they are to be well informed. Think, for instance, of the responses to the questions or statements such as:
1. ‘I think about how things can change in the future and try to influence those things in my everyday life’
2. ‘I am only concerned about the present, because I trust that things will work themselves out in the future’
3. ‘I am very interested in financial matters (insurance, investments, etc.)’
4. ‘Because of the social security system in our country, there is no need to save money’
5. ‘If you needed it, could you call on one of your relatives for financial advice?’
6. ‘Being careful with money is an important character trait’
All these questions (with the exception of question 5) are answered by choosing a value from 1 to 7, where 1 stands for ‘totally disagree’ and 7 for ‘totally agree’. These questions are asked in most waves, and to maximize the number of factors, we carry out the factor analysis separately each year. Personality traits are exogenous individual characteristics (Borghans et al., Reference Borghans, Duckworth, Heckman and ter Weel2008) that can be used to identify those more likely to be informed about the complex financial mechanisms that will affect their future pensions. This implies that our index is based on exogenous characteristics, as requested in the Oaxaca–Blinder decomposition.
Factor analysis is a useful data reduction tool in this case. The indirect use of all these exogenous variables in a factor analysis is motivated by the idea that none of these variables directly tells us how well informed respondents are, but all variables tell us something about their knowledge of pensions and savings.
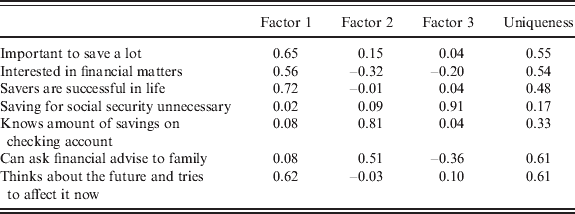
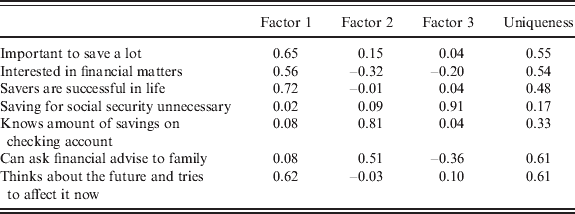
Table 6 shows, as an illustration, the factor loadings for 2002. The analysis retains three factors. The percentage of variance for the variable not explained by the common factors (uniqueness) varies between 17% and 61%. These percentages are typical in the literature. We aim to create an index of ‘likelihood to be well informed’ or ‘attitude toward financial planning’ because we want to spot those likely to have gathered information about their post-retirement incomes. All the variables we use should, therefore, be positively related to the factor. For the first factor, all factor loadings are positive, so we have indeed obtained the attitudinal factor that we were looking for. Factors 2 and 3 also indicate such an attitude, but are negative about interest in financial matters or thinking about the future, which are relevant for determining the attitude of being well informed about pension institutions.
Factor loadings year 2002
The group with a good knowledge of institutions (group A) thus shows ‘mismatches’ (M) only because of uncertainty about future outcomes. Good knowledge is identified by selecting the top decile of the scores predicted by the factor analysis (we experimented with the other quantiles of the score's distributions and the results do not change qualitatively). The rest (group B) has mismatches that are caused by both the ignorance of institutions and uncertainty. Let us further assume that the uncertainty effect is the same across the two groups and that each mismatch can be modeled as:
 $$\eqalign{ Y_{\rm A} \equals \tab X_{\rm A} \beta _{\rm A} \plus \varepsilon _{\rm A} \quad {\rm \lpar uncertainty\ about\ future\ oucomes\rpar \comma } \cr Y_{\rm B} \equals \tab X_{\rm B} \beta _{\rm B} \plus \varepsilon _{\rm B} \quad {\rm \lpar uncertainty\ about\ future\ oucomes\ and\ institutions\rpar \comma } \cr} $$
where Y A and Y B, respectively, represent the mismatches of groups A and B and X are the exogenous characteristics. If E(εA)=E(εB) = 0, the mean outcome difference between the two groups can be decomposed such that:
 $$M \equals X_{\rm A} \beta _{\rm A} \minus X_{\rm B} \beta _{\rm B} \equals \lpar X_{\rm A} \minus X_{\rm B} \rpar \beta _{\rm B} \plus \underbrace {X_{\rm B} \lpar \beta _{\rm A} \minus \beta _{\rm B} \rpar }_{{\rm effect\ institutions}} \plus \lpar X_{\rm A} \minus X_{\rm B} \rpar \lpar \beta _{\rm A} \minus \beta _{\rm B} \rpar .$$
The difference in coefficients should then show how much of the mismatch is exclusively because of poor institutional knowledge. Two implicit assumptions are being made here. The first is that the wage-related mismatch of group A can be ‘subtracted’ from that of group B. There is no reason to think a priori that those who know pension institutions make the same ‘systematic mistakes’ in wage predictions as individuals with a poor institutional knowledge.Footnote 7
The second assumption requires that E(εA)=E(εB) = 0. There are a number of reasons to doubt this assumption. An easy example is that observable characteristics, education for instance, could be related to whether one belongs to group A or group B. One could speculate (and even test) whether individuals with a higher education are better informed about institutions. Oaxaca–Blinder decompositions usually take gender into account. Gender is a purely exogenous characteristic, whereas being informed about institutions is evidently not. Stated differently, selection in groups A and B might be endogenous. This is why we use factor analysis based on personality traits, because this allows for the exogenous identification of the well informed and relaxes the concerns about the second assumption.
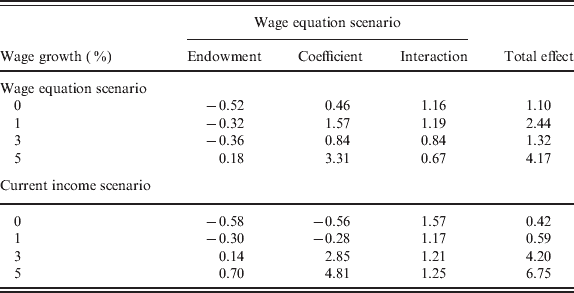
Table 7 reports some of the decompositions that are based on several specifications of the model that is in turn related to scenario types 2 (which has not been presented so far) and 5. The total effect returns the difference between the two RRs with wages growing at different rates. The interesting result is that for low rates, coefficients and endowments contribute similarly to the total effect. When the growth rate is higher, coefficients increase their shares of the total effect. Ignorance about pension institutions thus systematically enlarges the gap between expected and computed RRs. This means that when the mistake is larger, it is mostly explained by ignorance about pension institutions.
Oaxaca blinder decomposition of the difference between expected and computed RR

Explanatory note: the two sets of results are an illustrative sub-sample of specifications based on a wage equation (upper panel) or current income (lower panel), to fit missing income records. We interpret the difference in coefficients as the effect due to poor knowledge of pension institutions.
Explaining this result is not straightforward. We need to establish the empirical link between higher growth rates and larger mismatches in order to explain it. However, there is no theoretical model that links these rates to the knowledge or pension institutions directly. A possible avenue to interpret this result is resorting to empirical evidence of financial literacy. Alessie et al. (Reference Alessie, van Rooij and Lusardi2011) show that many respondents in their survey are not able to engage in the computations needed to properly apply indexation rules, as they are not familiar, for instance, with the concept of compound interest. Inability to compound could be connected with the understanding of pension institutions and the rules of wage growth and indexation that we apply. As this is a positive analysis, we limit ourselves to showing the finding and only suggest a possible avenue for explanation that our descriptive analysis supports.
One main remark about these results is that the E(RR) could internalize other income streams. If a reform reduces benefits to early retirees, these people might voluntarily save at present in order to increase income in the future. Recent research has specifically tested this and concluded that only approximately 20% of Dutch employees have private pensions and personal savings that would allow them to purchase an annuity. This annuity is then, on average, low and unable to compensate for the drop in retirement income because of recent reforms if planned retirement age does not increase (Mastrogiacomo and Alessie, Reference Mastrogiacomo and Alessie2011).
5 Summary
In this paper, we studied the relationship between the individual expectations of retirement RRs in the first and second pillars at the planned retirement age and the estimated RR at the same age. As a study case, we analyzed the Netherlands because panel data were available for these variables and because the institutional changes currently being discussed in many countries have already been implemented there.
Bottazzi et al. (Reference Bottazzi, Jappelli and Padula2006) show that Italians expect higher RRs compared with the rates they will eventually receive. We showed that this is mostly also the case in the Netherlands, but we also showed that this result can be generated by ad hoc assumptions, even though it is very likely to hold. The assumptions needed to make the E(RR) closer to our computations are for instance discounting wages into the computation of the future benefit to a rate that is much lower than the growth rate of wages itself, assuming a higher RR for early retirement (increasing the nominator of the RR), or assuming wages constant prior to retirement (lowering the denominator of the RR).
We have checked the sensitivity of the results to assumptions about indexation, wage development and institutional rules. Further, we found that lower RRs can occur because of both lower than expected pension benefits and higher than expected pre-retirement income. In line with the literature, we found evidence that better education and more work experience results in smaller differences between expected and estimated RRs. We also found evidence that most of the overestimation is because of ignorance about pension institutions. The origin of the mismatch is relevant for deciding whether policy intervention is needed or not.
Our results suggest that specific policies should be addressed to increase the pension awareness of current retirees. The inability to correctly anticipate the drop in income upon retirement may otherwise interfere with current saving decisions. Combining our results with other results in the literature, we conclude that the most effective way to increase future RRs is to postpone the (planned) retirement age.
Appendix 1 Application of pension institutions on the data
In our computations, we highlight the institutional shift in 2004 (from a final salary to an average wage system). To appreciate the conceptual difference between these two main programs, see the following pension formula for those planning to retire at 65:
 $$\left\{\openup6 {\matrix{ {B_{\setnum{65}} \equals \lpar O_{\setnum{65}} \lowast a_{\setnum{65}} \rpar \lowast \lpar w_{\setnum{64}} \minus f_{\setnum{64}} \rpar \plus {\rm AOW}_{\setnum{65}} \comma }\hfill \tab {{\rm if}\;{\rm year} \lt {\rm 2004\comma }} \cr {B_{\setnum{65}} \equals \mathop{\sum}\limits_{t \equals \setnum{2004}}^{\setnum{2004} \plus \setnum{65} \minus {\rm age}} {\hat{a}_{t} \lowast \lpar w_{t} \minus \hats{f}_{t} \rpar } \plus {\rm AOW}_{\setnum{65}} \comma } \tab {{\rm if\ }{\rm year}\ges {\rm 2004}{\rm .}} \cr} } \right.$$
This expression abstracts from individual discounting and (for now) indexing. The reason for this is that we simply attempt to mimic the computations performed by pension funds to estimate future benefits,Footnote 8 not to estimate a life cycle model. B is the benefit at retirement age, O is the amount of years that one has contributed into the system and a is the accrual rate (which also differs before and after 2004). Note that in the data we have information on O and unemployment spells. Income enters the formula as the difference between the wage (w) and the exempted part of the wage (f). The wage is adjusted over time using different wage growth rates. AOW is the flat old age benefit, age represents current age in each period and t is a time indicator.
It is helpful to shift to an age (rather than time) indicator to explain our computations further. For those expecting to retire before 65, we use a somewhat simplified early retirement benefit computation, depending on the age at which they expect to retire (τ). This is:
 $$\eqalign{B_{\tau } \equals \left( {{{\overbrace {v \lowast \sum\limits_{j \equals \tau }^{\setnum{64}} {e_{j\comma p} \lowast w_{\tau \minus \setnum{1}} \lowast \left( {\textstyle{1 \over {1 \plus r}}} \right)^{j \minus \tau \plus \setnum{1}} } }^{{\rm early\ retirement}} \plus \overbrace {\sum\limits_{j \equals \setnum{65}}^{T} {B_{j} } \lowast \left( {\textstyle{1 \over {1 \plus 0.8r}}} \right)^{j \minus \setnum{65} \plus \setnum{1}} }^{{\rm retirement}}} \over {\lpar T \minus \tau \rpar \lowast \left( {{1 \over {1 \plus r}}} \right)^{j \minus \setnum{65} \plus \setnum{1}} }}} \right)\lowast \lpar 1 \minus s_{j\comma c} \rpar \comma$$
where j is the age indicator. Some individuals are entitled to an early retirement benefit (v=1). The formula includes an age- and pension fund (p)-dependent RR (e) computed for each main Dutch pension fund (Euwals et al., Reference Euwals, van Vuuren and Wolthoff2005) that allows imputing the early retirement benefit using the last earned wage (w), this being the simplification mentioned above. In the benefit calculations past earnings are brought up to current value using an index (r); survival probabilities (s) that are cohort (c)- and age-dependent are also included. This means that although r is not time-dependent itself, we include this dependence by multiplying the survival probabilities into the formula. s is derived from CBS mortality tables and survival projections for all cohorts of Dutch citizens. Pension benefits are then used to compute the RR:
 $${\rm RR}_{it} \equals {{B_{i\comma \tau } } \over {E_{t} \lpar w_{i\comma \tau \minus \setnum{1}} \rpar }}\comma $$
where both the benefit and wage are expressed in net terms and i indicates the respondent. The expected wage in t is related to the year before expected retirement (τ − 1) with the discount r using the survival probabilities s. By combining equations (2) and (3), we see the effect of r on RR.
As mentioned before the wage and price index are similar. Thus, indexing accounts at the same time for adjustments because of inflation and the rate of productivity growth.Footnote 9 These two variables are conceptually different, and thus ignoring this difference may seem odd. However, the development of these two variables over the sample period was very close (with the notable exception of the crisis year 2001). In addition to pension funds sending out their prospects, they also use only one index and do not separately correct for productivity growth. Indexation is needed in order to account for the differential development of wages and benefits (see below). Indexed benefits are needed in order to compute a proxy for pension wealth. Note that the nominator of equation (A.2) is affected by the choice to retire early. If R < 65, the nominator will include more years of benefits at a lower level of indexation. This is because r affects only a part of the nominatorFootnote 10 (pension wealth), namely 80%, but the denominator is fully indexed.
This is the same rule used in the CPB model for purchasing power. Pensions and benefits are normally linked to prices, while income is linked to wage growth; the increase in prices was approximately 80% of the increase in wages over the sample period.Footnote 11 Note that an indexation of pensions by 80% is a rule of thumb, because pension indexation is not compulsory in the Netherlands. Adjusting to inflation is an ambition of the largest funds. However, starting in 2009 pensions are no longer indexed and in 2013, these will be lowered (negative indexation) as a result of the conjuncture.
When r increases, the denominator increases more than does the nominator, thereby RR decreases. A higher r also increases the difference in RR between young and old cohorts. The elderly are closer to τ and they index fewer years of employment and (partially) index many more years of retirement. The youth, on the contrary, (fully) index approximately the same number of years before retirement (which makes the denominator of RR relatively larger as r increases) and after. As r increases, the RR of the youth becomes lower relative to that of the elderly.
Given this, we can speculate on the potential effect of separately accounting for the differential effect of productivity growth and price indexation. Higher productivity would translate into higher salaries, now and in the future. This positive effect would be larger for the youth, as they have more unrealized incomes before reaching retirement. This would exacerbate the relative difference in pensions for this cohort, possibly lowering further the RR. A similar but somewhat more limited effect would take place for older cohorts. Testing this is however complicated, as we do not have data on expected productivity growth.
In the yearly pension prospects, pension funds estimate B on the basis of guesses regarding τ. Compared with pension funds, we have extra information, namely E(τi), E(RRi) and some clues about E(wt,i). Since we aim to compute RR(E(τi)), we assume that τi is the expected retirement age. We proceed as follows. We observe Ot and assume that respondents do not expect to change their labor supply. This means that each extra year separating the individual from retirement will increase seniority by one year. The accrual rate a is assumed to stay constant at the current level at = a τ. Next, AOWτ and f τ are legislated amounts that are affected by several factors. These factors are indexations to either prices, wages or political decisions (minimum wage freezes, for instance). In the sample period, standard wage indexation picks up most of the evolution of these amounts over time and, therefore, we have conveniently indexed them at approximately 3% (2% indexation and 1% productivity).
Appendix 2
We use a panel data model to estimate the wage equation (see Table A.1). The relevant feature of the model is that the vector x includes individual characteristics and age splines. This is important to project incomes forward and backward. The model is:
 $$\eqalign{ y_{it} \equals \tab \alpha \plus x_{it} \beta \plus \nu _{i} \plus \varepsilon _{it} \quad i \equals 1\comma \ldots \comma N{\rm \semi }\quad t \equals 1\comma \ldots \comma T_{i} \comma \cr \varepsilon _{it} \equals \tab \rho \varepsilon _{i\comma t \minus \setnum{1}} \plus \eta _{it} {\rm .\ } \cr} $$
Wage equation used to impute future income