I. INTRODUCTION
As a new and efficient energy storage device, supercapacitors have attracted more and more attention.Reference Xiong, Li, Hou and Yang1–Reference Loordhuswamy, Krishnaswamy, Korrapati, Thinakaran and Rengaswami4 The selection of its electrode materials is one of the important reasons to limit its popularization. However, nanomaterials have attracted much attention due to their large specific surface area and surface effect. Moreover, carbon nanofibers (CNFs) have their unique advantages as negative electrode materials, not only for their characteristics of nanomaterials, but also the unique excellent properties, such as lower density, larger specific capacity, unique conductivity, and thermal performance.
In the past period of time, study on CNF production and applications becomes a hot topic in both academic and industrial world. The potential applications of nanofibers have also attracted the urgent demand for low-cost and mass production of high quality nanofibers.
Gyration, which have been developed very quickly in recent years, were reported to be successful in the production of micro- and nanoscale fibers.Reference Hammami, Krifa and Harzallah5–Reference Heseltine, Ahmed and Edirisinghe10 Compared to common electrospinning, the gyration method can avoid the related safety problems because it does not use high-voltage electric field. Besides, the high rotational speed can effectively improve the fiber production rate by two to three orders of magnitude and reduce the production cost. Moreover, a pressure control device has been developed and added to the gyration equipment, and small diameter fibers can be prepared.Reference Sun, Du, Zhang, Zhou, Chen and Liu11–Reference Chen, Wei, Gong, Lv, Xu, Hu and Du14
In general, the behavior of polymeric materials is time, temperature, and pressure-dependent. Therefore, the nanofiber morphology and structure are significantly dependent on the polymer concentration and the chemical structure of the polymer used to prepare the nanofiber precursor. Polyacrylonitrile (PAN) is a well-known polymer with good stability and mechanical properties. PAN nanofibers can be potentially applied into multiple fields including tissue engineering, sensing, composites, battery separators, and precursors for producing carbon nanotubes (CNTs). Among the various applications, the most important role of PAN nanofibers is the precursor for producing CNTs due to its high carbon yield and flexibility for tailoring the structures of resultant CNTs.Reference Deng, Liu, Li and Huang15–Reference Agyemang, Tomboc, Kwofie and Kim17
However, there are still some problems in using PAN-based CNFs to prepare electrode materials. For example, the relatively low crystallinity makes the electrical conductivity still to be improved. Therefore, it is particularly important to use some low cost and high conductivity additives. Due to the low cost and high conductivity of CNTs, it has received widespread attention. Besides, Ra et al.Reference Ra, An, Kim, Jeong and Lee18 studied the electrical properties of PAN-based CNFs modified by CNTs and found that the conductivity of CNFs increased significantly with the increase of CNT content. The results show that the conductivity of CNFs are only 4.9 S/cm without CNTs, but it increases to 35 S/cm when the content of CNTs is 10%. Kshetri et al.Reference Kshetri, Tran Duy, Singh, Kim and Lee19 studied the in situ growth mechanism and properties of CNTs in nanofibers. Zhou et al.Reference Zhou, Jin, Zhou and Zhu20 discussed the structural morphology and electrical conductivity of CNTs. However, there are relatively few reports on the electrochemical properties improvement of CNT reinforced CNFs.
In this study, CNTs were used as additives to study their effects on the morphology and electrochemical properties of CNFs. The aim of adding CNTs is to solve the problems of poor crystallinity and low conductivity of PAN-based CNTs, so as to improve the electrochemical properties of CNFs, such as the specific capacitance of charge/discharge process.
II. EXPERIMENTAL
PAN (homopolymer, Mw = 150,000) purchased from Beijing Bailingwei Technology Co., Ltd. (Beijing, China) was chosen as the precursor. N,N-Dimethylformamide (DMF) was selected as the solvent to dissolve PAN. CNTs purchased from Suzhou Carbon Feng Graphene Technology Co., Ltd. (Suzhou, China) were added as additive. The pipe diameter of the CNTs is about 20–50 nm, and the length is in the range of 200–500 nm. Polyvinylidene fluoride (PVDF), Na2SO4, and KCl purchased from Beijing Bailingwei Technology Co., Ltd. (Beijing, China) were used to prepare electrode plates and electrolyte solution.
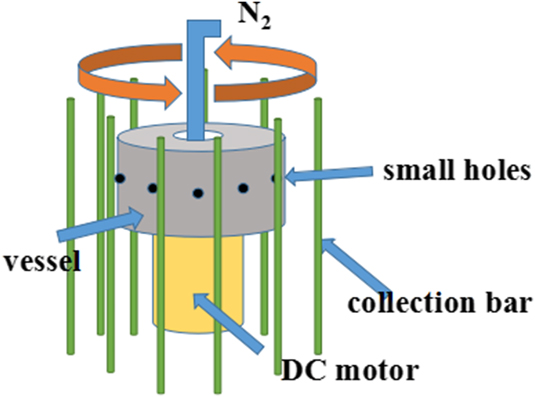
The PAN solution was prepared with a concentration of 10 wt% in DMF and then divided into three parts. Additives were added to the three PAN solutions to fabricate spinning solutions with different concentrations of CNTs 0, 0.25, and 0.50 wt%, respectively. The prepared three spinning solutions were placed on the magnetic mixer, stirring for 12 h to clarify the solution. Next, the solutions are ultrasonically dispersed for 30 min to get the final spinning solution. The prepared PAN/CNTs solution was placed in a spinning vessel, as shown in Fig. 1, and then ejected from the small holes on the wall of vessel with a high rotating speed, thus the composite fiber formed in the case of evaporation of solvent DMF meanwhile. At the same time, the pressure device will add nitrogen at 0–0.2 MPa pressure. The formed PAN/CNT fibers with different concentrations of CNTs 0, 0.25, and 0.50% were labeled as samples C(1), C(2), and C(3), respectively. Then, the PAN/CNT fiber was placed in an oven to dry for 30 min at 70 °C. The dried fibers are heated to 280 °C at a rate of 2 °C/min and maintained for 2 h at the final temperature for pre-oxidation. The pre-oxidation sample was heated to 800 °C at a rate of 5 °C/min and kept for 2 h for carbonization in argon atmosphere.Reference An, Ahn and Hong21–Reference Zhang, Yang, Guo, Zhao, Gong, Du and Zhang25 The composition and microstructure of prepared nanofibers were investigated by X-ray diffraction (XRD), scanning electron microscopy (SEM), Fourier transform infrared spectroscopy (FTIR), and transmission electron microscopy (TEM). The fiber diameter distribution map is based on the statistics of 100 fibers using ImageJ software. The electrochemical properties of the samples were characterized on an electrochemical workstation, including cyclic voltammetry and constant current charge/discharge test.
Principle of pressurized gyration.

To test the electrochemical performance of the sample, the electrode sheet which can be tested was prepared. Main operation steps are as follows: (i) The foam nickel cut into 1 cm × 3 cm piece was put into ethanol, and then placed in an ultrasonic cleaning machine for cleaning; (ii) The carbon fiber, conductive carbon black, graphite, and PVDF were mixed according to the mass ratio of 8:0.5:0.5:1. 1-methyl-2 was added as adhesive to make the solution mixed evenly in the quartz crucible; (iii) The Na2SO4 solution of 500 mL 0.5 mol/L and the appropriate amount of saturated KCl solution were used for testing. Electrochemical tests used three electrode systems: cathode material as the working electrode, blank nickel plate as the counter electrode, and saturated calomel electrode as the reference electrode.Reference Hu, Zhang, Zhang, Zhang, Sheng and Gu26–Reference Chen, Xu, Yang, Zhou, He, Chen, Li, Shi, Hou and Kuang31 The test was carried out with an electrochemical workstation CHI1604B.
III. RESULTS AND DISCUSSION
A. Phase analysis of CNTs
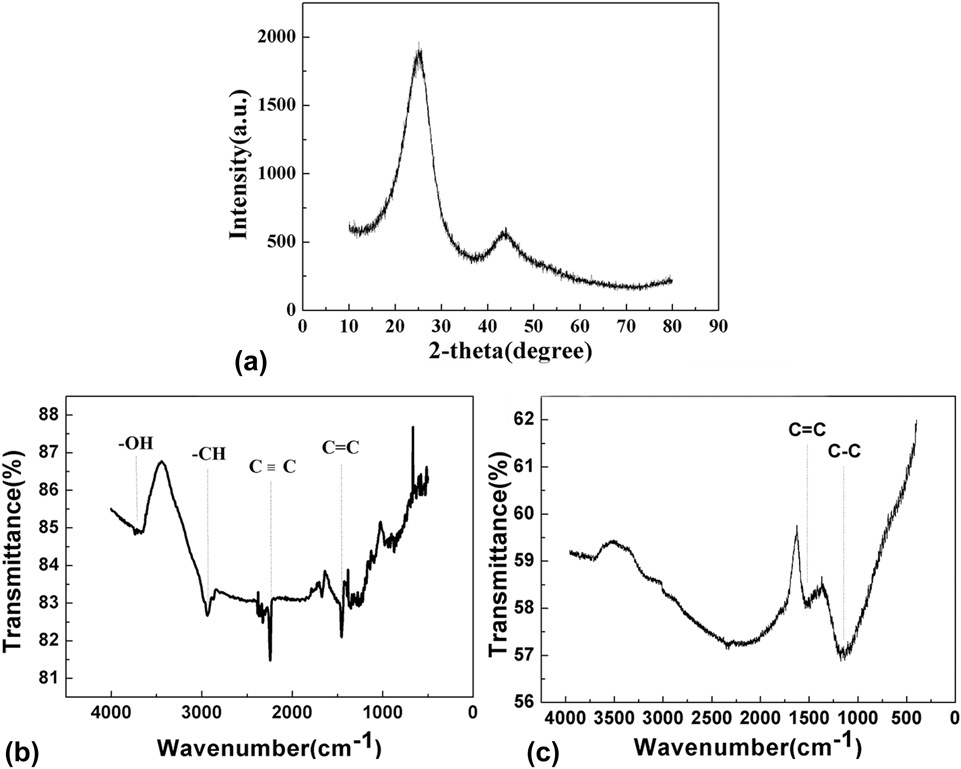
Figure 2(a) shows XRD patterns of CNFs which were selected for the crystalline investigation. Two distinct characteristic peaks at 26° (002) and 44.5° (101) could be found in Fig. 2, compared with the XRD standard card (#75-1621). The intensity of these two peaks was not too high, and the peak width was very large, which indicated that the crystallinity of CNFs is not high. Based on the analysis of the background morphology of the whole steamed bread, we can conclude that the carbon fiber obtained is amorphous carbon structure. However, poor crystallinity will lead to poor electrical conductivity of CNTs, thereby reducing their electrochemical properties. Therefore, it is particularly important to solve the problem of poor conductivity of samples.
The XRD patterns and FTIR spectrum of samples [(a) XRD pattern of CNFs; (b) FTIR spectrum of samples before carbonization; (c) FTIR spectrum of samples after carbonization].

Figures 2(b) and 2(c) present the FTIR patterns of carbon fiber before and after carbonization. In Fig. 2(c), it can be seen that C–C bond and C=C bond stretching vibration appeared in nearby 1200 cm−1 and 1640 cm−1, respectively. This result showed that there are only C–C bond and C=C bond exist inside carbon fiber. Moreover, it was indicated that C–H, C≡C, and –OH bonds in the PAN/CNT fibers had already disappeared after the carbonization process.Reference Liu, Lu, Huang, Sun, Yu, Evariste, Jiang and Yao32–Reference Hajalilou, Etemadifar, Abbasi-Chianeh and Abouzari-Lotf36
B. Morphology and diameter distribution of the CNTs
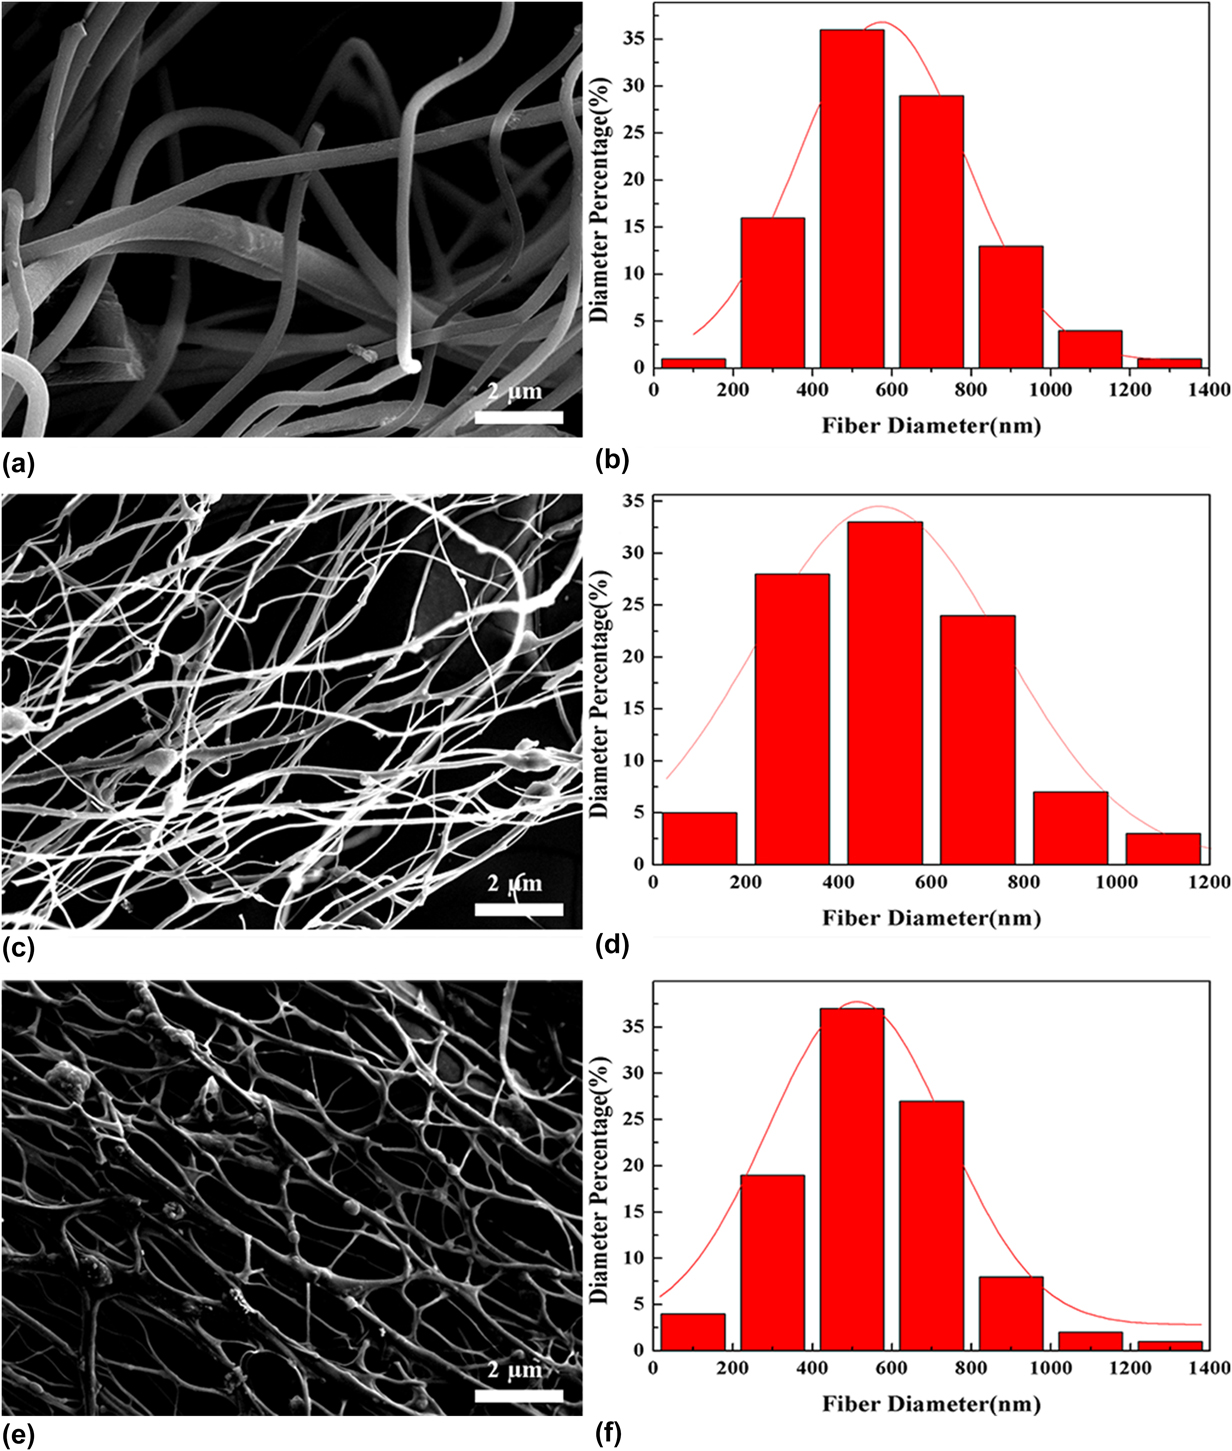
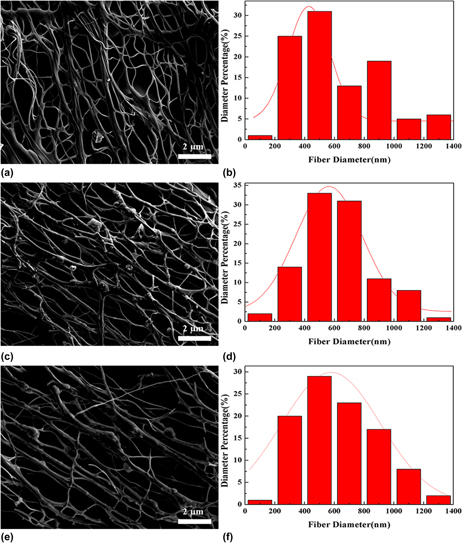
It can be seen in the SEM images of CNFs with different additive contents and without working pressure in Fig. 3 that the CNFs with CNTs exhibit a network structure. The network structure can improve the conductivity of CNFs significantly. Meanwhile, CNTs has a unique microstructure and excellent electrical properties, so it can be inferred that the electrochemical performance will be improved. Besides, the addition of CNTs does not affect the fiber yield, and the yield was still near 5 kg/h. Due to the special structure of the CNTs, when the CNFs were added as an additive, the surface of the CNFs could form a large number of defect centers. The formation of this structure makes it easier to capture electrons so that when forming an electric double layer capacitor structure can store more electrons and have a larger specific capacitance. The formation of the network structure is due to the new disturbance of CNTs attached to the fiber surface as additives during the fiber forming process. Besides, new disturbance have been introduced, making the balance more easily broken, resulting in interactions during fiber formation that crosslink together to form a network.Reference Lei, Ni, Chen, Gu and Zhang37–Reference Patil, Ahn, Yu, Song, Jeong, Kim and Ahn39 Besides, it can be seen from the Fig. 3 diameter distribution diagram that the diameter distribution exhibits a distinct near-normal distribution, wherein the range of the largest average number of diameters is relatively stable at 400–800 nm.
SEM images and diameter distribution of CNFs (Figures a, c, e and b, d, f are SEM photographs and diameter distribution of C(1)–C(3), respectively).

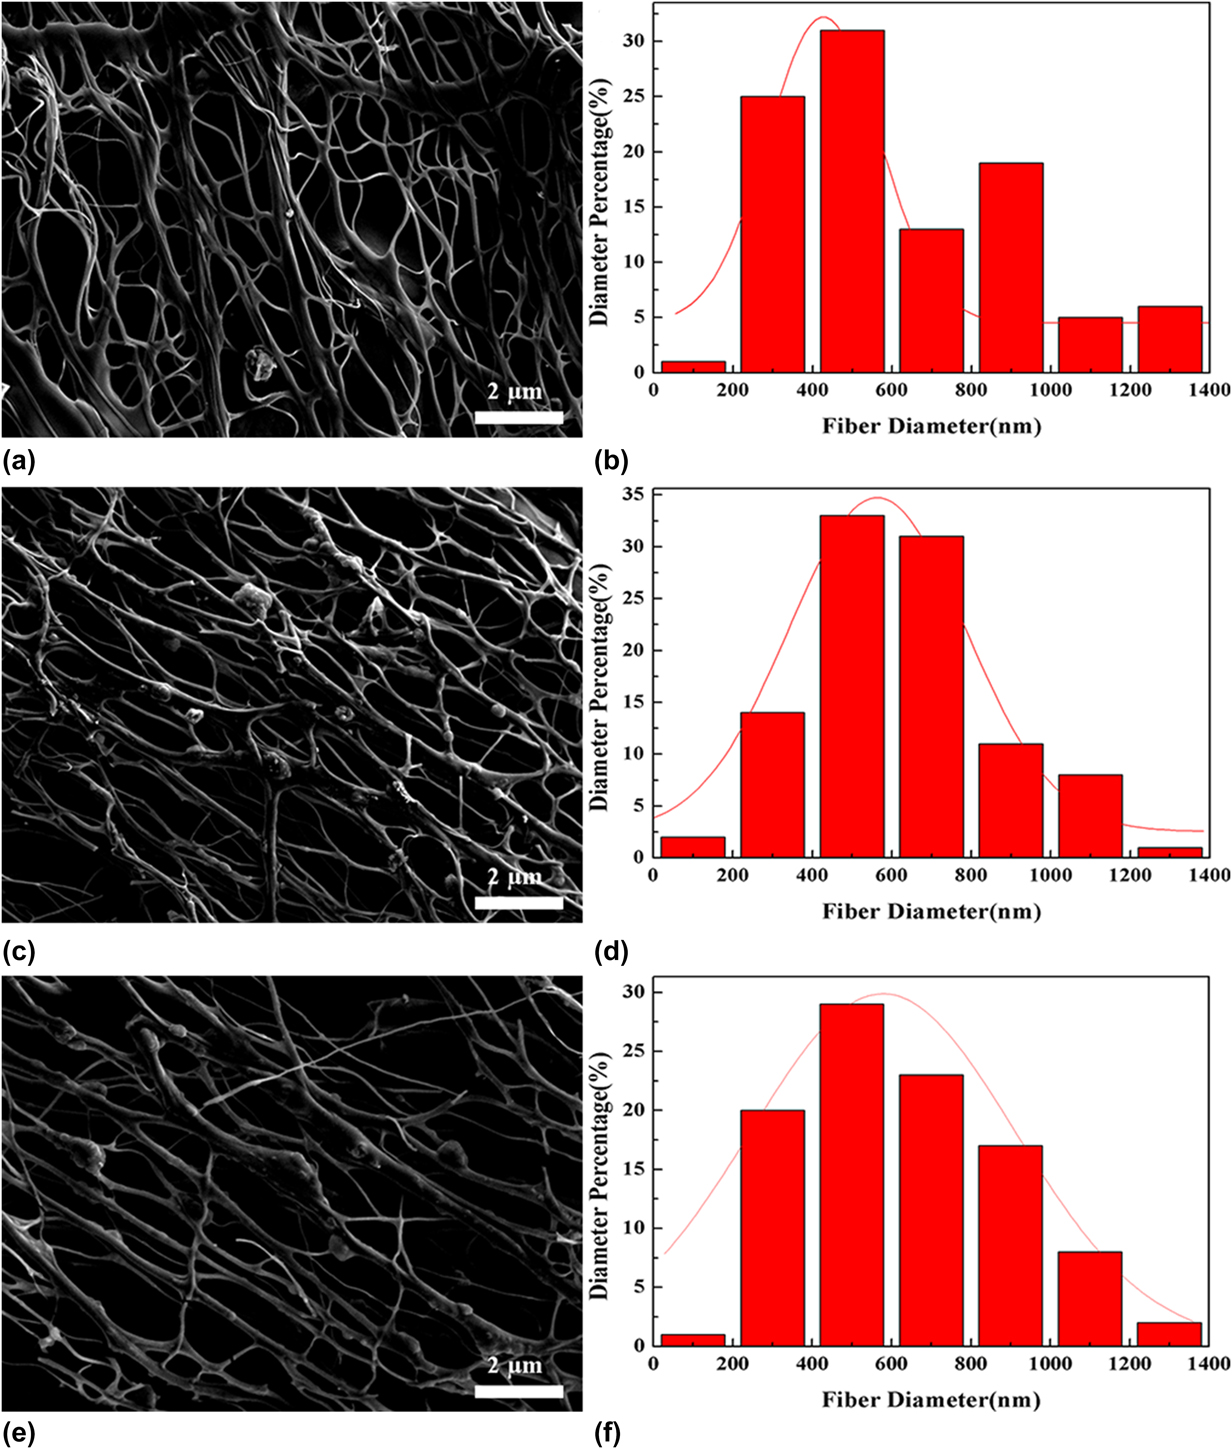
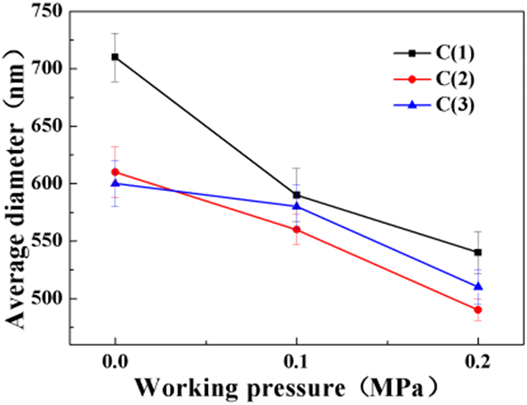
Figure 4 represents a scanning electron micrograph, diameter distribution diagram, and the effect of average diameter on working pressure of C(3) CNFs under different working pressures. After the working pressure is increased, it can be seen from the SEM photograph that the uniformity of the fibers is better than that of the nonaddition as the working pressure is added. It can also be seen in Fig. 4(e) that some of the CNFs break off. The reason for this phenomenon can be that some of the CNFs were break destroyed by an air flow when working pressure reaches a high value of 0.2 MPa. The average diameter of CNFs added with CNTs as a function of working pressure. It can be concluded that the average diameter of the CNFs decreases with the increase of the working pressure, and the group with the lowest fiber diameter is the C(2) group, and the average diameter is 470 nm.
SEM images and diameter distribution of CNFs (Figures a, c, e and b, d, f are SEM and diameter distribution of C(3) at 0–0.2 MPa working pressures, respectively).

Figure 5 shows the average diameter and graph of CNFs. It can be concluded that as the spinning pressure increases, the average diameter of CNFs decreases, and the average diameter of the C(1) group decreases from 730 nm to 550 nm. The group with the lowest fiber diameter is the C(2) group with an average diameter of 470 nm. In the C(3) group with the most added amount, the average fiber diameter was not significantly reduced. The reason for this result is that the more the amount of addition, the more the fibers form a network structure so that the effect of increasing the spinning pressure on the reduction of the average fiber diameter is reduced.
Average diameter of CNFs in groups C(1)–C(3) at different working pressures.

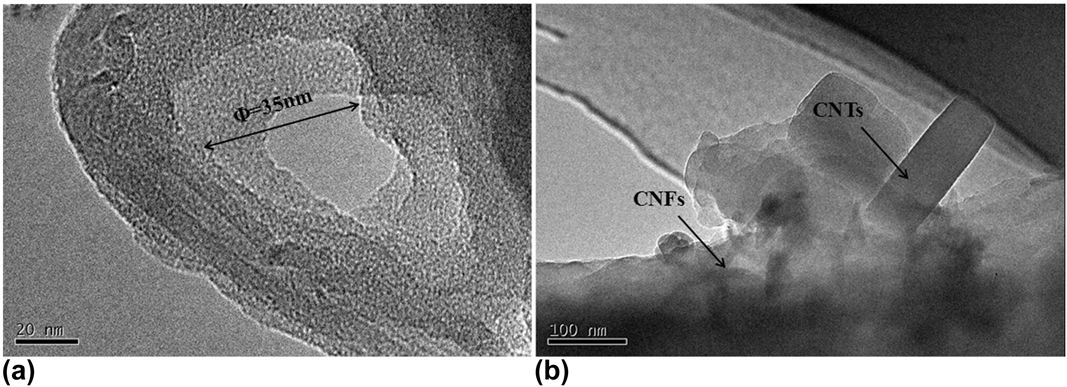
It can be seen from the TEM images of CNTs in Fig. 6(a) that the tube structure and tube mouth of CNTs is clearly visible with a mean diameter of about ∼35 nm. However, the shape of tube mouth is not a standard hexagon. The reason for this phenomenon can be that carbon atoms in CNTs are mainly combined with sp hybridization, and the hexagonal grid structure of the tube mouth has a certain degree of bending, forming a spatial topology. These topological defects change the helical structure of CNTs and the electronic band structure near the defect, which makes it difficult to form a regular hexagonal structure. As for the TEM image of CNFs, it can be seen in Fig. 6(b) that the CNTs are successfully embedded inside the fibers, and the CNTs can be observed easily as the edges of fibers are thinner. Besides, the formation of network structure shown in the SEM images is also closely related to the addition of CNTs. Because CNTs are initially adhered to the surface of the fiber when they are formed, and then gradually embedded into the CNFs after high temperature carbonization, and finally the network structure formed.
TEM images of CNTs and CNFs [(a) CNTs; (b) CNFs in group C(3)].

C. Electrical conductivity of the CNTs
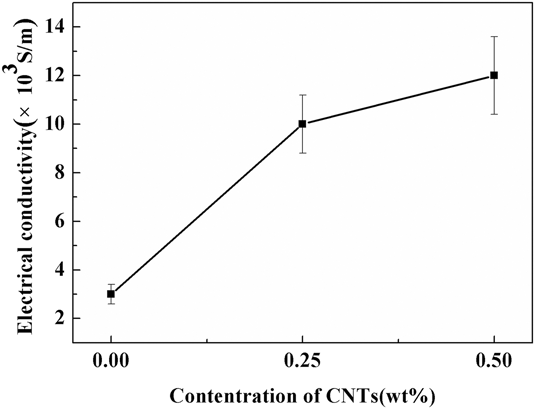
Figure 7 is a graph showing the electrical conductivity of CNFs prepared without working pressure. It can be seen from the diagram that the electrical conductivity has been greatly improved, which is consistent with the speculation before experiment. However, with the further increase of the amount of CNTs, the effects of CNTs on the electrical conductivity become unobvious. The explanation for this phenomenon could be that when CNTs are introduced, the fibers form a network structure, which can improve the conductivity obviously. However, the network structure is not changed when the amount of adding is increased, so the promotion effect is not obvious. Moreover, these results were consistent with those obtained by SEM.
Electrical conductivity of CNFs with different CNTs contents.

D. Cyclic voltammetry properties of the CNFs
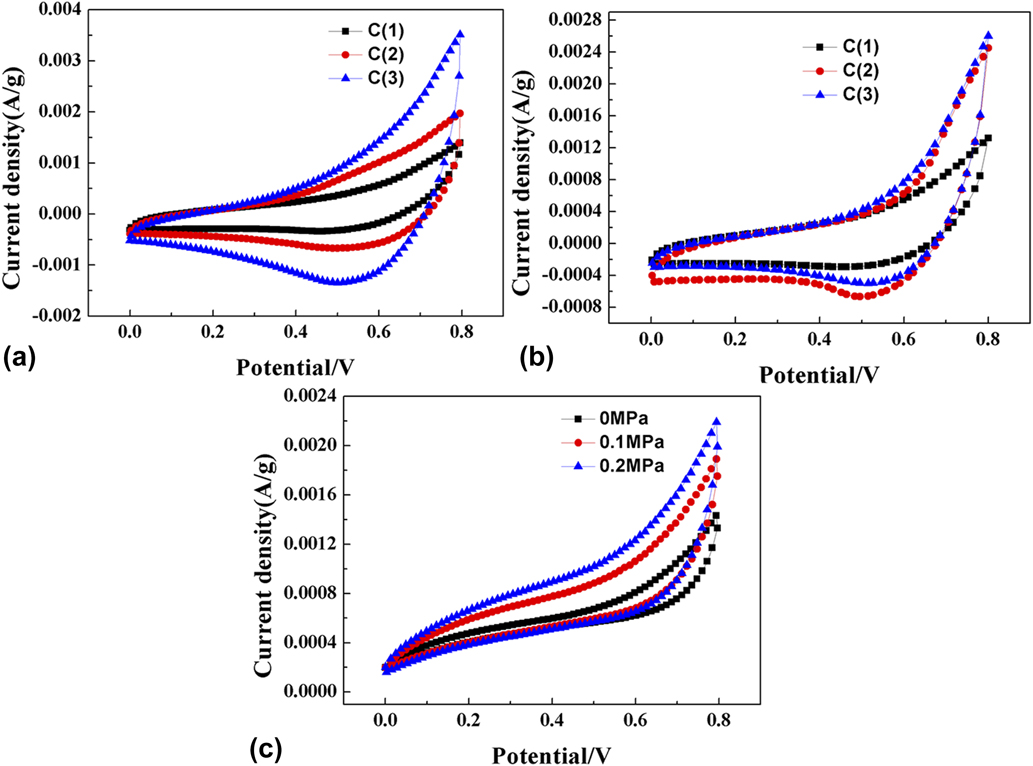
In Figs. 8(a) and 8(b), it can be seen that the CNFs have the capacity of capacitance in the 10 mV/s and 100 mV/s scan rate. The ideal electrode materials can form double layer rapidly and evenly in the topography of the electrode/electrolyte interface. When the voltage scanning direction was changed, the current can reach steady state rapidly. Therefore, the cyclic voltammetry curve of the ideal electrode material is shown as a rectangular. Under the 100 mV/s scan rate, the integral area of the cyclic voltammetry curve of the sample C(3) is larger than others. That is to say, the more the amount of CNTs are added, the larger the surface area of the fiber and specific capacitance. However, the integral area contained in the curve is larger at low scan rate than at high scan rate, indicating that the electrode performs better at low scan rate. Figure 8(c) shows that the specific capacitance increases with the increase of spinning pressure at 10 mV/s scanning rate, but the increase is not obvious. The reason for this phenomenon is the increase of spinning pressure, which mainly makes the fiber diameter decrease to increase the specific surface area of the fiber, thus increasing the defect of trapped electrons to improve the conductivity. The appearance of the network structure makes the conductivity of the fiber greatly improved, and the effect of reducing the fiber diameter is not obvious.
Cyclic voltammetry of CNT modified CNFs at different scan rates [(a) 10 mV/s; (b) 100 mV/s; (c) 10 mV/s].

E. Constant-current charge/discharge performance of the CNFs
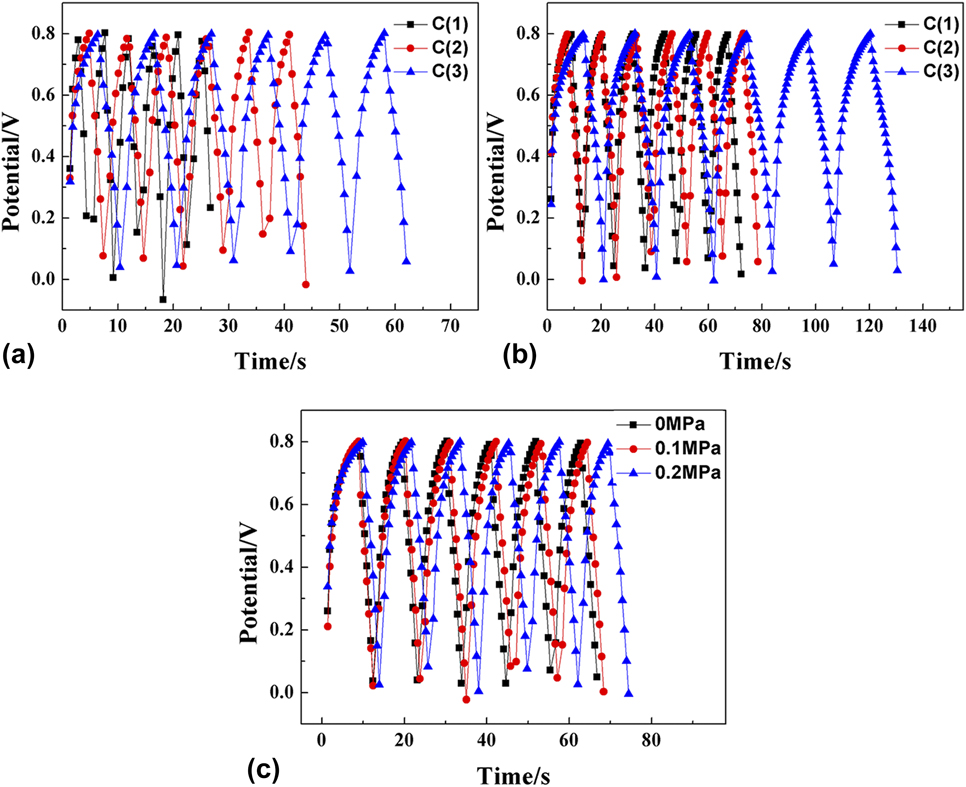
In the constant-current charge/discharge curves of Figs. 9(a) and 9(b), the CNFs show a more regular triangle distribution with a current density of 100 mA/g and 200 mA/g, indicating that the electrode has a good reversibility. In the condition of constant-current charge/discharge, the linear relationship between voltage and time has clear linear relation because of the double electric layer. It can be seen from Figs. 9(a) and 9(b) that the charge and discharge times of the C(1) and C(2) groups are not much different at a current density of 100 mA/g because the amount of nanotubes is too small to improve the performance greatly. When the amount of addition is increased, the charge and discharge time is further improved, and the specific capacitance is also increased accordingly. Figure 9(c) is a graph of constant current charge and discharge of C(3) CNFs at a current density of 100 mA/g under different spinning pressures. As can be seen from that, when the spinning pressure is raised, the charge and discharge time are increased. It was calculated that the specific capacitance of the C(3) group CNFs was the highest at a spinning pressure of 0.2 MPa.
Constant current charge–discharge performance curve of CNT modified CNFs at different current densities [(a) 100 mA/g; (b) 200 mA/g; (c) 100 mA/g].

As we know, specific capacitance can be calculated according to the following formula:
 $$C = i \times {{\Delta t} / {\left( {\Delta V \times m} \right)}}\quad ,$$
where C represents the single electrode specific capacitance of CNFs; i indicates the discharge current density; Δt represents the discharge time; ΔV is the actual discharge potential drop; m represents the mass of CNFs.
The results of the specific capacitance of different CNF samples C(1)–C(3) under different spinning pressures at different current densities are presented in Table I. It can be seen that the specific capacitance of CNFs with PAN as the precursor are just about 56 F/g and 53 F/g at current densities of 100 mA/g and 200 mA/g, respectively. However, with the addition of CNTs, the specific capacitance of the samples increased significantly. When the dosage is 0.50 wt%, the specific capacitance reaches about 73 F/g and 72 F/g at current densities of 100 mA/g and 200 mA/g, respectively. Moreover, when the spinning pressure increases further, the specific capacitance of the sample increases slightly again, reaching about 79 F/g and 76 F/g at current densities of 100 mA/g and 200 mA/g, respectively. Compared with the increase of the addition amount, the increase of spinning pressure has no obvious effect on the specific capacitance of the sample, which is consistent with the previous analysis. Compared with the 45 F/g CNTs prepared by An et al.Reference An, Ahn and Hong21 by embedding platinum to enhance the specific surface area of CNFs, the CNT reinforced CNFs prepared in this experiment have better performance. However, compared with the 99 F/g obtained by Stoller et al.Reference Stoller and Ruoff40 using graphene as the electrode material, there is still a certain gap in the experimental results. But, compared with the pure graphene electrode, the cost of the electrode prepared by using the cheaper PAN-based CNFs as the matrix and the CNTs as the additive is much lower.
Specific capacitance of carbon fiber at different current densities.

IV. CONCLUSIONS
In this work, CNFs were prepared successfully by pressurized gyration and the subsequent carbonization with PAN as the precursor and CNTs as additives. The microstructure and morphology of CNFs were investigated by using XRD, FTIR, SEM, etc. The results showed that the crystalline of carbon was amorphous and only C–C bonds existing in the CNFs. The average diameters of CNFs reached the minimum 490 nm, in the case of CNT concentration is 0.50 wt% and working pressure is 0.2 MPa. Moreover, the network structure observed in the CNFs gained the best electrochemical performance, and the specific capacitance reached 79 F/g and 76 F/g at current densities of 100 mA/g and 200 mA/g, respectively. The specific capacitance increased by about 40% compared with that of samples without CNTs. The cyclic voltammetry results showed that the CNFs have good reversibility, and the shape of the curve is similar to that of the rectangular shape. According to the results of constant-current charge/discharge, the curve exhibited a regular triangular symmetric distribution, indicating good stability of the electrode made by these CNFs.
ACKNOWLEDGMENTS
This work was financially supported by National Natural Science Foundation of China (Grant No. 51872268).