

Introduction
Conservation agencies have developed approaches to monitor biodiversity trends and inform action towards goals such as the Convention on Biological Diversity’s Aichi Target 12 (Convention on Biological Diversity, no date): “By 2020 the extinction of known threatened species has been prevented and their conservation status, particularly of those most in decline, has been improved and sustained”. These approaches often compile data from a range of sources into summary metrics, and they vary in scale from the global, such as the Living Planet Index (Loh et al., Reference Loh, Green, Ricketts, Lamoreux, Jenkins, Kapos and Randers2005), to the regional, such as Scotland’s Natural Capital Asset Index (Scottish Natural Heritage, no date a) and Ecosystem Health Indicators (Scottish Natural Heritage, no date b). These summary metrics tend to favour two attributes with respect to biodiversity; they draw on periodic high-intensity sampling of charismatic groups such as birds and butterflies (Harrison et al., Reference Harrison, Yuan, Buckland, Oedekoven, Elston, Brewer, Johnston and Pearce-Higgins2016; Dennis et al., Reference Dennis, Morgan, Bereton, Roy and Fox2017) and/or they represent systematically sampled data in plots, such as the UK Countryside Survey (Wood et al., Reference Wood, Smart, Bunce, Norton, Maskell, Howard, Scott and Henrys2017). The use of high-intensity sampling and/or systematic survey can help ensure that trends are robust but may come at the expense of taxonomic breadth, because survey effort tends to be focused on species most popularly recorded by natural history enthusiasts or voluntary citizen scientists. This stands in contrast to the temporally and spatially ad hoc records contributed by taxonomic specialist recorders and focused on groups such as algae, bryophytes or fungi (including lichens).
To put this problem in context, the Scottish Biodiversity List (SBL) includes 1947 species that are legislated for under section 2(4) of the Nature Conservation (Scotland) Act 2004. Approximately 25% of SBL species are lichens, for which Scotland has an international conservation responsibility (Gibby, Reference Gibby2003), although trends specific to these priority species are currently not incorporated into metrics such as the Natural Capital Asset Index or Ecosystem Health Indicators. To increase the direct representation of groups such as lichens in conservation monitoring, it will become necessary to find ways of harnessing their available data. This paper asks whether it might be feasible to incorporate a group such as lichens into trend analysis by drawing on recent method development designed to extract information from ad hoc field-recorded data that are noisy (Isaac et al., Reference Isaac, van Strien, August, de Zeeuw and Roy2014). Such data have been compiled into the British Lichen Society database (Simkin, Reference Simkin2012) and are available through national repositories such as the NBN Atlas (NBN Atlas Scotland, no date).
In an attempt to isolate trends from opportunistic and non-systematically sampled data, our study focused on lichen epiphytes, a group for which Scotland has international conservation responsibility (Ellis et al., Reference Ellis, Eaton, Theodoropoulos and Elliott2015b; Ellis, Reference Ellis2016) and which can be aligned to European Nature Information System (EUNIS) level 1 habitat type G: woodland, forest and other wooded land (Davies et al., Reference Davies, Moss and Hill2004). This ensures compatibility with a recent emphasis on national habitat mapping and biodiversity assessment for Scotland using EUNIS typologies (Strachan, Reference Strachan2017). Emphasis was placed on old-growth–dependent species, because this makes it possible to infer a probable cause for an increase or a decrease in their distributions, thus linking trends to conservation action.
Methods
Indicator species selection and data sets
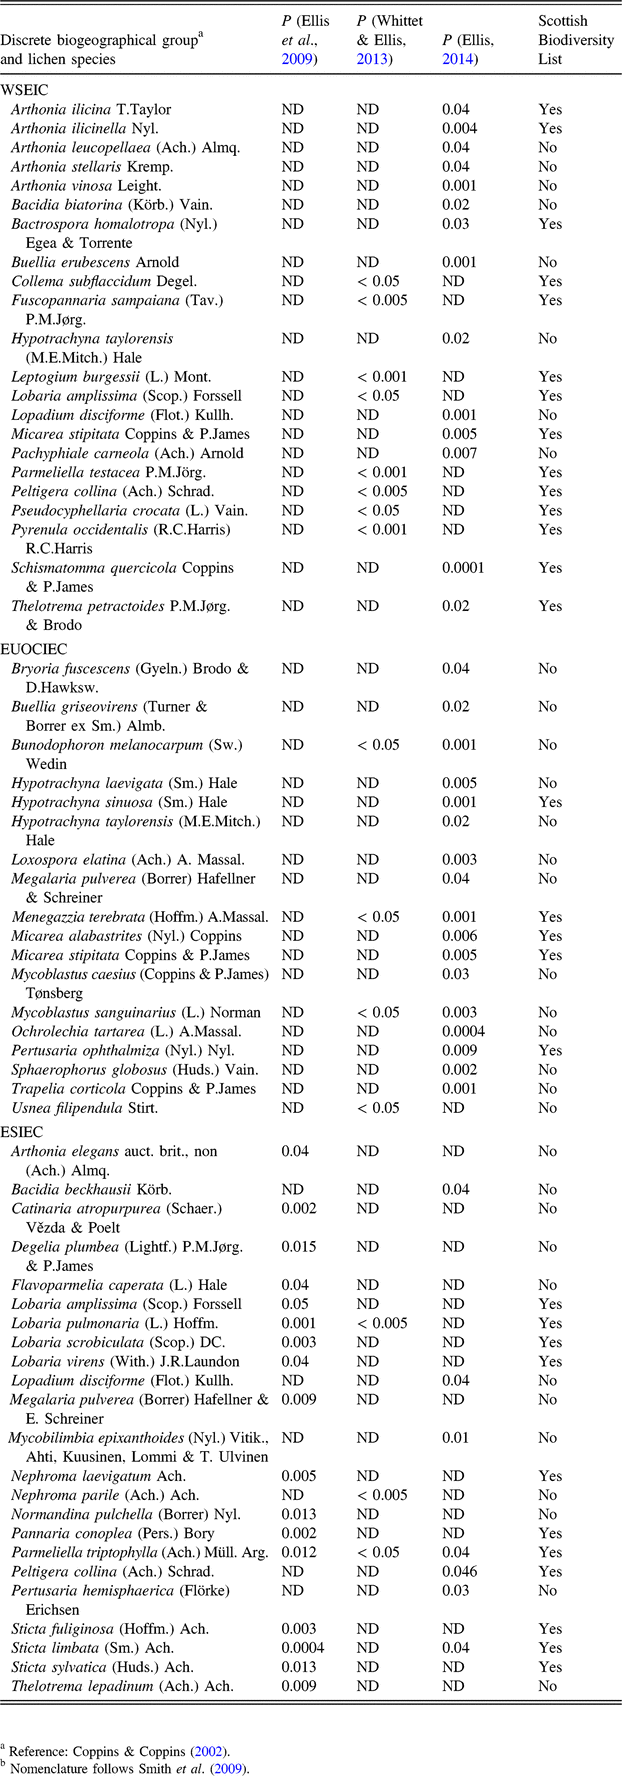
A species selection applied several filters (Table). Species in the initial list were those included on the SBL and thus legislated for protection under section 2(4) of the Nature Conservation (Scotland) Act 2004 (see Introduction), as well as aligned to EUNIS habitat type G as their primary habitat, and woodland epiphytes. Of these, we subselected species that are hypothesised based on detailed field knowledge (Coppins & Coppins, Reference Coppins and Coppins2002) and have received statistical support (Ellis et al., Reference Ellis, Yahr and Coppins2009; Whittet & Ellis, Reference Whittet and Ellis2013; Ellis, Reference Ellis2014) as indicators of long ecological continuity for Scotland’s west coast oceanic climate (WSIEC: West of Scotland Indicators of Ecological Continuity), including oligotrophic oceanic habitats (EUOCIEC: Euoceanic Indicators of Ecological Continuity), or alternatively for the drier, more continental climatic zone in northeast Scotland (ESIEC: East of Scotland Indicators of Ecological Continuity). Ecological continuity refers to a species dependence on specialist habitats that have existed in woodland sites over extended time periods (Coppins & Coppins, Reference Coppins and Coppins2002), with a reliance on aspects of niche specialism and temporal dependency otherwise referred to as ‘old-growth’ properties (Whittet & Ellis, Reference Whittet and Ellis2013). This creates a degree of attribution relating to any trends discovered, because the ecological status of these indicator species can be explained by their sensitivity to issues of woodland habitat quality, extent, connectivity and continuity thereof.
Hypothesised indicators of ecological continuity a that have received a degree of statistical verification and are legislated for on the Scottish Biodiversity Listb

ESIEC, East of Scotland Indicators of Ecological Continuity; EUOCIEC, Euoceanic Indicators of Ecological Continuity; ND, not determined; WSIEC, West of Scotland Indicators of Ecological Continuity.
a Reference: Coppins & Coppins (Reference Coppins and Coppins2002).
b Nomenclature follows Smith et al. (Reference Smith, Aptroot, Coppins, Fletcher, Gilbert, James and Wolseley2009).
Records were extracted at a 10-km grid scale for each of the indicator species (see above) and grouped into decadal periods since the initiation of the British Lichen Society mapping scheme: 1960–1969, 1970–1979, 1980–1989, 1990–1999, 2000–2009, and then 2010–2017. Nomenclature follows Smith et al. (Reference Smith, Aptroot, Coppins, Fletcher, Gilbert, James and Wolseley2009) for all species.
Trend analysis controlling for sampling effort
The relatively simple Telfer–Preston–Rothery method of trend analysis was used for distributional comparison across decades (Telfer et al., Reference Telfer, Preston and Rothery2002). This method compares the number of records for a combined set of species over two consecutive time periods to provide a general estimate of recording effort, i.e. increase or decrease in their occupancy across a shared set of grid squares. Trends for individual species are isolated against this shared pattern by calculating their deviation as a standardised residual, providing an index of change. This value obtained is therefore a relative increase or decrease in distributional extent. Analysis was implemented using the R package sparta, which is available in beta phase via https://github.com/BiologicalRecordsCentre/sparta (T. August, Centre for Ecology and Hydrology, Wallingford, personal communication), with the minimum number of recorded sites for time-period comparison set to 5, and with 10 model iterations (Telfer et al., Reference Telfer, Preston and Rothery2002).
The key question addressed here is how might the distributional trends for each of the indicator species be properly isolated as their deviation from recording effort applied to epiphytes more generally? We blended the Telfer–Preston–Rothery approach with the logic behind the ‘bench-marking method’ (Hill, Reference Hill2012), which referenced the trend for a target species against that of locally common species occurring above a threshold prevalence value, and that could be assumed to show no overall change other than the effects of recording effort. Thus, each of the indicator species was tested separately against the trend for a set of widespread lichen epiphytes used as controls. A similar comparative approach has been used previously for lichens, to identify trends in sampling bias and to isolate spatial aggregation for ancient woodland indicators (Whittet & Ellis, Reference Whittet and Ellis2013; Bogomazova, Reference Bogomazova2018).
Of the species used as proxies for recording effort by Whittet & Ellis (Reference Whittet and Ellis2013) (n = 5: Arthonia radiata (Pers.) Ach., Hypogymnia physodes (L.) Nyl., Parmelia sulcata Taylor, Pertusaria leioplaca DC. and Ramalina farinacea (L.) Ach.) and Bogomazova (Reference Bogomazova2018) (n = 14: Arthonia didyma Körb., Arthonia radiata, Evernia prunastri (L.) Ach., Graphis scripta (L.) Ach., Hypogymnia physodes, Lecanora chlarotera Nyl., Lecidella eleaochroma (Ach.) M.Choisy, Lepraria incana (L.) Ach., Melanelixia subaurifera (Nyl.) O.Blanco, A.Crespo, Divakar, Essl., D.Hawksw. & Lumbsch., Parmelia sulcata, Pertusaria leioplaca, Physcia adscendens H.Olivier, Physcia tenella (Scop.) DC. and Ramalina farinacea), and then excluding species that are known pollution indicators (Physcia adscendens and Physcia tenella; Seed et al., Reference Seed, Wolseley, Gosling, Davies and Power2013; Welden et al., Reference Welden, Wolseley and Ashmore2018), eight of the candidates also appeared to have no biogeographical signal in recent bioclimatic modelling (Ellis et al., Reference Ellis, Eaton, Theodoropoulos, Coppins, Seaward and Simkin2014, Reference Ellis, Eaton, Theodoropoulos, Coppins, Seaward and Simkin2015a). These were considered suitable as control points for epiphyte recording effort: Evernia prunastri, Hypogymnia physodes, Lecanora chlarotera, Lecidella elaeochroma, Lepraria incana, Melanelixia subaurifera, Parmelia sulcata and Ramalina farinacea.
Decadal time-period change
The relative change indices were calculated for indicator species over five consecutive time-period comparisons and expressed as means with standard deviation. These mean values were ranked and plotted to estimate each species’ resistance to change. Change indices for each of the consecutive time-period comparisons were then plotted as point or box plots for indicator species categorised into each of the three biogeographical groups: WSIEC, EUOCIEC and ESIEC (see Indicator species selection and data sets, above).
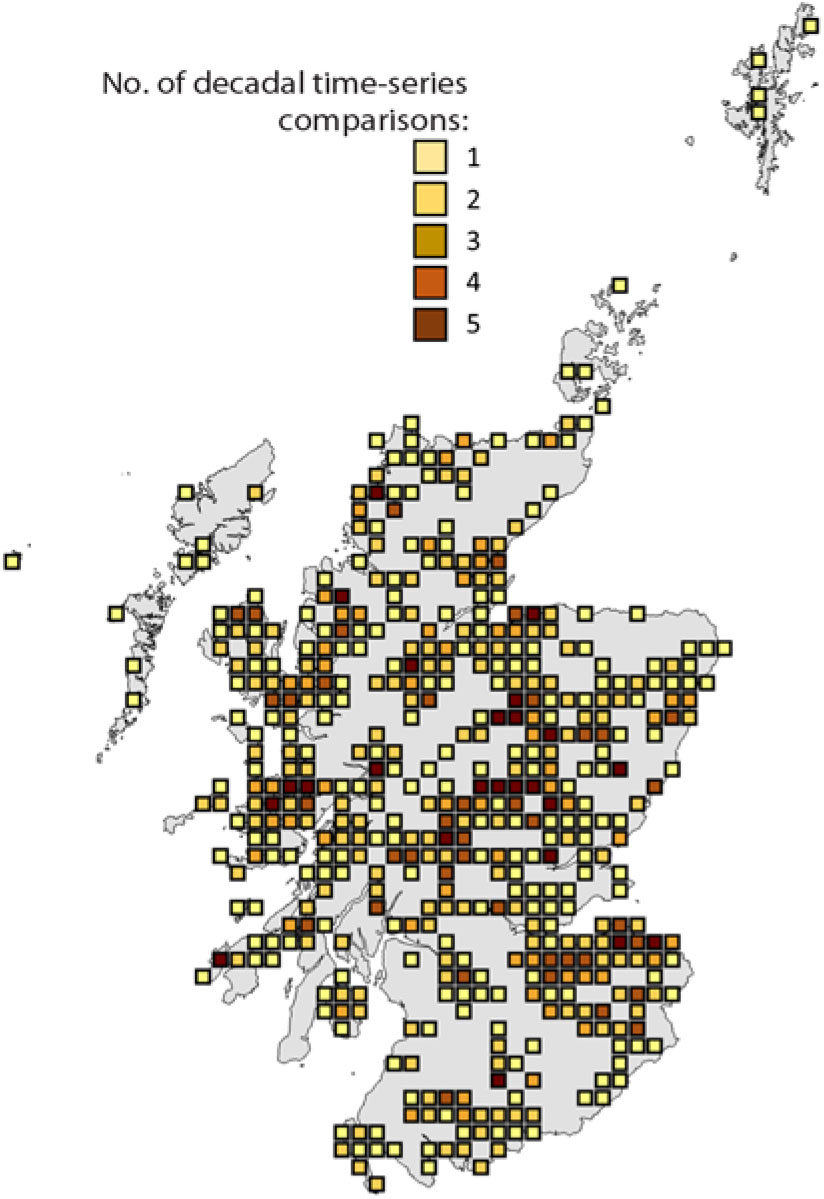
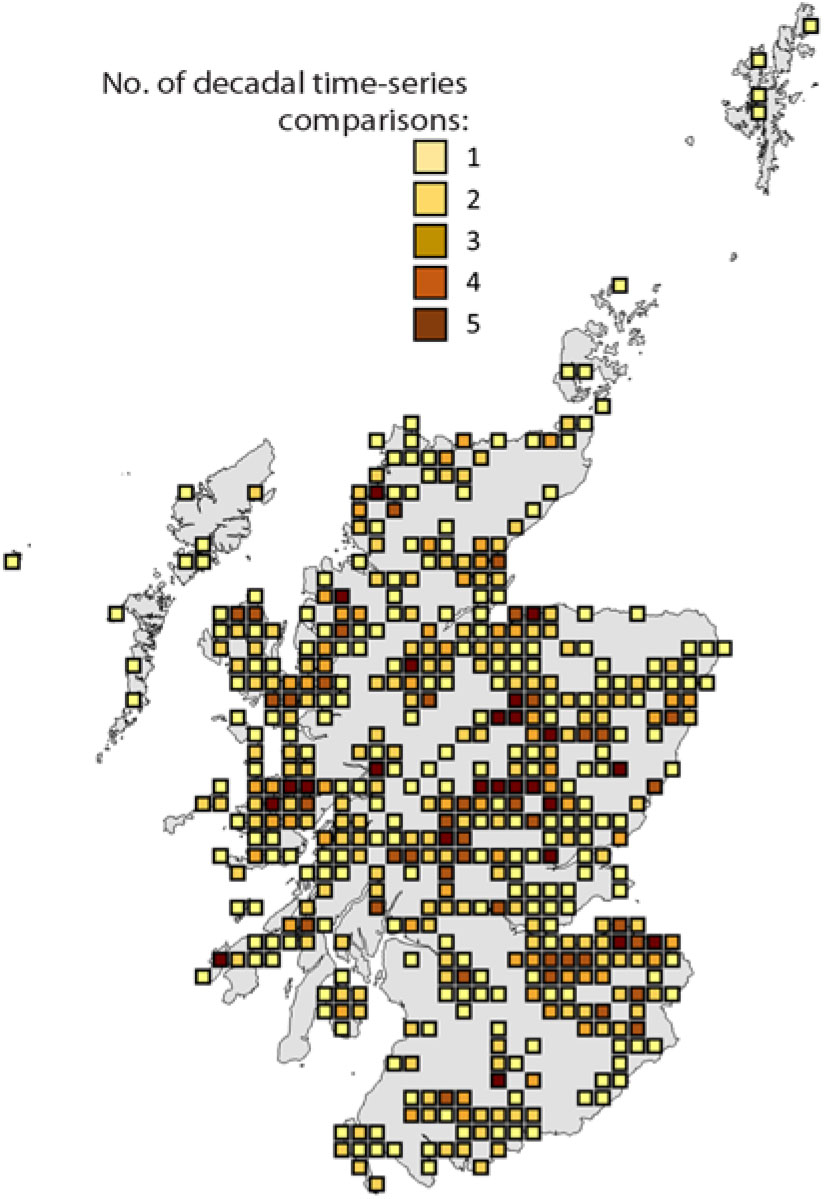
To examine the spatial extent of the data used in determining indicator species trends, we plotted the 10-km grid squares for which relevant data were available, i.e. for which the recurrent recording of benchmark or control species occurred over consecutive decadal time periods, and the number of times a given 10-km grid square contributed in this way to the analysis. To test for shifts in recording effort between benchmark species relative to indicators, the changing recording effort over time was examined as the proportion of a species’ total records per decade, with these proportions plotted as box plots for each of the decadal time periods used for the trend analysis.
Results
There was a total of 14, 5 and 11 epiphytic lichen species that are legislated for conservation on the SBL, and that are also indicators of ecological continuity with statistical support, for the three biogeographical zones WSIEC, EUOCIEC and ESIEC, respectively (see Table). However, one of the WSIEC indicators – Bactrospora homalotropa (Nyl.) Egea & Torrente – was dropped from the analysis because of its insufficient number of records.
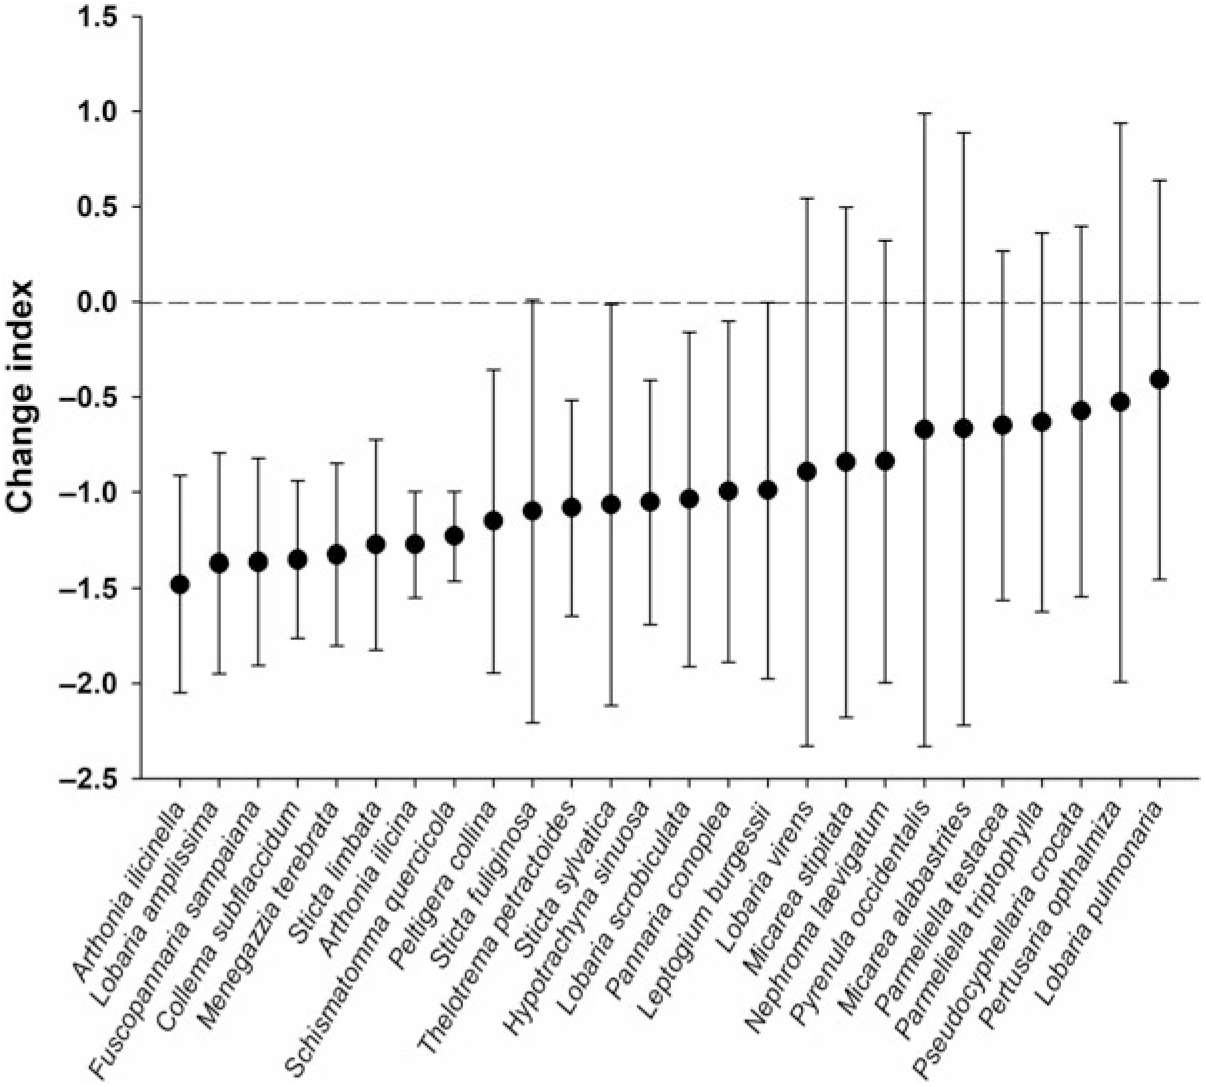
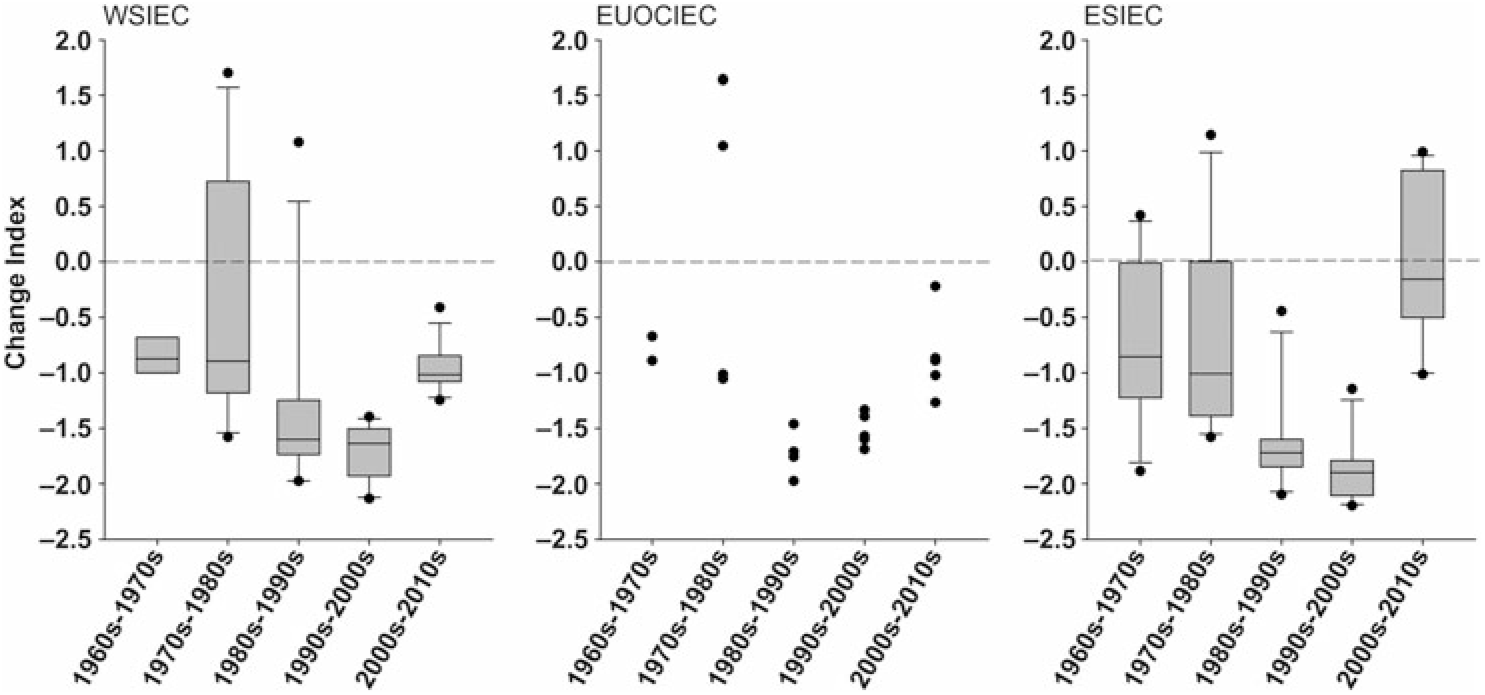
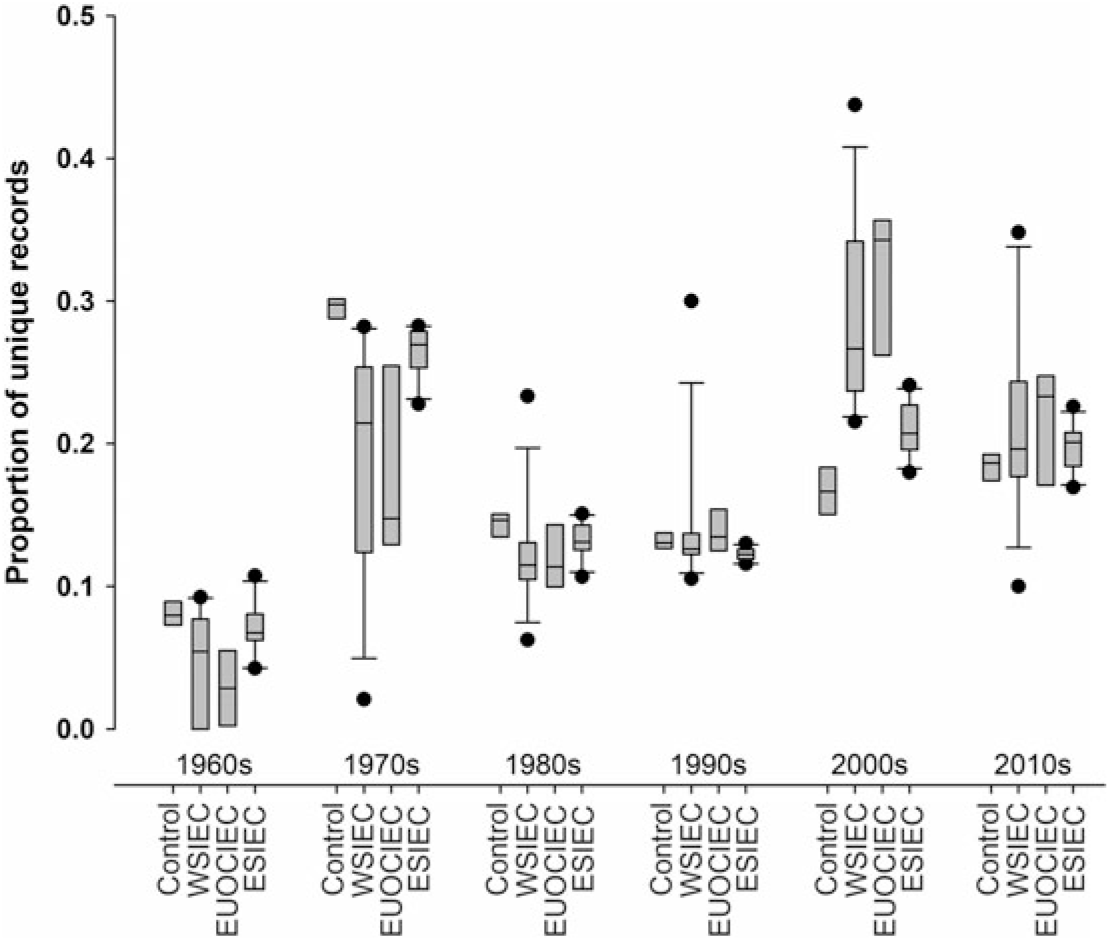
Comparing record data for the indicator species across decades, and calibrating these data against data for eight generalist species used as the benchmark species for recording effort, there was variability both between species and within species between their consecutive decadal time periods (Fig. 1). Species with the most severe overall declines include Arthonia ilicinella Nyl., Fuscopannaria sampaiana (Tav.) P.M.Jørg. and Lobaria amplissima (Scop.) Forssell, with mean change index values of –1.48, –1.37 and –1.36, respectively, whereas the distribution of Lobaria pulmonaria (L.) Hoffm. appeared to be most resistant to decrease in Scotland, having the lowest mean change index value of –0.41. Notwithstanding these individual species trends, there was a consistent average decrease in the distributional extent of indicators over time for all the biogeographical groups (Fig. 2), and this was based securely on a pattern of widely distributed recording across Scotland’s landscape (Fig. 3). The decreases accelerated from the 1960s through to the 2000s, with evidence that the rate of decline may be slowing in the 2010s. A temporal pattern of records for species between the contrasting groups was broadly similar (Fig. 4), although with slight differences for the 1970s (proportionally higher records for the benchmark species than for the indicators) and the 1990s (proportionally higher records for the indicator species than for the controls).
The ranking of mean (± 1 SD) change index values for individual indicator species, calculated across consecutive decadal time periods. Trends are calibrated against equivalent data for eight generalist species (recording effort), with the dashed line showing no change between time periods.

Comparison of change index over consecutive decadal time periods for the three contrasting biogeographical groups of lichen epiphytes that are indicative of woodland ecological continuity (cf. Table). Trends are calibrated against equivalent data for eight generalist species (recording effort), with the dashed line showing no change between time periods. Trends are summarised as box plots for groups with ≥ 10 species (WSIEC and ESIEC) and as point plots for the EUOCIEC group (≤ 5 species); box plots show the median (line), 25th to 75th quartile range (box), 10th and 90th (whiskers) and 5th and 95th percentiles (points). ESIEC, East of Scotland Indicators of Ecological Continuity; EUOCIEC, Euoceanic Indicators of Ecological Continuity; WSIEC, West of Scotland Indicators of Ecological Continuity.

Spatial distribution of 10-km grid squares used for the decadal time-period comparison of species recording effort, based on the distribution of benchmark species and showing the number of times a single grid square contributes to decadal comparisons.
Proportion of unique records (species, grid square) per decade for benchmark (control) species and ‘old-growth’ indicators in three contrasting biogeographical groups. Box plots show the median (line), 25th to 75th quartile range (box), 10th and 90th (whiskers) and 5th and 95th percentiles (points). ESIEC, East of Scotland Indicators of Ecological Continuity; EUOCIEC, Euoceanic Indicators of Ecological Continuity; WSIEC, West of Scotland Indicators of Ecological Continuity.

Discussion
The aim of this study was to explore the use of ad hoc field-recorded data for trend analysis in taxonomic groups that are not currently subject to dedicated systematic plot-based survey or high-intensity recording. Lichen epiphytes provided a case study, including species that are indicators of woodland continuity and which are legislated on the SBL and therefore of policy interest.
Lichen distributional records are accumulated as date-specific field-recorded species lists (inventory) targeted to grid squares or sites and contributing to a collective resource made available by a relatively small number of lichen taxonomic specialists. The methods applied here in extracting trends from these unstructured data are undergoing rapid statistical development (Isaac et al., Reference Isaac, van Strien, August, de Zeeuw and Roy2014), and the results are therefore instructive but preliminary. The declines tentatively observed are explained by ecological traits that underpin indicator species association with two old-growth properties (Whittet & Ellis, Reference Whittet and Ellis2013): 1) dispersal limitation (Dettki et al., Reference Dettki, Klintberg and Esseen2000; Sillett et al., Reference Sillett, McCune, Peck, Rambo and Ruchty2000) and low probabilities of colonisation into regenerated woodland, and/or 2) niche specialism (Ohlson et al., Reference Ohlson, Söderström, Hörnberg, Zackrisson and Hermansson1997; Lõhmus & Lõhmus, Reference Lõhmus and Lõhmus2011) and a requirement for heterogeneous microhabitats, including those occurring in old woodland stands (e.g. large veteran or senescent trees). Declining distributional extent can thus be explained by reductions in woodland habitat quality, extent or connectivity for the present-day landscape, but also as a consequence of historical landscape change through the well-established extinction debt observed for lichen epiphytes (Berglund & Jonsson, Reference Berglund and Jonsson2005; Ellis & Coppins, Reference Ellis and Coppins2007; Johansson et al., Reference Johansson, Ranius and Snäll2013). Evidence exists to support these inferred landscape effects, including an estimated 42% loss of seminatural ancient woodland in Scotland from the nineteenth century through to the 1980s (Roberts et al., Reference Roberts, Russell, Walker and Kirby1992) and a further 14% loss of ancient woodland estimated from the 1980s through to 2014 (Patterson et al., Reference Patterson, Nelson, Robertson and Tullis2014), accompanied by unsatisfactory ecological condition for c.46% of Scotland’s woodlands, including c.33% of protected sites (Scotland’s Environment, no date a, b).
The species included here are also expected to be among the most vulnerable to recent and future climate change (Ellis, Reference Ellis2014). Considering the ambition in Scotland for woodland regeneration, including greater extent of native woodland (Anonymous, 2006), a downscaling towards direct population monitoring of our target epiphytes could help to inform future conservation action. This would provide evidence for whether regeneration is having the desired effect in reversing metapopulation collapse (extinction debt) as well as bolstering climate change resilience through diversification of microclimatic refugia.
There are several caveats that emerge from this work, in addition to the limitations of the statistical methods (Telfer et al., Reference Telfer, Preston and Rothery2002; Isaac et al., Reference Isaac, van Strien, August, de Zeeuw and Roy2014). First, the results depend on the consistent taxonomy of field identification and recording. The original choice of indicator species (Coppins & Coppins, Reference Coppins and Coppins2002) was designed to minimise taxonomic ambiguity and facilitate accurate recording; for potentially difficult species we used ‘sensu lato’ concepts when mining the databases from which records were extracted. Hence, the records refer to species complexes for several of the benchmark species (e.g. Lecanora chlarotera sensu lato), and also where there have been recent taxonomic splits leading to aggregates among the indicator species, such as for Degelia plumbea (Lightf.) P.M.Jørg. & P.James (Blom & Lindblom, Reference Blom and Lindblom2010) and Sticta fuliginosa (Hoffm.) Ach. (Magain & Sérusiaux, Reference Magain and Sérusiaux2015).
Second, our results are consistent with an increase in recording effort for the benchmark species that are common and generalist relative to the rarer indicator species; this may happen if there are increasing numbers of novice lichen recorders contributing records focused on easily located and recognisable species, or if recording becomes skewed over time to disturbed and early successional urban or peri-urban habitats. There is no evidence to suggest that this might be the case (see Fig. 4) and, generally speaking, lichenologists involved in field recording can be expected to favour the search for ‘interesting’ species from high-quality habitats rather than intensively recording sites that yield lists of only common species. Accordingly, despite fluctuations in recording effort, the trend over decades strongly suggests an overall decline in Scotland for the old-growth indicators. The strength of this conclusion lies in its generality – depending therefore on the average overall decline for species within their biogeographical indicator groups, observed consistently across multiple decades – rather than detailing comparative differences between species within or between decadal periods. On this basis, the reduced rate of decline observed during the 2000s–2010s comparison, especially for ESIEC species, is suggestive of conservation measures taking hold but must be interpreted with caution and requires verification.
Third, the restriction in this study to species legislated for on the SBL excludes from the results a suite of boreal-type species that are expected to be threatened by climate warming (Ellis et al., Reference Ellis, Eaton, Theodoropoulos, Coppins, Seaward and Simkin2014, Reference Ellis, Eaton, Theodoropoulos, Coppins, Seaward and Simkin2015a) but that are also typical of oligotrophic habitats such as pine–birch–aspen–juniper woodland, and which are likely to be impacted by increasing N-deposition. These species are clear candidates for monitoring environmental change. However, several key examples have been the subject of dedicated monitoring effort through a targeted survey of their preferred habitats, for example Lecanora populicola (DC.) Duby and Vulpicida pinastri (Scop.) J.-E.Mattsson & M.J.Lai on aspen and juniper, respectively (Ellis et al., Reference Ellis, Coppins and Dawson2007; Binder & Ellis, Reference Binder and Ellis2008). This increased and targeted sampling effort between 2000 and 2009 would bias the trend analysis (due to false increases in occurrence as a consequence of changed sampling effort for a particular species) and makes their use as indicators problematic. Nevertheless, trend analysis focused on the SBL does miss potentially important indicators of change within Scotland’s boreal zone, and assessment could be expanded to non-SBL species such as Bryoria fuscescens (Gyeln.) Brodo & D.Hawksw., Cetraria sepincola (Ehrh.) Ach. and Tuckermannopsis chlorophylla (Willd.) Hale.
As statistical methods develop further, the degree of confidence in trends extracted from ad hoc field-recorded data is expected to increase and the observations here may be confirmed or refuted. However, as a preliminary assessment, this study does raise serious concern about the long-term status of lichen epiphytes in Scotland and points to a need to secure through continuity of conservation management a minimum standard in habitat quality, extent and connectivity for species with traits (dispersal limitation, niche specialism) that make them highly vulnerable to landscape change. It is also important that future conservation action includes the opportunity to test the effectiveness of landscape-scale management (increased habitat quality, extent, connectivity) against species-level outcomes that are derived from monitoring, recording and trend analyses, ensuring that the main goal of conservation in avoiding species extinction is tested directly as an outcome, rather than inferred.
Acknowledgements
We thank all the lichen recorders who have submitted their field-recorded data to collaborative databases over many years, especially members of the British Lichen Society; we thank Dr Tom August (Centre for Ecology and Hydrology) for his advice on the use of sparta. We thank two reviewers for their constructive criticisms to improve the draft manuscript.