


Introduction
Macromechanics of gravitational avalanche-type processes (snow avalanches, slushflows and debris flows) has actively developed in recent decades. The processes of snow avalanche origin have been described (Reference Bozhinskiy and ChernoussBozhinskiy and Chernouss, 1986; Reference Bozhinskiy, Nazarov and ChernoussBozhinskiy and others, 2002a). Dynamic models of dense snow avalanches, powder avalanches and mixed avalanches have been proposed (Reference Bozhinskiy and LosevBozhinskiy and Losev, 1987; Reference EglitEglit, 1998; Reference HarbitzHarbitz, 1998). Dynamic models for slushflow and debris flow have also been developed (Reference IversonIverson, 1997; Reference Bozhinskiy and NazarovBozhinskiy and Nazarov, 1998, Reference Bozhinskiy and Nazarov2000). A model usually includes some parameters, which, together with input data, control the solution of a problem. The rather precise assessments of model parameters for natural problems, including avalanche-type processes, are impossible practically. Each realization of an avalanche-type process is the result of the interaction of many complex natural factors, and thus has ultimately a probabilistic character. In this context, a probabilistic approach to the assessment of avalanche dynamic characteristics seems to be a sound perspective (Reference Barbolini and SaviBarbolini and Savi, 2001; Reference Bozhinskiy, Nazarov and ChernoussBozhinskiy and others, 2001, Reference Bozhinskiy, Nazarov and Chernouss2002a, Reference Bozhinskiy, Sukhanov, Andreev and Sidorovab, Reference Bozhinskiy, Nazarov and Sapunovc; Reference Barbolini, Keylock and SaviBarbolini and others, 2002).
The object of this paper is the statistical simulation of avalanche-type processes. As a basis, deterministic models of these processes are used, but the model parameters and/or input data are treated as random variables. The output data, obtained in operating the deterministic model, will also be random variables. The statistical simulation of random parameters is carried out by the Monte Carlo method.
Monte Carlo Methodology
The Monte Carlo method is a statistical simulation method that can simulate any process that undergoes an influence of random factors. The Monte Carlo method simulates random variables with known distribution laws. A reference random variable used in the Monte Carlo method is β, uniformly distributed within an interval (0, 1).
Having generated a value for β, it is possible to calculate a value η of another random variable x, distributed within an interval (a; b) with a probability density p(x), from the equation (Reference SobolSobol’, 1968)
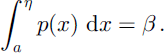
If the variable x is distributed uniformly within an interval (a, b), its density p is constant (p = (a - b)-1), and from Equation (1) follows the equation for generation of values of η:

There are various ways of generating random variables for more complicated distributions of η (Reference SobolSobol’, 1968). In particular, if η is normally distributed with parameters ξ and  is the mathematical expectation; σ = (Dη)1/2 is the sample standard deviation, with D indicating the variance) the generated values follow from the equation

where η0 is the normal distributed random variable with zero mathematical expectation and unit variance.
In this paper, the uniform distribution law of model parameters is used for three reasons. First, the true distribution of any model parameter is not known. Secondly, as shown earlier, the influence of the distribution laws for model parameters on distribution functions for output model characteristics is relatively weak (Reference Bozhinskiy, Nazarov and ChernoussBozhinskiy and others, 2001). Thirdly, the uniform distribution law is convenient for examining how the moments of distributions of model parameters influence the output data.
Statistical Modelling
Snow avalanche origin
The problem of the stability of snow on mountain slopes and avalanche origin is key in avalanche science. During statistical simulation, the model of the stress state of a snow slab on mountain slopes based on the equations of the momentless theory of thin elastic (viscous) shells was used (Reference Bozhinskiy, Nazarov and ChernoussBozhinskiy and others, 2002a). The zone of the avalanche origin or instability is determined by the critical thickness Hcr of a snow slab:

where c is cohesion, f is the coefficient of internal friction, ρ is the snow density, and is the local slope angle.
The output characteristics of the two-dimensional model are normal stresses S11, S22 (along and across a slope) and shear stresses S12 in a plane of a slab. Thus, it is possible to determine an avalanche origin not only from a maximum tensile stress, which is usually observed on the upper contour (fracture line), but also by more complicated criteria, for example, the intensity Si of shear stresses (Reference Bozhinskiy, Nazarov and ChernoussBozhinskiy and others, 2002a), which achieves a maximum along longitudinal edges of the instability zone (flank shear fractures):

From the solution of the two-dimensional problem, it is possible to estimate a configuration of an instability zone and a volume of snow, which is potentially unstable. However, this volume practically always exceeds the actual volume of snow originally involved in the motion, because the action of maximal stresses is spread to only a part of the instability zone (Reference Bozhinskiy, Nazarov and ChernoussBozhinskiy and others, 2002a).
The statistical simulation of snow instability on a slope was carried out for avalanche path No. 22 (Khibiny, Russia). The stress state and stability of the snow slab before an avalanche release was estimated. The avalanche occurred on 9 February 1987, as a result of mortar firing, and had a volume of 31 × 103 m3. The distribution of the snow slab thickness within a starting zone was determined from field measurements on 40 stakes and was approximated by a cubic polynomial, as shown in Figure 1. Storm-accumulated snow is noticeable in the left upper corner of the starting zone. Data on the strength characteristics of snow are lacking, so typical ranges of values were assumed: 0.4 ≤ f ≤ 0.5; 300 ≤ c ≤ 700 Pa. The strength of the snow slab on rupture and shear, and accordingly the limiting value Si * of the shear stress intensity in a plane of a slab, were also random. The assumed value was 1 × 10⁴ ≤ Si * ≤ 2 × 10⁴ Pa. The assumed ranges for strength parameters approximately correspond to experimental data for storm-packed snow with a density of about 300 kgm–3 (Reference VoitkovskiyVoitkovskiy, 1977).
Distribution of snow slab thickness; contour of H level is 0.1m. Avalanche site No. 22 (Khibiny).

A uniform distribution of strength characteristics within the assumed ranges was supposed. One hundred values of random variables c; f; Si *were generated, and then the stress distributions within the avalanche starting zone are obtained. It is necessary to underline that, for a given problem, as well as for two other problems considered in this paper, the number of generations has an illustrative character.
The fragment of the starting zone, corresponding to the left upper corner of Figure 1, is shown in Figure 2. There the typical distribution of Si is given. It is seen that the contours of the maximum stress Si form a near-triangular shape. Maximum tensile stresses act at the crown, and maximum shear stresses and transverse normal stresses on the sides. The thick solid line marks the fracture line of the avalanche. Good agreement between the model calculations and field data is noticeable.
Contours of shear stress intensity Si.
The maximum values Si for each realization were compared to a random value Si *, and the random difference ΔSi = Si * = Si was determined. The histogram and distribution function of ΔSi are shown in Figure 3. The distribution has a negative skewness and excess. By definition, ΔSi > 0 corresponds to stability and ΔSi < 0 to instability of the slab. According to the distribution function in Figure 3, the probability of stability and instability of the snow slab is equal to 0.11 and 0.89, respectively. The probability of instability of the snow slab is rather great, which also proves to be true of the avalanche release.
Histogram and distribution function of ΔSi.
However, as the boundary values of ranges of change of snow-strength characteristics are not exact, the influence of the first moments of distributions (mathematical expectation and variance) on stability of the snow slab was investigated. In Figure 4, the curves of probability of stability and instability of the slab are shown to depend on the variance of S* i ; DS* i : The mean value of S* i ; ξS, was held constant and set to 1.5 × 10⁴ Pa. This corresponds to expansion or narrowing of the range of changing of S*i . It is apparent that the influence of the variance of S* i on stability of the snow slab is rather weak. At the same time, the dependence of the probability of snow-slab stability on the mean value of cohesion ξc is noticeably stronger (Dc is constant, which corresponds to a shift of the range of changing of c) (see Fig. 5). The curves corresponding to stability and instability of the slab draw together with increasing ξc, and at ξc ≈ 700 Pa the probabilities of avalanche release and snow-slab stability are nearly identical and equal to 0.5. Thus, control of the process of the avalanche origin is determined by mean values of strength parameters of a snow slab, whereas the influence of variance of these parameters is secondary. This conclusion is important for modelling and should be proved by the subsequent calculations.
Probability of snow slab instability (solid line) and stability (dashed line) υs dispersion of Si.
Probability of snow slab instability (solid line) and stability (dashed line) υs mean value ξc of snow cohesion.
Snow avalanche dynamics
The following avalanche problem is connected with describing the process of an avalanche motion on a slope. Here, the deterministic one-dimensional hydraulic model, which takes into account an entrainment of new snow masses into the motion, is applied (Reference Bozhinskiy, Nazarov and ChernoussBozhinskiy and others, 2001). Three parameters of the model, namely, coefficients μ; k of dry and turbulent friction, respectively, and the coefficient me of the snow mass entrainment into the motion, are considered as random variables. The statistical simulation of the avalanche-motion process is carried out for the well-known avalanche path “Domestic” (Elbrus region, Russia), where there is a series of field observations of run-out distances (38 events). The uniform distribution of random model parameters within ranges 0.15 ≤ μ ≤ 0.525; 0.005 ≤ k ≤ 0.2, and 0.002 ≤ me ≤ 0.01 was assumed. The mean values of μ and k were assumed based on several back model calculations of actual avalanches. The boundaries of ranges cannot be prescribed precisely, and naturally contain some indeterminacy, but they correspond to rather rare avalanches (short and long run-out distances). The boundaries of me correspond approximately to one-quarter and total erosion of snow cover. The remaining model parameters and input data were deterministic and set to an average value. The density ρ of the avalanche body was equal to 200 kgm-3, the snow-cover thickness in a transit and deposition zone H0 = 1.5m, and the initial volume (per unit of width) of snow involved in the motion, V0 = 50 m2.
Two hundred values of random model parameters were generated. As a result of statistical simulation, the 200-term series of the following output model characteristics were obtained: the run-out distances of avalanches, the maximum thickness of depositions, the time of motion, and the volume and length of an avalanche deposit body.
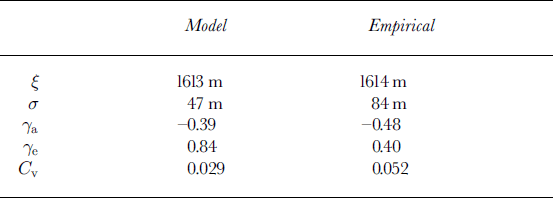
The statistics (the mathematical expectation ξ, the sample standard deviation σ, the coefficient of skewness a, the coefficient of excess e, the coefficient of variation Cv) of the empirical and model run-out distance S* are shown in Table 1. The mean values of distributions practically coincide; also, the coefficients of skewness are close. The scatter of model values is less noticeable. Moreover, the model distribution has a more acute peak. A comparison of the model and empirical cumulative distribution functions F(S*) of the run-out distance is depicted in Figure 6. According to the Kolmogorov–Smirnov test, the maximum value of the module of the difference is used as a measure of deviation-model (m) and empirical (e) distributions (Reference VentselVentsel, 1969):
Model and empirical distribution function of avalanche run-out. Avalanche site “Domestic”.
Statistics of model and empirical distributions of run-out distance (avalanche site “Domestic”)

Then the value λ = dN1/2 is determined, where N is the number of observations, and under the relevant table the probability p(λ) is found, which means that the discrepancy between model and empirical distributions will be not less than the actually observed one. In the case under consideration, d ≈ 0.12; N = 38; λ ≈ 0.7 and ρ(λ) ≈ 0.7.This probability is not small; therefore, it is possible to consider a hypothesis about the goodness of model and empirical distributions compatible with data from field observations. The hypothesis is also not rejected according to Pearson’s chisquare test. At the same time, some discrepancy is found in zones of rather rare values, which is due to both ignorance of precise distribution laws of model parameters, and restricted series of field observations.
The histogram and distribution function of the maximum thickness of avalanche depositions are shown in Figure 7. The distribution is characterized by positive asymmetry (γa = 0.63) and almost by lack of excess (γe = -0.11): The mean value is ξHmax = 5.5m. This value is in accordance with field observations, which, unfortunately, are unit.
Histogram and distribution function of Hmax. Avalanche site “Domestic”. Slushflow dynamics
The two-layer deterministic hydraulic model of a slushflow is a basis for developing a probabilistic model of a slushflow and statistical simulation (Reference Bozhinskiy and NazarovBozhinskiy and Nazarov, 1998).
Series of numerical experiments using the model have shown that the coefficient μ of dry friction of slush and the intensity Q of a water inflow on the “tail” strongly influence dynamic characteristics, run-out distance, thickness and volume of slushflow depositions. The influence of the other model parameters is weaker. In this connection, the following model parameters were assumed to be deterministic: the drag coefficients ks; kw; ksw of the turbulent flow of slush and water over the snow-cover surface and over the slush– water interface, respectively, and the intensity of water percolation from the lower to the upper layer. Morphometric parameters of the slope were also considered as prescribed.
It was supposed that the inflow Q of water on the “tail” of the flow damps in time (t) within 600 s under the square law

The parameters μ and Q0 were considered as random. The uniform distribution law was accepted. The statistical simulation of slushflow dynamics was carried out for basin No. 166, which is located on the western slope of Khibiny in the basin of Bear brook. Tracks of slushflow, released presumably in 1950/51, 1968/69 and reliably in 1977 and 1984, are traced on terrain. The slushflow in 1984 left the most numerous and reliable tracks, making it possible to produce a survey of boundaries and to determine some parameters of slushflow. The flow has passed 3.35 km up the channel. The height of the leading front reached >10m. The basic mass of wet snow was deposited by the extended “tongue”, about 250 m long and up to 40 m wide. The total volume of snow deposits was of the order of 3.5 × 10⁴ m3. The run-out distance of slushflow in 1984 was not maximal. From the character of depositions on boards and at the bottom valley, the age of new growth and damages on tree trunks, it appears that in the beginning of the 1950s, slushflows advanced 900 m further (Reference Bozhinskiy, Nazarov and SapunovBozhinskiy and others, 2002c).
The data from field observations and morphometric parameters of the slope were used during statistical simulation of slushflow dynamics. From a relation of water and snow masses in slushflow it was assumed Q0min = 5 ms- 1, Q0max = 15ms-1. The minimum value μmin of the coefficient of dry friction was estimated according to the possibility of model slushflow reaching the visual boundaries on the terrain, and was equal to 0.1. The maximum value μmax was assumed equal to 0.2. The values of the deterministic model parameters were set to: snow porosity P = 0.5; ks = kw = 0.03; ksw = 0.02; = 0.05. The snow-cover thickness in the channel was Hc = 1m; the density of involved snow was equal to 450 kgm-3. The value of the coefficient of snow entrainment was assumed such that the snow accumulated in the channel was completely involved in the motion according to field observations.
Fifty values of random variables μ; Q0 were generated, and then, using the two-layer model of slushflow, 50 numerical experiments were carried out. Thus, the 50-term series of the following output model characteristics were obtained: the run-out distance S; the length ls of a zone of slushflow depositions; the length lsw of the lower water layer; the maximal thickness Hs of snow depositions; the maximal depth Hw of the lower water layer; the volume (per unit width) Vs of snow depositions and the total volume of water Vw; the time of motion T. The outcomes of the statistical simulation of slush flow dynamics are shown inTable 2 and Figure 8. It is necessary to emphasize that the distributions of all output model characteristics, excluding Vw, have appeared essentially non-uniform, though the input distributions of μ and Q0 were uniform. This outcome is due to non-linearity of the operator of the slushflow dynamic model. In addition, it is possible to note that the majority of distributions are characterized by rather weak asymmetry. At the same time, the coefficients of excess of distributions noticeably differ (from 1.24 to -1.33).
Statistics of model distributions of output characteristics of slushflow (Bear brook, Khibiny)

Histogram and distribution function of slushflow run-out. Bear brook, Khibiny.
The distribution of the run-out distance of slushflow is characterized by positive excess. Figure 8 testifies to a concentration of stop points of the leading front of slushflow within a slope-length interval of 2700–3200m. For gravitational avalanche-type flows, as a rule, this is due to morphometric peculiarities of a profile of a channel in this interval (a flattening zone of a slope). According to the distribution function obtained, the run-out distance of slushflow in 1984 approximately corresponds to a probability of 0.05. The distant run-outs are rather rare; their realization requires a combination of considerable water inflow on the “tail” and low coefficients of dry friction.
Conclusion
This paper illustrates the possibilities of applying the Monte Carlo method for statistical simulation of avalanche-type processes, using the restricted field information usually available. For more precise estimations of the characteristics of avalanche-type processes, a greater number of random model parameters and input data is needed. With a sequential increase in the number of random model parameters, the distribution functions of output characteristics will deform (Reference Bozhinskiy, Nazarov and ChernoussBozhinskiy and others, 2001). In the end, they should converge to limiting distribution functions, which will be practically “rigid” (undeformed). In essence, these limiting distribution functions will compensate our ignorance of the true distribution of model parameters. The number of generations will depend on both the necessary accuracy and the number of random parameters.
Acknowledgements
The Russian Fund of Basic Researches, grant No. 02-0564667, financially supported this paper. P. A. Chernous provided the field data on avalanche site No. 22; L. A. Sukhanov and A. D. Oleynikov collected the run-out distances for avalanche site “Domestic”. Many thanks to all of them.



