I. INTRODUCTION
Banning of Pb due to the health and environmental concerns led to the development of lead-free solders. The Sn–Zn alloy system is considered a potential replacement of the Sn–Pb alloy because of its low eutectic temperature, low cost, and great mechanical properties.Reference Mittal, Kuo, Lin and Lin1–Reference Suganuma, Murata, Noguchi and Toyoda3 However, easy oxidation and poor wetting properties limit the applications of this solder system. Addition of elements like Ag, Al, and GaReference Yang, Messler and Felton4–Reference Yu, Wang, Hon and Wang10 in the Sn–Zn solder systems not only decreases their melting point but also improves wettability, mechanical properties, and oxidation resistance.
Due to its excellent electrical conductivity, copper is widely used in under-bump metallurgy and substrate metallization for flip chips and ball grid array applications in electronics assemblies. However, copper, as a substrate, rapidly reacts with the Sn in the solder and forms a large amount of intermetallic compounds (IMCs) at the solder/substrate surface, which weakens the solder joints.Reference Yu, Wang, Hon and Wang10, Reference Date, Shoji, Fujiyoshi, Sato and Tu11 For that reason, a thin layer of Ni over the Cu substrate (Ni/Cu) is used as a diffusion barrier.Reference Yoon, Lee and Jung12
A five-element solder Sn–Zn–Ag–Al–Ga (five-element) was developed few years ago in our lab,Reference Chen, Cheng, Wu and Lin9 which was found to suppress the IMC formed at the solder/substrate interface.Reference Lai, Lin and Salam13 Studies have been reported on the interfacial reactions of five-element solder with the Cu substrate,Reference Chen, Cheng, Wu and Lin9–Reference Date, Shoji, Fujiyoshi, Sato and Tu11 but few were undertaken with the Ni/Cu substrate. Therefore, the present work investigates the formation of IMCs in the solder and at the interface during the reflow of five-element solder on the Ni/Cu substrate. Emphasis is given on the influence of the reactivity of different elements in the solder and substrate on the formation of IMCs.
In almost all the previous reflow studies of five-element solder, room temperature solder is placed on the substrate heated at a preset reflow temperature. Since initial temperatures of the substrate and the solder are different, there is a thermal shock for the solder, which may affect the intermetallic reactions. For that reason, in the present study, reflow studies are carried out after keeping both the solder and the substrate at the same temperature in an infrared (IR) furnace. Temperature is increased gradually up to 230 °C under different heating rates, ranging from 36 to 180 °C/min.
II. EXPERIMENTAL
Eutectic five-element (Sn–8.5Zn–0.5Ag–0.01Al–0.1Ga) solder balls of 760-μm diameter and 99.99 wt%Cu plates were used in this study. For the Ni/Cu substrate, a 10- to 12-μm layer of Ni was electroplated on the Cu plates. Reflow studies were performed in an IR reflow furnace, equipped with four IR lamps fixed at four directions of the heating chamber. Rosin mildly activated (RMA) flux was applied to the Ni/Cu substrate, and the solder balls were placed on it. Adequate amount of the flux was used to ensure good wetting of the solder balls. The samples were then reflowed under six different heating rates, i.e., 180, 120, 90, 60, 45, and 36 °C/min, and coded as A, B, C, D, E, and F, respectively. The peak temperature was fixed at 230 °C, and the samples were isothermally heated for 1 min at this temperature. After reflow, the samples were cooled down to room temperature in the furnace.
The microstructures and morphology of the interfacial IMC of the reflowed samples were analyzed by the secondary electron mode of scanning electron microscope (SEM) using 15 keV beam energy, 10 mm working distance, 0° tilt angle, spot analysis mode. This SEM resolution can achieve 1.5 nm at 15 keV. The backscattered electron mode of SEM is also used to show the formation of different phases. Each sample was gold plated and investigated in secondary electron mode and in backscattering mode.
Measurements of atomic concentration of each element were carried out using energy-dispersive x-ray spectroscopy (EDX), which is equipped with the SEM. In this study, the electronic accelerating voltage is applied at 15 keV. Energy resolution of the EDX is under 140 eV (for Mnkα). The acquisition rate, dead time, and spectrum range of EDX analysis are set over 1 Kpcs, under 30%, and 0∼20 KeV, respectively. The analyzed elements are gathered, and their quantitative relationship can be calculated by the weight and atomic percentages. EDX system software was used to analyze the spectrum to determine the abundance of specific elements. EDX was also used to map and line scan for the elements’ detection in the bulk solder, the IMC layers, and the substrate.
III. RESULTS AND DISCUSSION
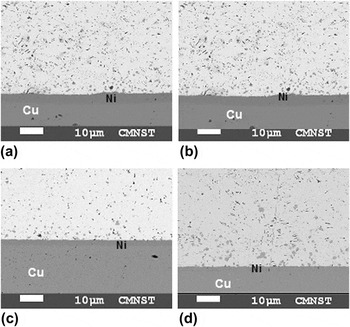
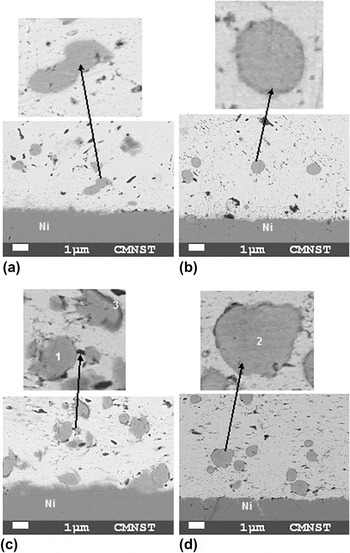
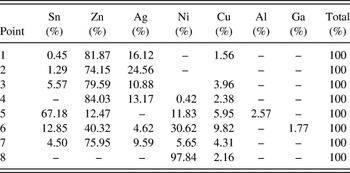
Figures 1(a)–1(d) displays SEM micrographs of the reflowed solder joints under the different heating rates. The micrographs show the presence of fine, dark needle-like structures and almost circular gray-colored precipitates in the solder. Upper micrographs of the same figure (Fig. 2) display the magnified views of the gray precipitates. Elemental analysis using EDX reveals the presence of high amount of Zn in the needles and Ag, Zn, and slight amount of Cu in the gray precipitates. This means that the needle-shaped structures are zinc-rich phases and the gray precipitates are Ag–Zn(Cu) compound. These precipitates in sample A [Fig. 2(a)] are attached with the Zn-rich particles. However, in samples D–F [Figs. 2(b)–2(d)], the precipitates are surrounded by the dark gray-color edge. Thickness of the dark border is more prominent at some places in sample E but uniform in sample F. EDX point analysis of the gray precipitate in Fig. 2 is provided in Table I. Point analysis in the middle of the gray precipitate at points 1 and 2 shows the Ag:Zn composition between 1:5 and 1:3 with small amount of Cu. According to Zn–Ag phase diagram,Reference Andrews, Davies, Hume-Rothery and Oswin14 the IMC is AgZn3. Higher amount of Zn in comparison to Ag and other elements shows that the diffusion of Zn is more. This is further shown by 1:7 Ag:Zn composition at point 3 at the edges of dark gray precipitates.
Low-magnification (500×) scanning electron microscope (SEM) micrographs of the Sn–8.5Zn–0.5Ag–0.01Al–0.1Ga solder balls reflowed on the Ni/Cu substrates under different heating rates. (a) A-180 °C/min, (b) B-120 °C/min, (c) C-90 °C/min, and (d) F-36 °C/min. White is the Sn matrix, while the gray net within this is the Zn phase.

High-magnification (3000×) SEM micrographs (lower) of the solder joints after reflowing Sn–8.5Zn–0.5Ag–0.01Al–0.1Ga solder balls on the Ni/Cu substrates under different heating rates. Upper micrographs show the magnified view of the AgZn3 precipitates in the Sn matrix. (a) A-180 °C/min, (b) D-60 °C/min, (c) E- 45 °C/min-E, and (d) F-36 °C/min. Elemental analysis at points shows (1) Sn 0.45, Zn 81.87, Ag 16.12, Cu 1.56; (2) Sn1.29, Zn 74.15, Ag 24.56; (3) Sn 5.57, Zn 79.59, Ag 10.88, Cu 3.96. Intermetallic compounds (IMCs) formed at the positions are (1, 2) AgZn3(Cu) and (3) Zn-rich phase.


It was shown in the previous studiesReference Lin and Shih15 that the formation of AgZn3 compound in the Sn–Zn–Ag solders takes place during the preparation of the solder and exists prior to the reflow. However, its amount amplifies after the reflow of the solder on substrate and increases with the decrease in the heating rate, as displayed in the upper micrographs in Figs. 1(a)–1(d). Further, the enhancement of AgZn3 compound (gray precipitates) during reflow is coupled with the reduction in the Zn-rich phase (needle-shaped structures). This indicates that the Zn from the Zn-rich phase reacts during reflow with the Ag in the solder and forms AgZn3 compound. Process escalates with the decrease in the heating rate because of the increase in the reflow time.
SEM micrographs of the reflowed samples A, B, and F in Figs. 2(a), 2(b), and 2(d) show negligible IMC at the interface between the Cu/Ni substrate and the solder. However, sample C shows the formation of low amount of IMC [Fig. 2(e)]. The reason for this abrupt behavior cannot be explained.
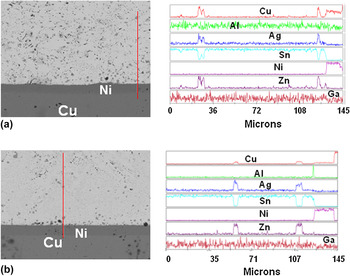
For further understanding of the behavior and reactions of different elements in the solder and the substrate during reflow, EDX line scan elemental studies were performed on the reflowed solder joints A and D, and results are displayed in Fig. 3. The left-hand side of the figure displays the micrograph of the line scan, whereas corresponding concentrations of the seven elements Cu, Ni, Al, Zn, Ga, Ag, and Sn along the line scan are shown at the right-hand side of the figure. In both samples, the line passes through the gray precipitates at two places. Corresponding elemental analysis shows the absence of Sn and presence of Zn and Ag in these gray precipitates, similar to the observation at points 1 and 2 in Fig. 2. Cu is nonexistent in the Sn matrix and interface but present in the gray precipitates and Ni substrate. In the solder, Cu follows the concentration pattern similar to Zn and Ag. This reveals the diffusion of Cu from the Cu substrate toward the solder through the Ni substrate and its association with the AgZn3 compound.
Energy-dispersive x-ray spectroscopy (EDX) line scan study of solder joints under low magnification after reflowing Sn–8.5Zn–0.5Ag–0.01Al–0.1Ga solder balls on the Ni/Cu substrates under heating rates of (a) A-180 °C/min and (b) D-60 °C/min.

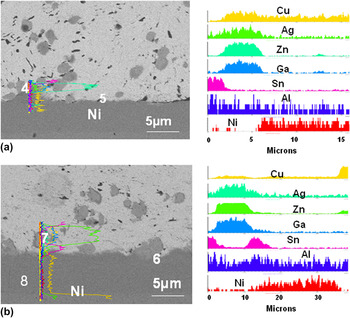
For determining more facts, the line scan studies were conducted near the interface under higher magnifications in samples B and E, and the results are displayed in Figs. 4(a) and 4(b), respectively. In both samples, line scans start in the solder matrix, follow the gray precipitates, and finish in the Ni substrate. The difference in the scans is the presence of solder between the gray precipitate and the interface in sample E. On the other hand, the gray precipitate is attached with the interface in sample B. Corresponding elemental analysis on the right-hand side shows the behavior of Cu similar to that in samples A and D in Fig. 3, and its amount is small as revealed by the point analysis in Table I. The scan also shows the linkage of the Ga with the AgZn3 gray precipitates but only near the interface. Al exists mostly at the interface (point 2 in Fig. 4). However, it is also detected at some places in the solder matrix.
EDX line scan and point study of solder joints under high magnification after reflowing Sn–8.5Zn–0.5Ag–0.01Al–0.1Ga solder balls on the Ni/Cu substrates under heating rates of (a) B-120 °C/min and (b) E-45 °C/min. Elemental analysis at points shows (4) Zn 84.03, Ag 13.17, Ni 0.42, Cu 2.38; (5) Sn 67.18, Zn 12.47, Ni 11.83, Cu 5.95, Al 2.57; (6) Sn 12.85, Zn 40.32, Ag 4.62 Ni 30.62, Cu 9.82 Ga 1.77; (7) Sn 4.50, Zn 75.95, Ag 9.59, Ni 5.65, Cu 4.31; (8) Ni 97.84, Cu 2.16. IMCs formed at the places are (4) AgCuZn3, (5) Al-Zn-Cu, (6) AgCuGaZn3, (7) AgCuZn3 + Zn-rich phase at the corners, (8) Cu diffusion into Ni.

On the basis of the above observations, detailed mechanism during reflow of the five-element solder on Cu/Ni is sketched in Fig. 5.
Illustrations showing the formation of different compounds in the solder matrix and at interface during reflow of a five-element (Sn, Zn, Ag, Ga, Al) solder on Ni/Cu substrate. (a) Before reflow, (b) during reflow, (c) during reflow and aging, and (d) after reflow.

Before reflow, as shown in Fig. 5(a), the solder, which kept above the substrate, contains five elements Zn, Ag, Sn, Ga, and Al and one AgZn3 compound, whereas the substrate is a 12-μm Ni-coated Cu sheet.
During heating above the melting temperature of the solder, reflowing of the solder starts on the substrate. At the start of reflow, as depicted in Fig. 5(b), different elements present in the liquid solder, including Sn, diffuse into the solder matrix and move toward the Ni/Cu substrate. Some of the Zn that diffused into the solder matrix reacts with the Ag in the solder and forms AgZn3 compound, and the rest moves toward the substrate. At the same time, Ni diffuses from the solid substrate and progresses toward the liquid solder. It was observed in the earlier studies that the diffusion of Sn or Zn in Ni substrate controls the formation of Ni–Sn IMC(s), while the diffusion of Ni in liquid Sn–Zn alloy forms Ni–Zn IMC.Reference Zhu, Liu, Wang, Ma and Jin16 Since the diffusion of Ni in the liquid solder is much faster than that of Sn or Zn in the solid substrate, mostly Ni–Zn compounds are formed at the interface. Further, the mixing enthalpy of Ni and Zn is −9 kJ/mol and that of Ni and Sn is −4 kJ/mol.Reference de Bore, Boom, Mattens, Miedema and Niessen17, Reference Zhang, Guo and Shang18 Higher negative value shows strong attraction between Ni and Zn and preference of Ni atoms to react with Zn atoms over Sn atoms. According to the Ni–ZnReference Nash, Pan and Nash19 and Ni–Zn–SnReference Massalski, Okamoto, Subramanian and Kacprzak20–Reference Liang, Du, Tang, Xie, Xu, Zeng, Liu, Zhu and Nong26 phase diagrams, Ni–Zn compounds like Ni5Zn21Reference Liou and Yen21 should be formed at the interface. However, Zn amount at the interface is much less in the present case when compared with the reflow of Sn–Zn/NiReference Mittal, Kuo, Lin and Lin1 because of the formation of AgZn3 compound in the solder. This results in very little IMC formation at the interface, as observed in the micrographs in Figs. 1 and 2.
The reason for the Zn preference for reacting with Ag over Ni is the easy availability of Ag in the solder matrix. Although AgZn3 precipitates exist in the solder even before reflow,Reference Chen, Xue, Wang, Wang and Han27 their number and size increase after reflow. Even though Ag can react with both Sn and Zn in the solder, reaction with Zn is preferred over Sn because of the low Gibbs free energy of AgZn3. Standard function of molar reaction of AgZn3 is –36.5 KJ/mole compared to –14.2 KJ/mole of AgSn3.Reference Hultgren, Desai, Hawkins, Gleioser and Kelley28, Reference Zou and Zhang29
Further reflowing and aging of the solder, as shown in Fig. 5(c), results in slight diffusion of Sn in the AgZn3 IMC. According to the Zn–Ag–Sn phase diagram,Reference Jao, Yen, Lin and Lee30 when Sn diffuses into the AgZn3 IMC, Zn starts to diffuse out from it. Additionally, surface of the AgZn3 IMC provides a site for heterogeneous nucleation and precipitation of Zn.Reference Hsuan and Lin31 This leads to the formation of Zn-rich compound in the vicinity of the AgZn3 IMC. With the decrease in the heating rate, the samples have more time to stay at each temperature. As a result, enlarged Zn-rich phases are formed at the boundaries of AgZn3 IMCs in samples D–F. Diffusion of Cu in Sn matrix is highly favorable even better than ZnReference Date, Tu, Shoji, Fujiyoshi and Sato32 owing to low activation energy of 33.02 KJ/mole (activation energy of Zn is 50.2 KJ/mole). In the present study, diffusion of Cu from Cu sheet should be prevented by the 12-μm electroplated Ni layer, but it is observed by the presence of Cu inside the electroplated Ni (point 6 in Fig. 4) and at the interface linked to Ni surface (point 4 in Fig. 4). This diffusion may be due to the columnar structure of electroplated Ni layer. It is estimated that the Cu atoms may be diffused through the grain boundaries of Ni layer.Reference Huang, Duh, Chen and Wang33 It has been calculated in one studyReference Huang, Jang and Duh34 that the number of diffused Cu atoms through 3-μm electroplated Ni layer is 1015–1016/cm2. This diffusion decreases with the increase in the thickness of Ni layer. As thickness of Ni layer is four times higher in the present case, the number of Cu atoms diffused through Ni is lower. However, diffusion increases with the increase in temperature or longer isothermal heating at one temperature. Although final treatment temperatures in the present study are same in all the experiments, the time spend by each sample during the temperature range is different. In sample A, temperature reaches from 198 to 230 °C only in 10.8 s, whereas in sample F, 52 s is needed to reach this temperature. So the time of stay at each temperature in sample F is 5/3 s compared to 1/3 s in sample A and 4/3 s in sample E. Therefore, higher Cu diffusion is observed with the decrease in the heating rate in samples A–F.
Cu–Zn–Sn ternary phase diagram shows that diffused Cu atoms can either react with Sn or ZnReference Chang, Neumann, Mikula and Goldberg35–Reference Huang, Chen, Chou and Gierlotka38. As described in the above sections, Cu is only found to be linked with AgZn3 in solder matrix and not observed with Sn. This may be due to the greater reactivity of Cu toward Zn than Sn because of low Gibbs free energy for the formation of Cu–Zn compounds (−11.48 KJ/mole) than Cu–Sn compounds (−7.63 KJ/mole).Reference Chuang, Hung, Liu and Lin39, Reference Hultgren, Desai, Hawkins, Gleiser and Kelley40 As most of the Zn is available as AgZn3 IMC in the solder, Cu dissolves in Zn–Ag phase and replaces some Ag atoms to form Cu–Zn (Cu5Zn8) compound. The Ag–Cu–Zn ternary phase diagram shows 14.3 at.% solubility of Cu in AgZn3 and 48.6 at.% solubility of Ag in Cu5Zn8 compound.Reference Liou and Yen21, Reference Hultgren, Desai, Hawkins, Gleiser and Kelley40 The Ag–Zn and Cu–Zn exhibit Ag5Zn8 and Cu5Zn8 compounds, respectively. Both compounds are having same space group of I43 (217) with the Pearson symbol of CI52.Reference Yu and Lin41
Ga does not participate in the interfacial reactions but lowers the activation energy of wetting reaction due to its dissolution in the Zn phase.Reference Liu and Lin42 It is only observed at the interface in the AgZn3 compound. Since the atomic radii of Zn and Ga, 0.133 and 0.135 nm, respectively,Reference Liu and Lin43 are very close, Ga may dissolve in the AgZn3 compound and partially replace the site of Zn atoms. It is not clear whether it first dissolves in the Ag–Zn phase and moves toward the interface or first moves to the interface and then dissolve there.
Al condenses easily at the interface and stopped the reaction of Ni and Zn at the interface.Reference Chang, Lin and Hsieh44 This may be one of the reasons for the nonformation of the Ni–Zn IMC at the interface as in the Sn–Zn/Ni/Cu system.Reference Mittal, Kuo, Lin and Lin1 Similarly, in Sn–Zn–Al/Cu system, Al reacts with Zn and Cu and forms Al–Cu–Zn compound at the interface, which prevents the formation of Cu–Sn compounds.Reference Chang, Lin and Hsieh44, Reference Raghavan45 This is shown by the presence of Cu with Al and Zn at the interface (point 2). However, it is difficult to conclude in the present study because of the presence of large amount of Sn and very small amount of Al and diffused Cu.
Solder joints after reflow, as shown in Fig. 5(d), show very low amount at IMC at the interface including Al–Zn, Ni–Zn, Ni–Sn, and Zn–Ag–Zn–Ga at the interface between the solder and the substrate. The extensive formation and growth of the Cu–Sn IMC in some Pb-free solder systems may result in gathering of thermal stress at the IMC/solder interface. Use of alloying elements (e.g., Al, Ag, and Ga in the present study) in the Sn–Zn solder not only improves its oxidation resistance and other properties but also slows down the formation of IMC at the solder/substrate interface. Increase in the treatment time by decreasing the heating increases the diffusion of Zn in the solder matrix and Cu and Ni from the substrate, resulting in the increase in IMC thickness at the interface in samples E and F. However, IMC formed is much lower than that in the Sn–Zn/Ni/Cu system.Reference Mittal, Kuo, Lin and Lin1
IV. CONCLUDING REMARKS
Formation of thin IMC layer at interface was observed during the reflow of Sn–8.5Zn–0.5Ag–0.01Al–0.1Ga (five-element) solder on the Ni/Cu substrate under different heating rates. Zn and Ag–Zn amounts in the solder were reciprocally changed with the decrease in the heating rate. Diffused Cu through the electroplated Ni layer was detected only in Ag–Zn compound and increased with the decrease in the heating rate. Ga and Al were mostly observed at the interface. Ga was present in the Ag–Zn matrix, whereas Al was found as Al–Cu–Zn compound after reacting with Zn and Cu.
ACKNOWLEDGMENTS
The support of this study by the National Science Council (NSC) of the Republic of China (Taiwan) under Grant NSC98-2211-E-006-MY3 is gratefully acknowledged. One of authors (J. Mittal) is grateful to NSC for his financial support during the course of this work under Grant NSC98-2811-E-006-059.