Implications
The measures which comprise the Welfare Quality ® assessment protocol for dairy cows are important and relevant for welfare assessment. The measure aggregation system provides a way of integrating these measures into an overall classification. The finding that the score for Absence of prolonged thirst, which represents only a single aspect of welfare, can reliably predict the overall classification, suggests that the measure aggregation system is not fulfilling the original aim of the protocol, by synthesising appropriately the multidimensional nature of welfare into a balanced summary measure. Understanding the nature of the measure aggregation system in this light is important for those considering using it.
Introduction
Scientifically robust and feasible welfare assessment protocols are vital to the role farm assurance schemes play in safeguarding farm animal welfare. Where previously, welfare assessment protocols have been concerned with the provision of resources, animal-based assessments are now considered to provide a more direct account of welfare (Webster et al., Reference Webster, Main and Whay2004), and are recommended to be included in welfare assessments (Farm Animal Welfare Council, 2005). Animal-based measures include behavioural and physical observations and have the potential to assess welfare according to a definition which incorporates both physical and mental health (Dawkins, Reference Dawkins2003).
The holistic nature of the Welfare Quality® protocol reflects current understanding of welfare as a multidimensional construct (Fraser and Broom, Reference Fraser and Broom1990), however, the time taken to carry out such an extensive assessment has been cited as limiting the potential for its practical application (Knierim and Winckler, Reference Knierim and Winckler2009; Blokhuis et al.,. Reference Blokhuis, Veissier, Miele and Jones2010; de Vries et al., Reference de Vries, Engel, den Uijl, van Schaik, Dijkstra, de Boer and Bokkers2013c). According to the timings provided in the protocol, the time taken for a Welfare Quality ® assessment of an average UK herd of 125 dairy cows (DairyCo, 2013) would be 7 h (Welfare Quality ® , 2009). This is currently beyond the scope of farm assurance schemes, therefore any means of reducing the length of time taken for an assessment while maintaining accuracy would be beneficial. Previous work aimed at reducing the length of the assessment has demonstrated that, ‘Replacing a set of animal-based Welfare Quality ® indicators belonging to one assessment method with predictions based on remaining Welfare Quality ® indicators showed little scope for reduction of on-farm assessment time of the Welfare Quality ® protocol for dairy cattle’ (de Vries et al., Reference de Vries, Engel, den Uijl, van Schaik, Dijkstra, de Boer and Bokkers2013c).
As an alternative line of investigation, a theoretical notion of animal-based ‘iceberg indicators’ has been proposed. ‘An “iceberg” indicator provides an overall assessment of welfare, just as the protruding tip of an iceberg signals its submerged bulk beneath the water’s surface’ (Farm Animal Welfare Council, 2009). If these proposed indicators could be found to reliably provide information about the welfare state of animals, assessments could be limited to those specific measures, and the time taken for an assessment could be reduced accordingly. Although work in this area remains theoretical, a potential candidate for an iceberg indicator might be the Qualitative Behaviour Assessment (QBA). Wemelsfelder et al. (Reference Wemelsfelder, Hunter, Mendl and Lawrence2001) suggest that QBA ‘…reflects a “whole-animal” level of organisation, which may guide the interpretation of behavioural and physiological measurements in terms of the animal’s overall welfare state’. This connection between QBA and the overall welfare state is proposed to be due to the integrative nature of QBA, whereby the behavioural descriptors which comprise the assessment can be understood as expressing the qualitative nature of the animal’s experience (Wemelsfelder et al., Reference Wemelsfelder, Hunter, Mendl and Lawrence2001; Wemelsfelder, Reference Wemelsfelder2007). With QBA in mind then, the aim of this study was to use modelling approaches that would predict the overall classification based on a subset of the measures, with a view to potentially finding a means of reducing the time taken to carry out an assessment.
Material and methods
Data collection
The collection of the data used in this paper, along with a list of the measures and any missing values associated with those measures, has been previously described in Heath et al. (Reference Heath, Lin, Browne, Mullan and Main2014). Briefly, full Welfare Quality ® assessments were carried out on 92 dairy farms located in England and Wales. The farms were voluntary participants from three farm welfare assurance schemes, RSPCA Freedom Food, Soil Association Certification, and the Red Tractor Farm Assurance Dairy Scheme, and each assurance scheme recruited farmers independently. Data were collected by seven employed assessors who had received standardised training in the Welfare Quality ® assessment protocols. Inter-assessor reliability testing of the assessors was conducted, and is described in Heath et al. (Reference Heath, Lin, Browne, Mullan and Main2014). The assessments took place between January and August 2011, each by an individual assessor during a single farm visit, immediately after morning milking, according to the protocol guidelines. Measures are defined, in this study, as independent units of data as required by Welfare Quality ® , from which the aggregated scores are calculated. The data consists of 58 measures associated with herd level data, and 4 measures which relate to the provision of drinkers and access to pasture which were collected at the group level, where a herd may be made up of a number of groups of cows. For the purpose of this study, these group level measures have been considered as their aggregated herd level criteria scores, Absence of prolonged thirst and Expression of other behaviours. Similarly, as the QBA terms are not intended to be considered individually, the aggregated score of Positive emotional state, which refers to the version of QBA included in the Welfare Quality ® protocol, has been used throughout the analysis instead.
Analysis of Welfare Quality® assessment
The data were analysed according to the Welfare Quality ® protocol for dairy cows (Welfare Quality ® , 2009). The protocol provides formulae or decision trees for the calculation of 12 criteria scores formed by combining the collected measures. The 12 criteria scores are then aggregated into four principle scores by applying the mathematical technique of Choquet integrals. Finally, an overall classification is calculated based on thresholds applied to the four principle scores. Owing to some errors in the printed version of the protocol, further revisions were applied (Veissier, I., personal communications, April and May 2012); Up to date versions of the calculations were programmed using the program R (R version 2.14.1) by the first author. All other analyses were carried out using Microsoft Excel (2010).
Missing data
Owing to the hierarchical nature of the scoring system, a single missing value from an assessment prevents the calculation of the overall classification of a farm. For this reason, it was necessary to fill in the missing data. For continuous measures, missing data were filled in using the observed mean value of the respective farm assurance scheme. For categorical data the observed modal value for the respective farm assurance scheme was used. With two exceptions, a similar method was applied to group level data using the modal or mean value for the farm, depending on whether the data were categorical or continuous. Firstly, when this was not available, for categorical data, the mode value for the respective farm assurance scheme was used. Secondly, for Number of water troughs, the number used to fill in the missing data corresponded to the ratio of the number of troughs to the number of cows in the group, based on other groups on the farm. In accordance with what would normally be expected on UK farms, data relating to measures which were universally omitted were filled in to indicate no routine tail docking, no tethering, no water bowls, and Water flow was also filled in as the water flow test had not been carried out, on the basis that, ‘In the case of troughs with a large reservoir, this test does not have to be carried out. Water flow is then set to 20 l/min’ (Welfare Quality ® , 2009, p. 79).
Statistical analyses
To assess how well individual indicators or groups of indicators were able to predict higher levels of measure aggregation, at the principle or overall classification, a randomly drawn sample of half the data set of 92 farms was drawn. This was used as a ‘training’ set from which the coefficients for the model variables were established, and the remaining 46 farms were set aside as a ‘test’ set. By excluding the test set from the model building process, this allowed the models to be tested on hitherto ‘unseen’ data, thus providing a means of cross-validation. For each model the process of splitting the data set into ‘training’ and ‘test’ sets was repeated 1000 times. The accuracy of the models was defined as the proportion of times that the farms from the ‘test’ set were predicted as having the same classification as calculated from their actual Welfare Quality ® assessment.
For the overall classification, only two categories were observed in our data, acceptable and enhanced, and it was therefore possible to build logistic regression models to relate groups of welfare indicators to the overall Welfare Quality ® classification. In the initial stage of selecting which variables to include, a correlation threshold with the overall classification was applied (0.200). Then, additional variables were excluded on the basis of co-linearity. Finally, further variables were removed when the models failed to execute on account of limited variability associated with those variables. A summary of the models is included in Table 1. All possible values for the threshold were tested for each ‘training’ set. The value for the threshold that was associated with the greatest proportion of correctly classified farms within the ‘training’ set was then used on the ‘test’ set. As well as the accuracy of the models, the sensitivity and specificity were also calculated based on the ‘test’ set.
In terms of the principle level scores, for Appropriate behaviour, only two categories were observed in our data, and it was possible to carry out the same methodology as applied for predicting the overall classification, but this time including all the welfare indicators associated with Appropriate behaviour. For the remaining principles, where more than two classifications were observed, models based on linear discriminant analysis were used. For the principle Good health insufficient variation of a number of welfare indicators resulted in their exclusion from the models. This related largely to a low prevalence associated with certain health measures, that is, most of the data was 0 as opposed to missing, and this has been reported elsewhere with regard Welfare Quality ® (e.g. de Vries et al., Reference de Vries, Bokkers, van Schaik, Engel and de Boer2013b).
Summary of measures included in models used to predict scores/classifications at higher levels of aggregation of the Welfare Quality ® protocol for dairy cows
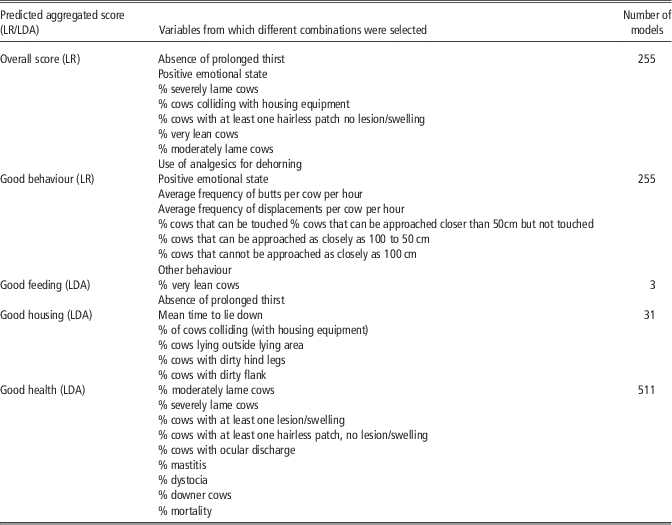
LDA=linear discriminant analysis; LR=logistic regression.
Results
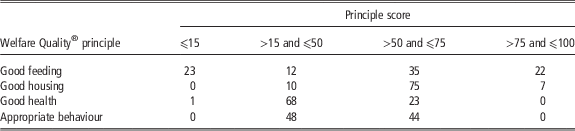
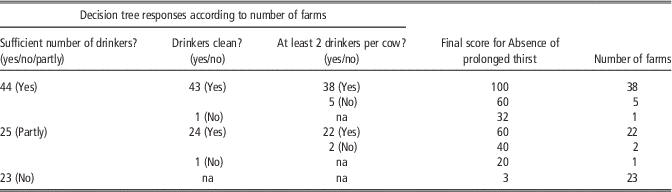
The percentage of farms with missing data for criteria level scores ranged from 0% to 74% (for Absence of pain induced by management procedures procedures). This was excluding measures associated with routine tail docking, presence of tethering, presence of water bowls, and water flow. 5% of farms had missing data for the Welfare Quality ® criteria Positive emotional state, and 18% of farms had missing data for the Welfare Quality ® criteria, Absence of prolonged thirst. In our data set, all farms were classified either as enhanced (57 farms) or acceptable (35 farms). A χ 2 test was performed, and no association was found between overall classification and whether the cows were at pasture or housed indoors χ 2 (2, n=92)=0.04, P=0.84. The distribution across the classification thresholds for the principle scores is shown in Table 2. The composition of Absence of prolonged thirst is shown in Table 3.
Distribution of Welfare Quality ® principle scores according to thresholds for overall classification from an assessment of 92 farms in England and WalesFootnote 1
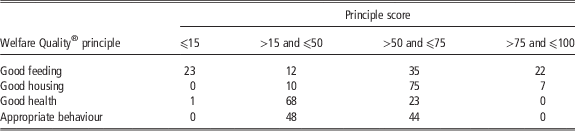
1 Welfare Quality ® Overall classifications are calculated using the following rules: excellent: score >50 on all principles, and >75 on two; enhanced: score >15 on all principles, and >50 on two; acceptable: score >5 on all principles, and >15 on two; not classified: failure to meet the above criteria.
Decision-tree responses used to calculate the Welfare Quality® criteria ‘Absence of prolonged thirst’ for 92 dairy farms in England and WalesFootnote 1
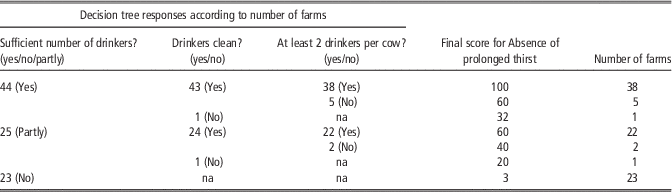
1 According to the Welfare Quality protocol (Welfare Quality ® 2009), Absence of prolonged thirst is assessed at the group level, whereby the lowest group score is recorded, provided that that group contains at least 15% of the cows in the herd, otherwise the group with the next lowest score is considered. For trough drinkers, a sufficient number of drinkers is defined as having at least 6 cm of trough per cow, partly sufficient is defined as having at least 4 cm of trough per cow.
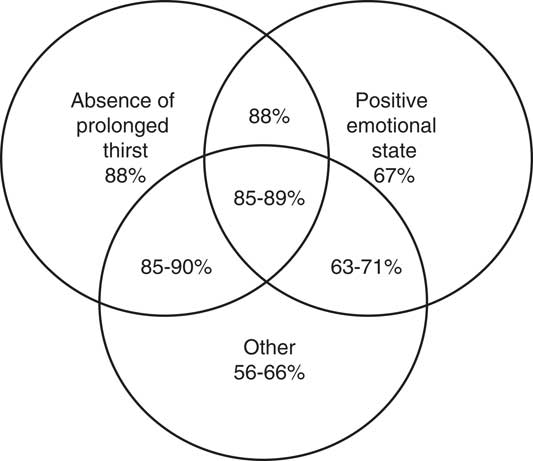
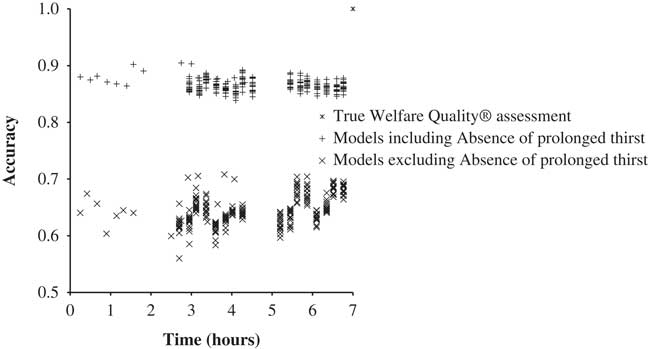
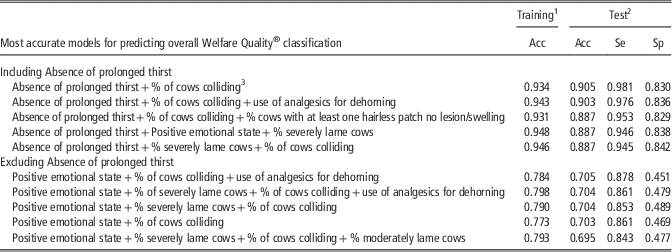
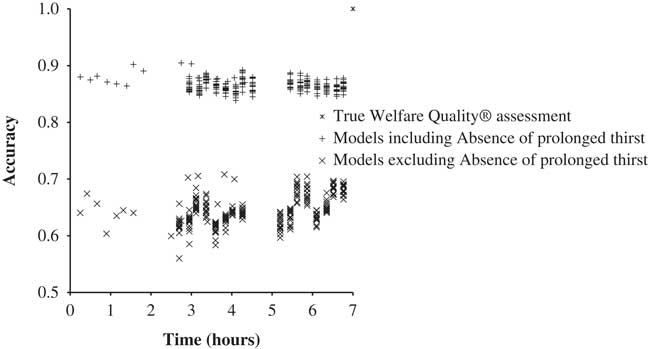
Figure 1 shows that, the predictive ability of the models ranged from 56% to 90%. Absence of prolonged thirst alone was able to correctly classify farms 88% of the time. Positive emotional state, the term given to the version of QBA included in the Welfare Quality ® protocol, was less effective, and on its own, it only achieved 67% predictive accuracy. When included with Absence of prolonged thirst, it did not improve the predictive ability of the model. Intuitively, one might expect a longer assessment time to result in a higher degree of accuracy, however, as shown in Figure 2 this was not the case. Table 4 shows the best performing models including and excluding Absence of prolonged thirst for correctly predicting overall classification. The models including Absence of prolonged thirst show both good sensitivity and specificity. The relatively lower specificity suggests that there is more chance of farms being underscored and classed as acceptable when they are enhanced, than farms being over-scored and being classed as enhanced when they are in fact acceptable. The sensitivity and specificity of the models depends on the threshold.
Accuracy of logistic regression models for predicting the overall Welfare Quality® classification of 46 ‘unseen’ randomly sampled dairy farms in England and Wales, highlighting models which include the variables Absence of prolonged thirst and Positive emotional state.
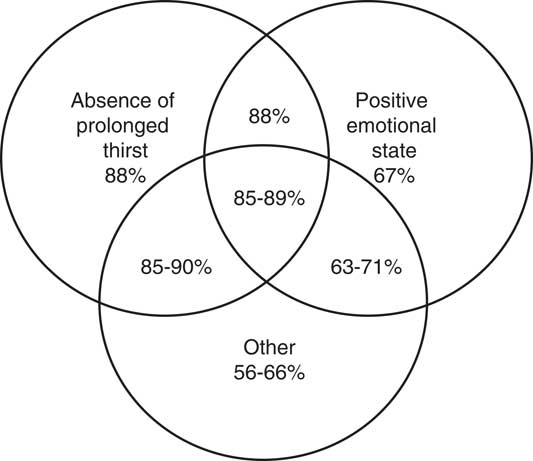
Accuracy of models, including and excluding the variable Absence of prolonged thirst, in predicting the overall Welfare Quality® classification tested on 46 randomly sampled, ‘unseen’ farms in England and Wales, relative to the true Welfare Quality® assessment.
Most accurate models including and excluding the Welfare Quality ® criteria score ‘Absence of prolonged thirst’ for predicting the overall Welfare Quality ® classification
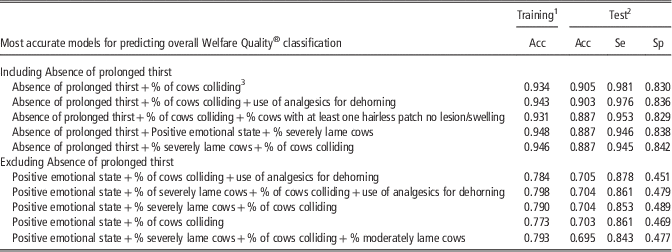
Acc=accuracy, the proportion of times that, as part of the repeated process of building and testing the models on different random draws of 46 farms, the calculated Welfare Quality® classification is predicted; Se=sensitivity; Sp=specificity.
1 Training=the training set corresponds to a random draw of 46 farms which were used to build the models.
2 Test=the test set corresponds to the remainder 46 farms excluded from the training set.
3 % of cows colliding with housing equipment.
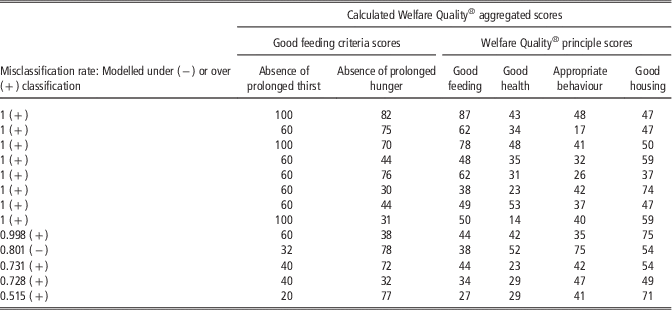
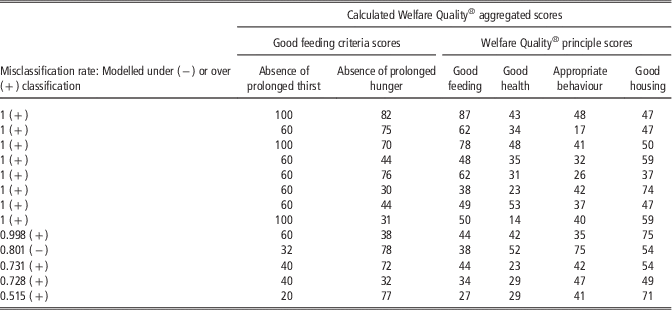
In response to the original research question, the model including only Absence of prolonged thirst would provide the shortest assessment time with a high degree of accuracy. In terms of the costs associated with misclassification, of the most accurate models, this model has the smallest risk of over-scoring, thus maximising the chances of correctly identifying farms with lower levels of welfare. However, several farms shown in Table 5 were consistently misclassified. The mean misclassification rate of the remaining farms was very small (0.0004).
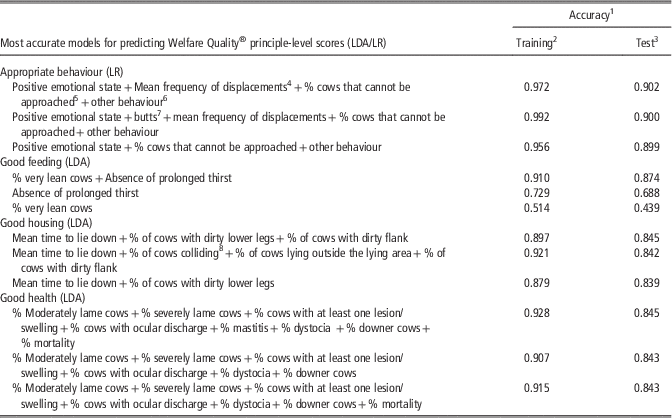
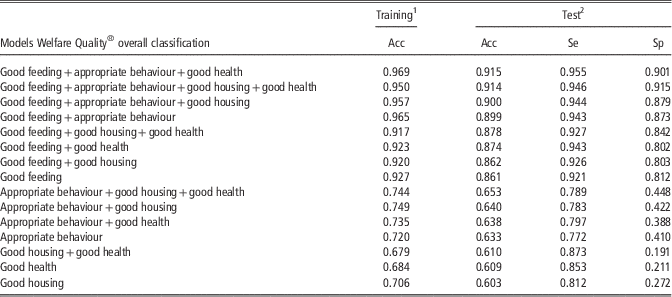
In addition to modelling the overall classification, it is interesting to examine which measures are important in driving the principle level scores. Table 6 shows that all principles could be modelled effectively. In contrast to what was observed at the overall level, at the principle level, Positive emotional state, does appear to be important in determining Appropriate behaviour, with its removal from the models being associated with a decrease in predictive ability from 0.824 to 0.549 (not shown). In turn, Table 7 shows Good feeding is associated with the most accurate models for predicting the overall classification. These results strongly emphasise the role of Absence of prolonged thirst in the Welfare Quality ® overall classification.
Summary of individual ‘unseen’ farms that were consistently misclassified at a rate of >0.50 when predicting the overall classification using only ‘Absence of prolonged thirst’ as a single variable in the model
Summary of most accurate models for predicting Welfare Quality ® principle-level scores
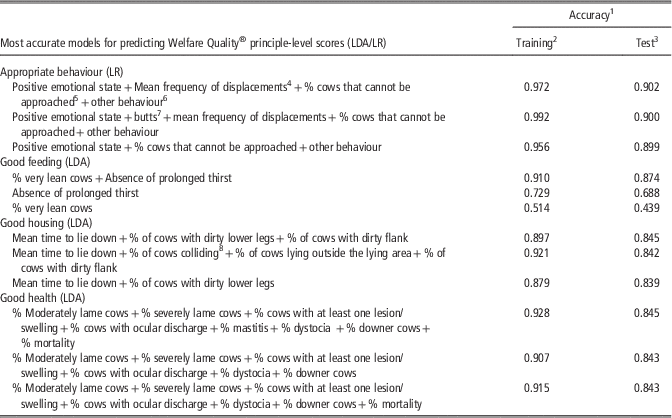
LDA=linear discriminant analysis; LR=logistic regression.
1 Accuracy is the proportion of times that, as part of the repeated process of building and testing the models on different random draws of 46 farms, the calculated Welfare Quality ® classification is predicted.
2 Training=the training set corresponds to a random draw of 46 farms which were used to build the models.
3 Test=the test set corresponds to the remainder 46 farms excluded from the training set.
4 Average frequency of displacements per cow per hour.
5 % cows that cannot be approached as closely as 100 cm.
6 Expression of other behaviour.
7 Average frequency of butts per cow per hour.
8 % of cows colliding with housing equipment.
Principle-level models for predicting the Welfare Quality® overall classification
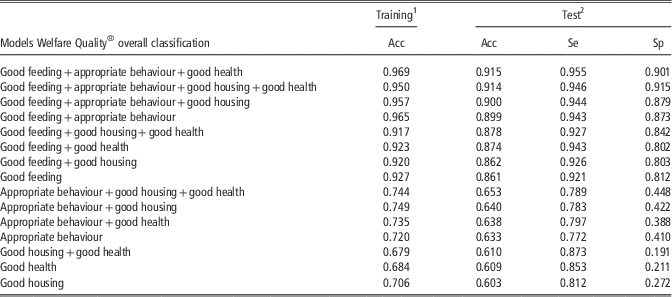
Acc=accuracy, the proportion of times that, as part of the repeated process of building and testing the models on different random draws of 46 farms, the calculated Welfare Quality® classification is predicted; Se=sensitivity; Sp=specificity.
1 Training=the training set corresponds to a random draw of 46 farms which were used to build the models.
2 Test=the test set corresponds to the remainder 46 farms excluded from the training set.
Discussion
The aim of this study was to investigate potential ‘iceberg indicators’, with the overall Welfare Quality ® classification as the gold standard, as a means of reducing the length of time taken to carry out a Welfare Quality ® assessment on dairy cows. As with a previous study by de Vries et al. (Reference de Vries, Bokkers, van Schaik, Botreau, Engel, Dijkstra and de Boer2013a), no excellent farms were found in the sample, and the analysis here was limited to acceptable and enhanced farms. The results show that by only measuring Absence of prolonged thirst (Welfare Quality® criteria score) for an assessment time of 15 min, the correct welfare classification can be achieved 88% of the time. While individual parameters within the Welfare Quality ® protocol have been shown to be relevant to animal welfare, including those associated with Absence of prolonged thirst, the finding that a single, resource-based score can predict well the overall result is a significant challenge to the published Welfare Quality ® aggregation system. Concern over the poor discriminatory ability of the overall Welfare Quality ® classification has recently led Eerdenburg (2013) to propose an adapted version of the measure aggregation system which included, among other changes, the recalibration of the score for Absence of prolonged thirst for what was considered to be an improvement in the overall classification of farms.
Missing data were an issue in this study, and are indeed an issue for the Welfare Quality ® measure aggregation system in general (Heath et al., Reference Heath, Lin, Browne, Mullan and Main2014). The methods used here to fill in the missing values were often fairly simple (mean imputation) and could potentially therefore have reduced the variation in some measures between farms. For example, in the case of the measure Length of troughs: where the measure was available for other groups on the farm, then the mean of those groups was used, however, where the measure was not available for any group on the farm, then the mean for the farm assurance scheme was used. Filling in a measure as the same for all groups on a farm (which occurred for 14% of farms for this measure), clearly reduces variability within farm, and is a deficiency of this method of imputation, although it should be noted that 68% of farms only had one group and so were unaffected by this imputation. In order to account for missing data at both the herd and group level, multi-level multiple imputation would be a more sophisticated alternative (see e.g., Goldstein et al., Reference Goldstein, Carpenter and Browne2014) which is not so susceptible to the same issues of reduction in variation. However, it was considered that the application of such a method to fill in the missing data would not have added anything to the illustrative purposes of this study and may have instead lost some of the readership through its added complexity.
Returning to the original research question, as an iceberg indicator for Welfare Quality ® , Absence of prolonged thirst could be argued to have a multi-dimensional impact on welfare, albeit as a resource-based measure. Water is the most important nutrient for dairy cows, essential for health and productivity, (National Research Council, 2001), and water deprivation is associated with increased aggression and less time spent lying down (Little et al., Reference Little, Collis, Gleed, Sansom, Allen and Quick1980). Given that water intake may be influenced by the dimensions of the drinkers (Machado Filho et al., Reference Machado Filho, Teixeira, Von Keyserlingk, Weary and Hötzel2004; Teixeira et al., Reference Teixeira, Hötzel and Machado Filho2006), and water flow rate (Andersson et al., Reference Andersson, Schaar and Wiktorsson1984), the measures included for Absence of prolonged thirst, reflect a fundamental aspect of welfare. Furthermore, Absence of prolonged thirst could also be considered to be a proxy measure of management standards, such that the care that a farmer might show in providing a sufficient number of clean drinkers might be expected to be found in other areas relating to welfare. So, while adequate water provision is an essential element in preventing poor welfare, as a resource-based measure, it is unable to provide an actual account of the cow’s thirst, and therefore, might be better considered as part of a risk-based assessment. As thirst is influenced by other factors including climate, milk yield, dry matter intake (Cardot et al., Reference Cardot, Le Roux and Jurjanz2008), and social hierarchy (Andersson et al., Reference Andersson, Schaar and Wiktorsson1984), the measure also risks either being overly penalising or overly lenient for farms at the extreme ends of these variables. This is increased by the method of score calculation which assigns discrete scores by means of a decision tree. Furthermore, the validity of this measure has been questioned by Tuyttens et al. (Reference Tuyttens, Vanderhasselt, Federici, Sans, Molento, Goethals, Buijs and Duchateau2013) who reported that the Welfare Quality ® criteria score for Absence of prolonged thirst in broilers was not found to be associated with a corresponding animal-based measure.
Positive emotional state, on the other hand, is a holistic, animal-based measure, which might have been expected to have a greater ability to discriminate farms than it did. QBA can take one of two forms, the free-choice profiling format where descriptive terms are elicited from the assessors themselves, or the fixed term format where designated terms are rated by assessors according to what they find, and is the form found in the Welfare Quality ® protocols. Compared to the free-choice profiling format, where QBA has been associated with physiological welfare indicators in cattle and steers (Stockman et al., Reference Stockman, Collins, Barnes, Miller, Wickham, Beatty, Blache, Wemelsfelder and Fleming2011 and Reference Stockman, McGilchrist, Collins, Barnes, Miller, Wickhama, Greenwood, Cafe, Blache, Wemelsfelder and Fleming2012), and induced emotional states in pigs (Rutherford et al., Reference Rutherford, Donald, Lawrence and Wemelsfelder2012), QBA as part of the Welfare Quality ® protocol has not been found to be associated with other measures in veal calves (Brscic et al., Reference Brscic, Wemelsfelder, Tessitore, Gottardo, Cozzi and Van Reenen2009), or beef cattle (Kirchner et al., Reference Kirchner, Schulze Westerath-Nicklaus, Gutmann, Pfeiffer, Elena, Giulio, Knierim and Winckler2012). In terms of inter-assessor agreement, the evidence is also mixed for the fixed term format with high levels of inter-observer agreement having been reported in sheep (Phythian et al., Reference Phythian, Nichalopoulou, Duncan and Wemeldsfelder2013), but only ‘slight to moderate’ agreement for Welfare Quality® QBA in dairy cows (Bokkers et al., Reference Bokkers, de Vries, Antonissen and de Boer2012). In addition, QBA has been found to be influenced by time of day (Schwed, Reference Schwed2013), though perhaps this can be understood as relating to changes in the environment, which have been found to be reflected by QBA in veal calves (Brscic et al., Reference Brscic, Wemelsfelder, Tessitore, Gottardo, Cozzi and Van Reenen2009) and similarly, by pigs in enriched environments (Mullan et al., Reference Mullan, Edwards, Butterworth, Whay and Main2011).
Nevertheless, Positive emotional state is the only measure of positive welfare included in the Welfare Quality ® protocol. Recent advances propose that welfare should move beyond the focusing on the absence of negative states to also encompass positive experiences or positive welfare (Boissy et al., Reference Boissy, Manteuffel, Jensen, Moe, Spruijt, Keeling, Winckler, Forkman, Dimirov, Langbein, Bakken, Veissier and Aubert2007; Yeates and Main, Reference Yeates and Main2008; Farm Animal Welfare Council, 2009). If welfare is thought of as a continuum from negative welfare at one end to positive welfare at the other, and if Absence of prolonged thirst is understood to be only associated with thirst and is the driver for the overall classification, the implication is that excellent farms can only be considered to reflect a neutral state of welfare, as an absence of suffering does not signify positive welfare (Yeates and Main, Reference Yeates and Main2008). However, if Absence of prolonged thirst is instead considered to be a proxy measure for management, then it may indeed be suggestive of higher levels of welfare. Positive emotional state, in theory, had the potential to extend the scope of the Welfare Quality ® protocol to include positive welfare, however in practice this was not observed, either because of the weightings assigned to the measure, because of issues arising from inter observer reliability, or because of limited variability. While this study did not look at the individual QBA descriptors, interestingly, de Vries et al. (2013a) found acceptable farms had lower scores than enhanced farms for the terms ‘happy’ and ‘relaxed’. With an absence of any further feasible animal-based measures of positive welfare, behavioural opportunities have been proposed by the Farm Animal Council as being important for a ‘good life’ for farm animals (Farm Animal Welfare Council, 2009). This recommendation is reflected in the ‘citizen juries’ conducted as part of the Welfare Quality ® project, where members of the public considered that the classification excellent should only be applied to farms which had extensive systems of production with outdoor access (Miele et al., Reference Miele, Evans and Higgin2010). A measure of outdoor access is included in the Welfare Quality ® protocol, in the form of the criteria Expression of other behaviour, however in this study, this criteria was not correlated highly enough with the overall classification for inclusion in the models. This suggests that the potential for this measure to differentiate farms according to levels of positive welfare is being underutilised due to the way in which the measures have been aggregated.
The aim of this paper was to investigate possible iceberg indicators as a means of reducing the amount of time taken for an assessment. Using the Welfare Quality ® overall classification as a gold standard, Absence of prolonged thirst (Welfare Quality ® criteria) was able to discriminate between farms to a high degree of accuracy and reduce the amount of time taken for an assessment to 15 min, suggestive of its role as an iceberg indicator. However, by using the overall classification as the gold standard: the outcome of the measure aggregation system, the findings only reflect the relative weightings that have been assigned to different measures as a proxy for overall welfare state. That Absence of prolonged thirst has been shown in this study, to have such a deterministic role in the overall classification, suggests that the outcome-based, multi-dimensional assessment of welfare that Welfare Quality ® aimed to provide, may be compromised by the system of measure aggregation. While certain ‘challenges’ have been identified with using the measure aggregation system (Heath et al., Reference Heath, Lin, Browne, Mullan and Main2014), the associated weightings, which derive from both expert opinion and the application of mathematical techniques, have been criticized by de Vries et al. (Reference de Vries, Bokkers, van Schaik, Botreau, Engel, Dijkstra and de Boer2013a). Therefore, it is the opinion of the authors that rather than evidence of a credible iceberg indicator, the prominent role of Absence of prolonged thirst, in driving the overall classification, represents an unintended consequence of the measure aggregation system, which could potentially be improved with further development.
Acknowledgements
Funding for this project was provided by the Agriculture and Horticulture Development Board DairyCo division and AssureWel. The AssureWel project is a collaboration between the RSPCA, the Soil Association and the University of Bristol, which is supported financially by the Tubney Charitable Trust. The authors are very grateful for the assistance provided by the following individuals for their part in data collection: Professor Christoph Winckler; Iain Rogerson; Alison Bond; Anna Fraser; the farm assurance assessors; Milk Link Ltd; Dairy Crest Ltd; PAI, and indeed the farmers who took part. They would also like to acknowledge Dr Isabelle Veissier for her help with inaccuracies associated with the calculations in the printed protocol, and Dr Jenny Gibbons for help with drafting.