


Introduction
The widespread domestic support for Russia’s war of aggression against Ukraine has rekindled debates about interpreting public opinion surveys in autocracies. On the one hand, influential theoretical work has highlighted the importance of preference falsification (Kuran Reference Kuran1991, Reference Kuran1995; Wedeen Reference Wedeen1999), and a growing empirical literature has documented that surveys in authoritarian countries often inflate public support for the regime and its policies (Blair et al. Reference Blair, Coppock and Moor2020; Hale, Reference Hale2022; Kalinin Reference Kalinin2016; Nicholson and Huang Reference Nicholson and Huang2023). However, other studies find that surveys conducted in autocracies do not always yield highly inflated estimates of regime support (Frye et al. Reference Frye, Gehlbach, Marquardt and Reuter2017; Guriev and Treisman Reference Guriev and Treisman2020; Shen and Truex Reference Shen and Truex2021). This debate has assumed heightened importance in the context of Russia’s war against Ukraine. Major polls fielded in Russia since February 2022 show that most Russians nominally support the so-called ‘special military operation’ (SMO).Footnote 1 But these results have sparked controversy. Although some scholars have cast doubt on conclusions drawn from surveys conducted in Russia (Alyukov Reference Alyukov2022; Morris Reference Morris2023), others interpret their results as evidence that Russians have succumbed to state propaganda, given that it is the primary source of information for most citizens (Kizlova and Norris Reference Kizlova and Norris2022).
One common tool for identifying ‘preference falsification’ in autocracies is list experiments (Blair and Imai Reference Blair and Imai2012). On their face, post-invasion list experiments in Russia bolster skeptics’ criticisms by showing large gaps between direct survey measures of war support and list-based estimates (Chapkovski and Schaub Reference Chapkovski and Schaub2022; Levada Center 2022a ). Moreover, the gap between direct and indirect estimates of war support in our and other surveys has widened since the war began, suggesting increasing preference falsification (Levada Center 2022a).
This paper cautions against treating list experiment estimates as definitive evidence of preference falsification, especially for attitudinal questions on which respondents may have a range of preferences. Respondents may give seemingly contradictory answers to the direct question and list experiments, even if they are not afraid to express their opinion. This discrepancy stems from what we call the ‘threshold effect’: respondents may support the sensitive item in the direct question but not on the list experiment – not because they are lying, but because they apply a higher threshold for expressing support in the list format. Put differently, because respondents report only a single count across several statements, they tend to count the sensitive item only when their support is sufficiently strong relative to the other items. As a result, marginal or ambivalent supporters may say ‘yes’ on the direct question but omit it from their list count. Thus, the observed gap between the direct question and the list experiment may reflect, at least in part, weakly held preferences rather than just preference falsification.
The threshold effect is distinct from traditional design effects in list experiments. Design effects are understood as the inclusion of the sensitive item affecting answers to control items (Blair and Imai Reference Blair and Imai2012). It is also distinct from the no liars assumption, which presumes a singular ‘true’ answer for every respondent and that respondents are not lying about the sensitive item inside their list count. We focus on an underappreciated phenomenon that is in some ways the reverse of traditional design effects: control items can raise or lower the implicit threshold for endorsing an item, particularly when attitudes lie along a distribution.
The presence of the threshold effect complicates our ability to estimate preference falsification using traditional survey methods. We first provide direct evidence of the threshold effect by varying the control items and showing that the comparison context shifts sensitive-item counting independent of design effects. A minimized version of this design can be used to test sensitivity to design effects and provide an upper bound to preference falsification estimates. We then offer two additional solutions to address the problem and apply them to public opinion data from Russia. The first method uses a risk assessment question to identify subsets of the population where we would expect to find the most and least preference falsification, and then estimates political attitudes for these groups. We supplement this method with word association tests, a tool for estimating attitudes towards sensitive issues that is relatively new to political science (Han et al. Reference Han, Truex and Liu2025).
Although each method has its limitations, they tell a consistent story: a year into Russia’s war against Ukraine, outright preference falsification remained relatively low (5–7 per cent of respondents), but a substantial share of Russians (about 15 per cent) expressed preferences that were weak enough to shift when anchored against other policy issues. Data collected several months later show little evidence of preference falsification, but a similarly large proportion of respondents with weak preferences. Our findings suggest that, while most Russians are not lying in surveys, the strength of war support varies across the population and over time.
Beyond providing valuable insights into Russian public opinion, our work offers an important methodological contribution to research on authoritarian regimes, especially given the growing reliance on list experiments to characterize the ‘true’ nature of support for the regime and its policies (Blair et al. Reference Blair, Coppock and Moor2020). Scholars need not abandon list experiments entirely, as they can still yield useful insights about attitudes towards sensitive political issues. However, researchers should recognize that list experiments can reveal not just preference falsification but also weak or ambivalent attitudes. For issues about which we would expect many ‘soft’ preferences, list experiments must be designed carefully – or supplemented with additional techniques – to reveal a more nuanced picture of political preferences in autocracies. We illustrate this approach in the Russian case and offer practical design guidance and diagnostics that can be adapted to other issues and authoritarian settings.
Russian Public Opinion in Wartime
Survey data collected since Russia’s full-scale invasion of Ukraine on 24 February 2022 show high, stable public support for Russia’s ‘special military operation’. Monthly polls conducted by the Levada Center, an independent Russian polling agency, show overall support ranging from a low of 68 per cent in February 2022 to a high of 80 per cent a month later (Levada Center 2023). Our estimates are slightly lower: from 70 per cent in mid-May 2022 to 59 per cent in early January 2023 (see Figure 1). This high level of war support is even more remarkable given the war’s costs for Russia: a year after the invasion, Western officials estimated that 200,000 Russian soldiers had been wounded or killed (Cooper et al. Reference Cooper, Schmitt and Gibbons-Neff2023). In the face of massive casualties and vocal international condemnation of Russian aggression in Ukraine, do most Russians really support the war?
Time series of daily estimates of Russian public support for the war in Ukraine since mid-May 2022, generated using dynamic multilevel regression and post-stratification (Caughey and Warshaw Reference Caughey and Warshaw2015; Gelman et al. Reference Gelman, Lax, Phillips, Gabry and Trangucci2018).

Survey researchers working in authoritarian contexts often use list experiments to assess preference falsification on sensitive questions. In a list experiment, respondents are randomly assigned to a control list of non-sensitive items or to a treatment list that adds a sensitive item (for example, war support). Instead of answering items individually, they report only how many statements they agree with. The difference-in-mean between treatment and control group counts identifies support for the sensitive item, while preserving respondent anonymity and reducing their incentives for preference falsification (Blair and Imai Reference Blair and Imai2012; Corstange Reference Corstange2009; Imai Reference Imai2011).
List experiments conducted in Russia before February 2022 suggest that self-reported government approval is largely genuine. Frye et al. (Reference Frye, Gehlbach, Marquardt and Reuter2017) argue that only a small share of Russians misrepresented their support for Vladimir Putin in 2015. Using data from 2020 to 2021, Buckley et al. (Reference Buckley, Marquardt, Reuter and Tertytchnaya2023) show that changes in Putin support are due to shifting beliefs about his popularity, not preference falsification. But list experiments conducted after Russia’s full-scale invasion of Ukraine show a large and growing gap between direct and indirect estimates of war support. This pattern invites a reassessment of previous conclusions about regime support under the new wartime circumstances.
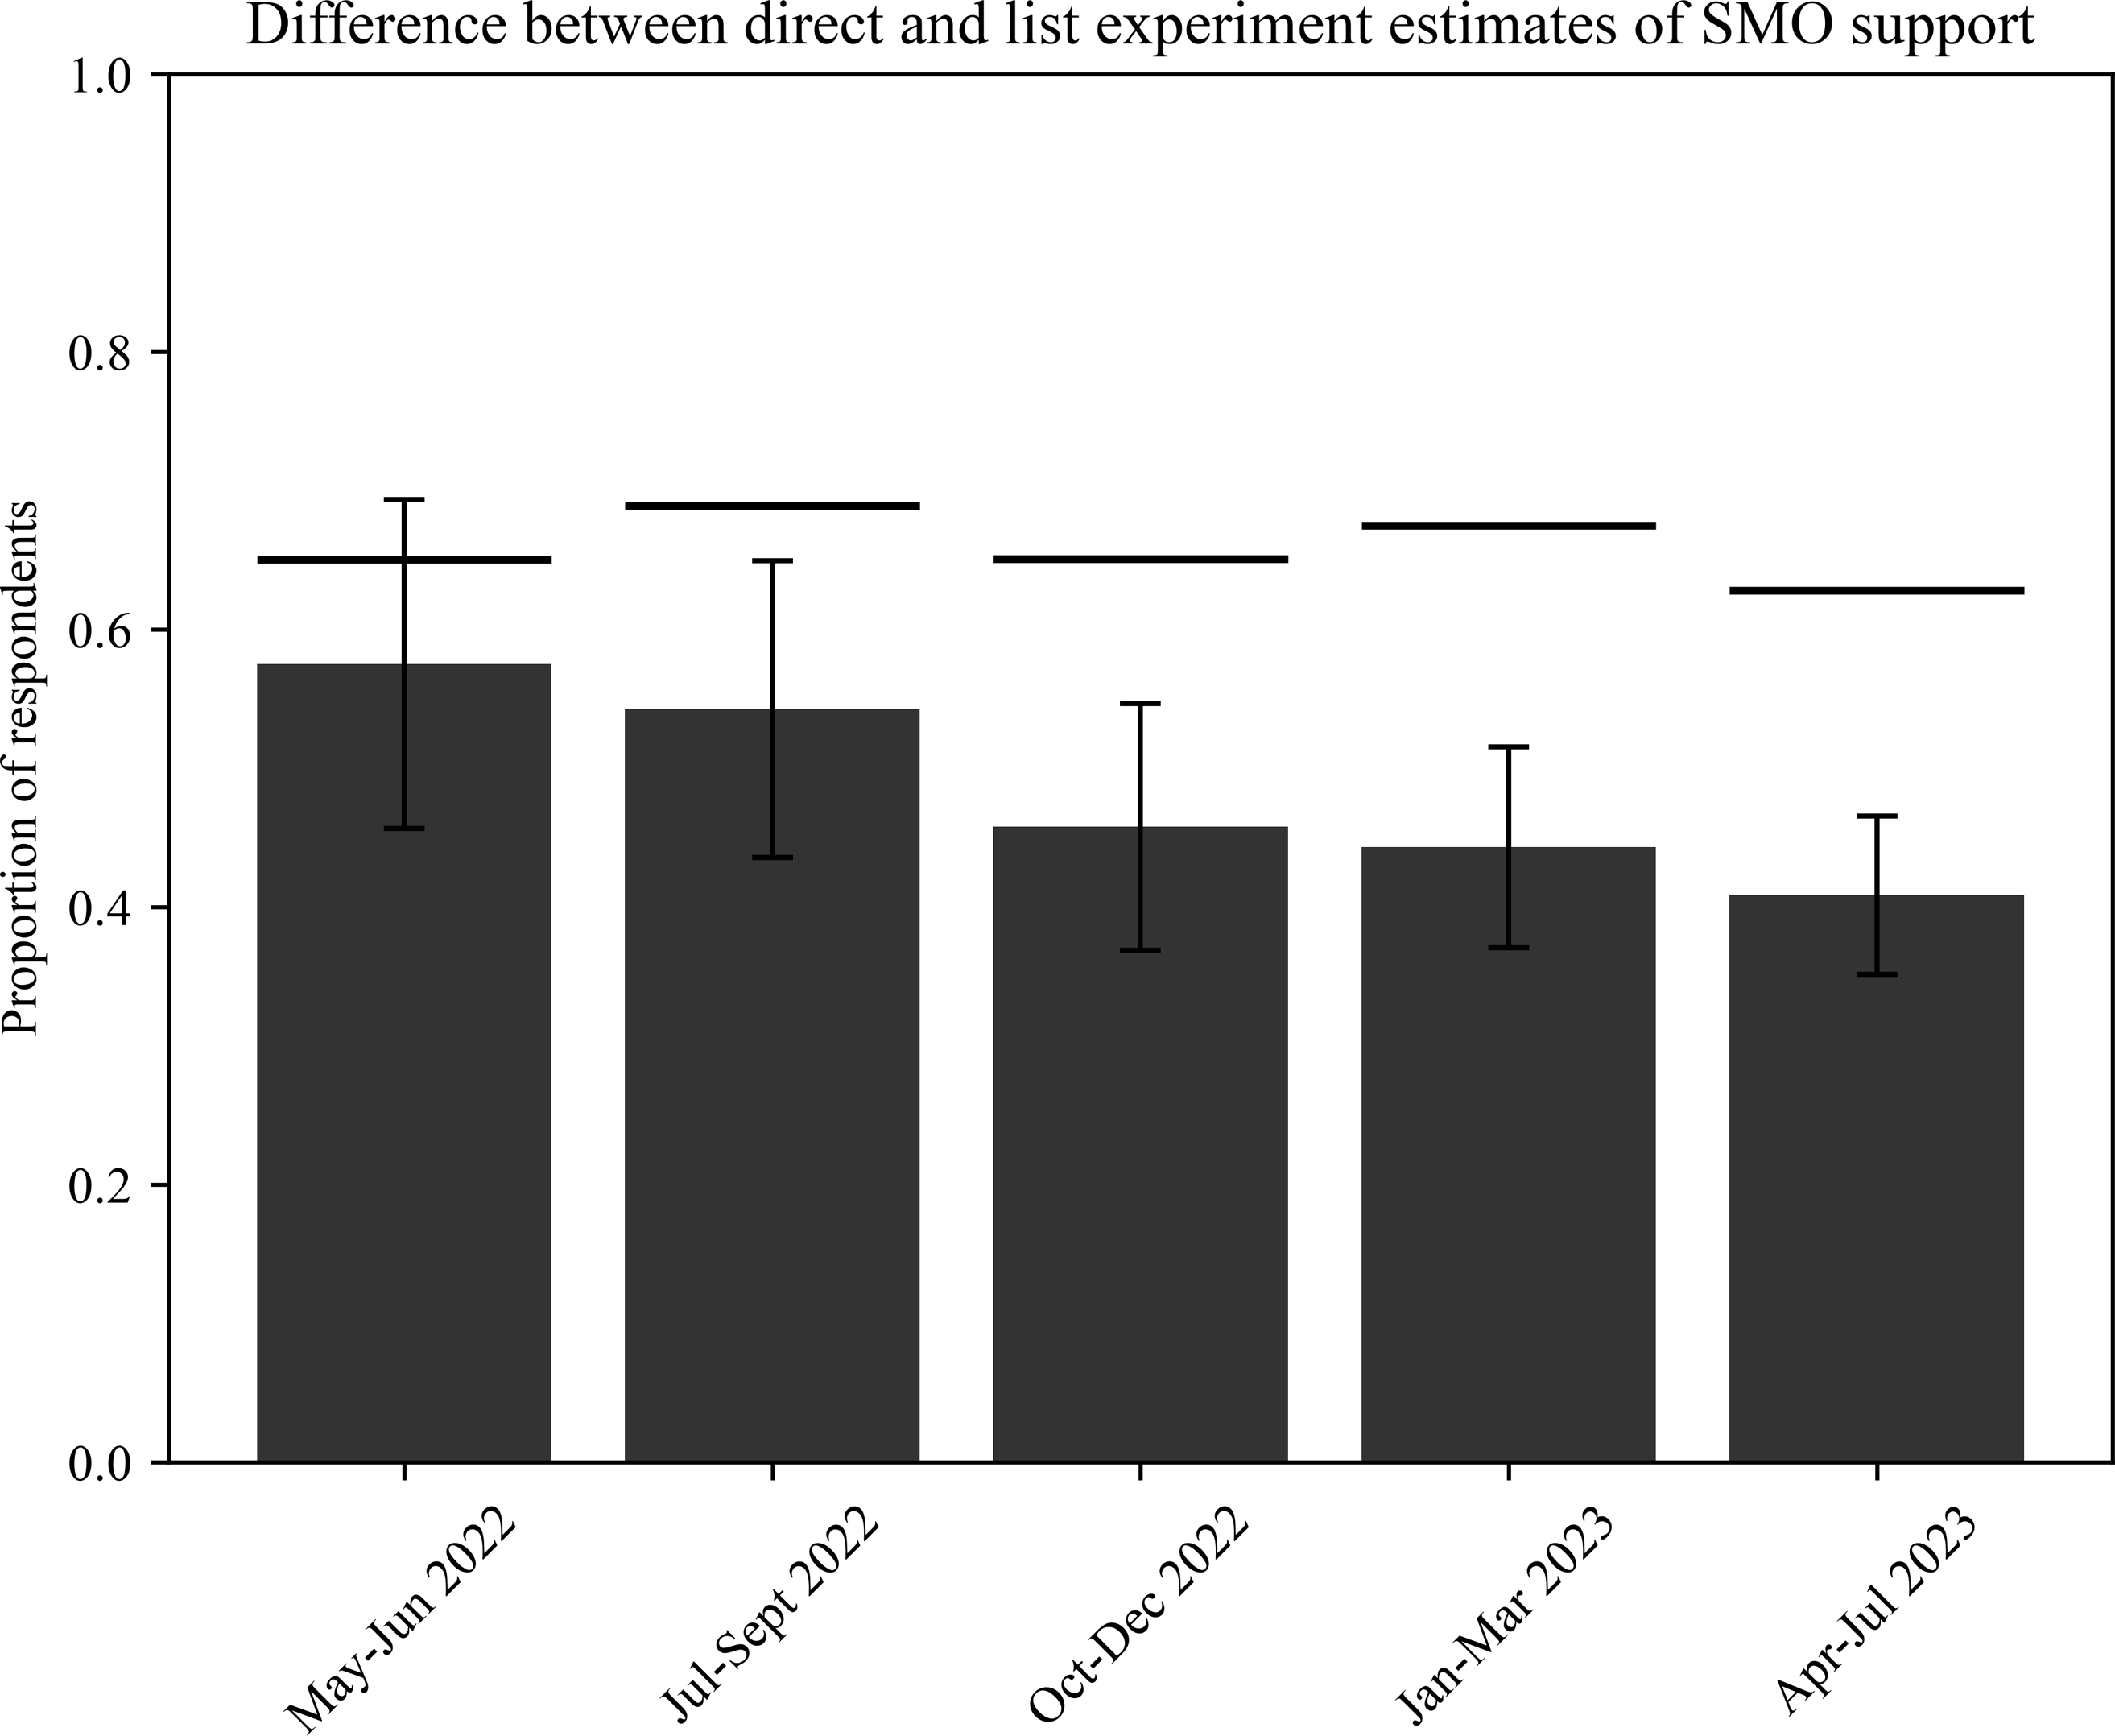
We used online surveys to conduct a series of list experiments at regular intervals between May 2022 and July 2023. Figure 2 displays the estimate of war support from the direct question (horizontal lines) alongside estimates from list experiments (bars). In May–June 2022, these two estimates were nearly identical. But the gap widened as Ukrainian troops recaptured territory that had been overtaken by Russian forces in the early weeks of the war. By summer 2023, there was a substantial difference between direct and indirect estimates of war support – over 20 percentage points. Levada data show a similar trend (Levada Center 2022a).
Horizontal lines show our estimate of direct war support, averaged over the periods on the x-axis. Bars show indirect war support from the list experiment, with 95 per cent CIs. Collection dates are listed in Online Appendix S.11.

On initial inspection, these data suggest that preference falsification among Russian survey respondents increased noticeably until March 2023, then declined somewhat in the summer of 2023, before settling at a higher level than in 2022. This interpretation seems plausible considering the Putin regime’s crackdown on public opposition (Dam and McKernan Reference Dam and McKernan2022). Although Russian authorities have not targeted individuals for expressing opposition to the war on surveys (Rosenfeld Reference Rosenfeld2023), it is reasonable to expect respondents to lie more often amid intensifying domestic repression.
We argue, however, that interpreting the gap between direct and indirect estimates of war support as conclusive evidence of preference falsification is problematic. In a list experiment, respondents are presented with a group of control items that may not only provide anonymity, but also help anchor preferences for the sensitive item. Respondents may use a different threshold to evaluate the sensitive item in the list experiment compared to the direct question, even if their underlying preference is the same. This problem, which we call the ‘threshold effect’, can lead to inflated estimates of preference falsification, particularly among respondents with weak attitudes towards the sensitive item.
Applying this logic to the issue of Russian support for the war in Ukraine, we argue that while some Russians may be lying on surveys, others may simply have attitudes towards the war that are weak enough to shift depending on how the question is posed. Consequently, the growing gap between support for the war on direct questions versus list experiments may be explained at least in part by a softening of support, rather than an increase in outright liars.
List Experiments and the Threshold Effect
Challenges with Interpreting List Experiments
List experiments – also known as item count techniques (ICT) – are widely used to study sensitive attitudes in authoritarian settings, including regime support and protest participation (Enikolopov et al. Reference Enikolopov, Makarin and Petrova2020; Frye et al. Reference Frye, Gehlbach, Marquardt and Reuter2017; Kalinin Reference Kalinin2016; Tang Reference Tang2016). One meta-analysis finds widespread evidence that respondents over-report support for authoritarian regimes (Blair et al. Reference Blair, Coppock and Moor2020). Consistent with this pattern, list experiments in Russia suggest substantial inflation in reported approval of the war, with indirect estimates up to 30 percentage points lower than direct-question measures (Chapkovski and Schaub Reference Chapkovski and Schaub2022; Levada Center 2022a).
Although list experiments have been refined methodologically in recent years (Corstange Reference Corstange2009; Glynn Reference Glynn2013; Rosenfeld et al. Reference Rosenfeld, Imai and Shapiro2016), interpreting their results can still be challenging. Riambau and Ostwald (Reference Riambau and Ostwald2021) show that list length can affect estimates of support for the sensitive item, and Kramon and Weghorst (Reference Kramon and Weghorst2019) find that complexity can generate reporting errors. Frye et al. (Reference Frye, Gehlbach, Marquardt and Reuter2023) document artificial deflation effects, where the estimates of support from the direct question versus the list experiment diverge even when the ‘sensitive’ item (in their application, Fidel Castro) is not sensitive at all. As these authors note, it can be hard to distinguish preference falsification from design-based effects, which challenges our ability to use list experiments to understand the ‘true’ nature of political preferences in autocracies.
For a list experiment to provide an unbiased estimate of the prevalence of the sensitive item, two assumptions must be met: (1) respondents give truthful answers to the sensitive item in the list experiment (‘no liars’) and (2) the addition of the sensitive item does not alter responses to control items (‘no design effect’) (Blair and Imai Reference Blair and Imai2012). Among the mechanisms that can create design effects, scholars have shown that including a sensitive item in the treatment condition can affect how respondents evaluate the control items, because the sensitive item provides a new point of comparison (Flavin and Keane Reference Flavin and Keane2009; Imai Reference Imai2011). We highlight another condition that must be met for the comparison between the direct question and the list experiment to be a valid estimate of preference falsification: respondents must use the same threshold for defining support for the sensitive item when it appears alongside the control items as they do when it is asked directly.Footnote 2
Preference Falsification Versus Weak Preferences
List experiments usually require respondents to make a binary choice for each item in the list (count/don’t count), whereas direct questions often capture attitude intensity using Likert scales or feeling thermometers – formats with which list experiments were not designed to be compatible. Anchored by the other items, respondents may apply a higher bar for what ‘counts’ as support in the list context. The threshold effect can lead researchers to overestimate preference falsification by treating all direct-list differences as deception.
Weak preferences that are susceptible to the threshold effect can arise from multiple sources: a person may hold loosely formed views, be politically disengaged, or feel genuinely ambivalent about a certain issue – seeing real costs and benefits to either side and shifting their ultimate response depending on when and how they are asked. Returning to the Russian case, a respondent who generally believes the SMO is being fought for the right reasons but has reservations about how it is being conducted might say they ‘somewhat support’ the SMO on the direct question, while not counting the SMO as one of the items they support in a list experiment, if the list contains another item about which they feel much more certain. This shift does not represent falsification in either direction. Rather, it reflects the fact that the list context can raise the implicit threshold for what counts as ‘support’ when the SMO is included alongside a more compelling alternative (for example, an increase in pensions). Hence, any gap between direct and list-based measures of war support may be due partly to actual preference falsification and partly to this threshold effect.
To assess how widely the threshold effect may apply in practice, we reviewed list experiment applications in thirteen leading political science journals between 2007 and 2025. Excluding meta-analyses and re-analyses, we identified fifty-seven original studies (full details are in Online Appendix S.1). About 60 per cent of them (34/57) used sensitive items that, although usually formulated dichotomously, capture attitudes, emotions, or evaluative judgments that are better understood as latent continuous variables. The remaining studies focus primarily on retrospective behavioral or experiential reports (for example, voting, electoral fraud, or exposure to violence). However, even these dichotomous items can be ambiguous in practice because of recall uncertainties and unclear meanings or interpretations.Footnote 3 For example, voting is often subject to recall bias (Himmelweit et al. Reference Himmelweit, Biberian and Stockdale1978; Weir Reference Weir1975), and respondents may be unsure about what constitutes a ‘threat’ in an item asking about voter intimidation (Daxecker et al. Reference Daxecker, Deglow and Fjelde2025). Taken together, these patterns indicate that the threshold effect is not a narrow methodological curiosity, but a concern that plausibly affects a substantial fraction of list experiments in political science, precisely because many sensitive items are better understood as graded judgments rather than dichotomous states.
Characterizing and Testing the Threshold Effect
The Item Count Task (ICT) was originally developed to measure sensitive behaviors with a true binary status, where each respondent either did or did not engage in the behavior (Dalton et al. Reference Dalton, Wimbush and Daily1994; Raghavarao and Federer Reference Raghavarao and Federer1973). However, many political scientists now use ICTs for attitudes that vary in intensity. Converting an inherently graded attitude to a binary counting decision (for example, ‘I support Russia’s special military operation in Ukraine’) can introduce the threshold effect. Respondents who support the war but hold reservations may not endorse it when it appears alongside control items they strongly endorse, even if they would express support on a direct question. The threshold for ‘counting’ can depend on the comparison items: a clear-cut control item (for example, whether the respondent ate meat today) may create a higher threshold for agreement than an ambiguous one (for example, whether the respondent often discusses politics with friends). For respondents whose war support is less firm, the threshold differences introduced by the control item may lead them to count war support in the latter list but not the former (because they are less certain about the war than their meat consumption habits). This illustrates the cognitive dynamics underlying the threshold effect: respondents must translate graded attitudes into a binary counting decision, and the comparison items shift the implicit cut-off for what ‘counts’ as endorsement.
To test for the existence of thresholding in Russian war support, we implemented a two-stage list experiment design that examines whether non-sensitive comparison items shift the cut-off respondents use when translating attitudes into the binary counting required by an ICT. Respondents were randomly assigned to a standard ICT control or treatment condition. Control respondents received a list containing four non-sensitive items; treatment respondents received the same list along with the sensitive item (support for the SMO).
Each respondent completed two list tasks, separated by a substantial number of questions to reduce interactions between the two lists. To preserve anonymity, respondents were assigned to either the control or treatment condition for both tasks. The first three control items were held constant across all lists and were selected through pre-testing to minimize ambiguity and reduce ceiling/floor risk. The only difference between List 1 and List 2 was the fourth control item.
We assembled a pool of candidate fourth items spanning a range of empirically measured properties related to uncertainty and response dispersion (for example, missingness, polarity, and the prevalence of strong responses).Footnote 4 Respondents were then randomly assigned to one of several pre-specified pairs of fourth items, such that each respondent saw two different fourth items (one in each list) while maintaining balanced sample sizes across pairs. Pairs were chosen to maximize contrast on the pre-measured item attributes. The illustrative pair above (‘I have eaten meat today’ vs. ‘I often discuss politics with my friends’) was included in the design; the remainder can be found in Table S2. We subsequently asked control-group respondents direct Likert-scale questions about the non-sensitive control items in their lists to measure their properties without compromising the treatment condition. We also use an earlier direct war-support question to distinguish strong from marginal supporters.
To test whether the comparison context created by the non-sensitive items changes how respondents count support for the sensitive item in a list experiment, we exploit the two-list structure of the design. Each respondent completed two list tasks under the same treatment condition (no sensitive item vs. sensitive item included). Let y i1 and y i2 denote respondent i’s reported counts on List 1 and List 2, and define the within-respondent difference:
 $$d_i \equiv y_{i2} - y_{i1}.$$
This transformation isolates what changes between the two tasks for the same person. In the control condition, the only difference between List 1 and List 2 is the identity of the fourth control item (the other three items are the same). This means that for control respondents, d i captures ‘mechanical’ differences between the two lists – whether the respondent agrees with the second list’s fourth item more than the first list’s fourth item, plus any idiosyncratic list-to-list counting noise. In the treatment condition, respondents face the same two fourth-item contexts, but the sensitive item is present in both lists. If the sensitive item is evaluated using a stable cut-off that does not depend on comparison items, then the sensitive item contributes equally to both list totals and cancels out in d i . Under a threshold/anchoring mechanism, however, the fourth item can shift whether marginal supporters count the sensitive item on a given list. In that case, the sensitive item does not cancel out in d i , and the treatment–control difference in d i reveals context-dependent sensitive-item counting.
We operationalize the ‘anchoring strength’ of the fourth item using its strong-agreement rate in the control group. For each pair p, define S pℓ as the share of control-group respondents who strongly agree with the fourth item shown in list ℓ ∈ {1, 2}, and let:
 $$\Delta S_p \equiv S_{p2} - S_{p1}.$$
This quantity is fixed at the pair level and is computed from the direct questions administered to control respondents. Intuitively, when ΔS p is large and positive, List 2 contains a comparison item that respondents endorse more strongly than the comparison item in List 1. This is the setting in which an anchoring mechanism predicts that weak support for the sensitive item should be less likely to ‘count’ on List 2 than on List 1.
We then estimate:
 $$d_i = \alpha _p + \beta T_i + \gamma \left (T_i \times \Delta S_p\right ) + \varepsilon _i,$$
where T i indicates assignment to the treatment condition and α p are pair fixed effects, which absorb the baseline mean difference between the two lists within each pair (the expected mechanical difference in d i that arises even without the sensitive item).Footnote 5 The coefficient of interest is γ, which captures whether the sensitive-item contribution to the difference d i varies systematically with the relative anchoring strength of the fourth item across the two lists. A negative γ means that when the fourth control item is more strongly endorsed in List 2 than List 1, the treatment group’s List-2-minus-List-1 change in counts is smaller than the change in the control condition. This suggests that a stronger comparison item makes respondents less likely to count the sensitive item.
Under a thresholding mechanism, the strength of the fourth control item should systematically shift whether some respondents count the sensitive item. Among war supporters, stronger baseline endorsement of the fourth control item should raise the implicit threshold for what ‘counts’ as support, yielding a negative relationship between anchoring strength and SMO counting. Among war opponents, the sensitive item should fall below the endorsement threshold in both lists, so anchoring strength should have a near-zero relationship to SMO counting (or even mildly negative for hesitant opponents). Pooling across supporters and opponents can therefore attenuate the aggregate effect. To avoid this mechanical averaging, we estimate Equation (3) separately by respondents’ direct SMO position and focus on supporters, the subset among whom preference falsification would be most likely if it exists. The results are shown in Figure 3.
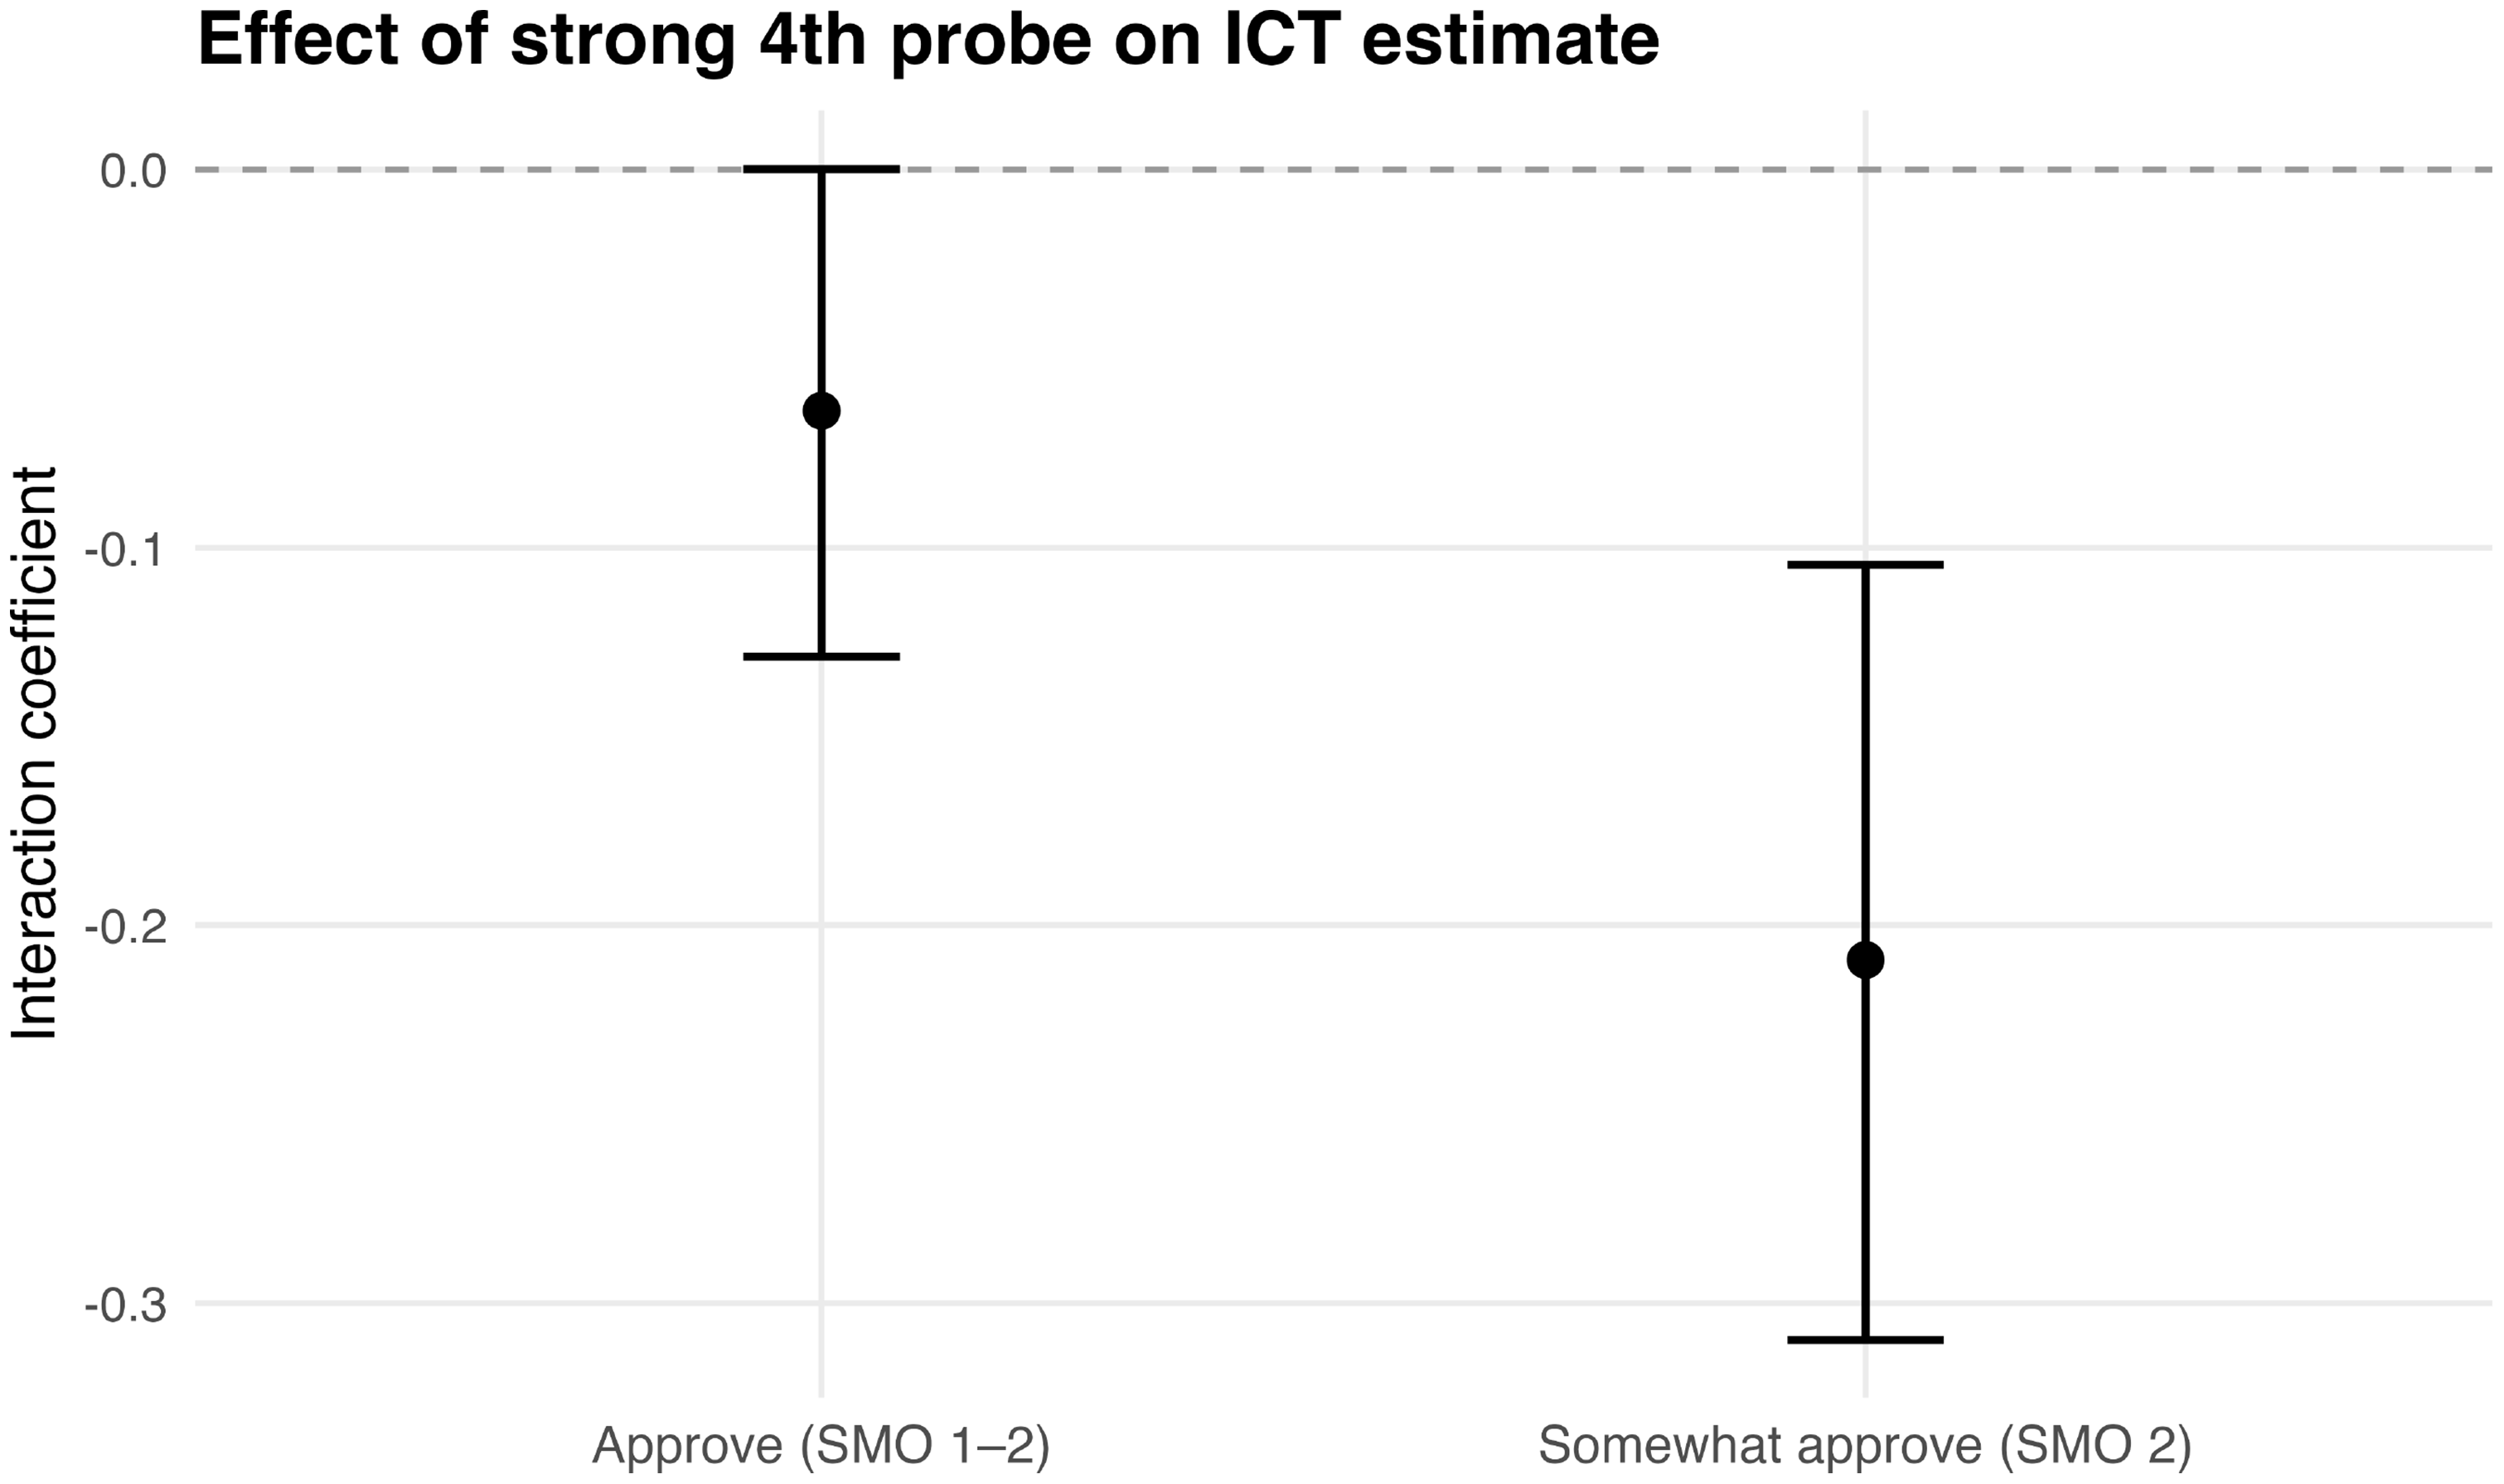
Evidence of thresholding among weak SMO supporters. Estimated γ from Equation (3) for all supporters (left) and ‘somewhat’ supporters (right). Negative values indicate that stronger comparison items reduce sensitive-item counting. Bars show bootstrapped 95 per cent CIs.

Across all self-reported SMO supporters (strong and weak combined), the estimated coefficient is negative and just shy of statistical significance (p = 0.053). Because thresholding should be most pronounced among weak supporters, we re-estimate the model for the subset who report somewhat approving of the SMO (right panel of Figure 3). As expected, the estimate becomes more negative and highly statistically significant. Moreover, these effects are substantively large: as illustrated in Figure S3, for weak war supporters some of the item-count differences between list-pairs were above 10 percentage points, even though the lists only differed in one of the control items. Overall, these results provide our clearest evidence of a threshold effect: stronger comparison items reduce sensitive-item counting, particularly among marginal supporters.
Estimating Support for the War in Russia
Having established the existence of potentially sizeable threshold effects, we now propose one way of distinguishing preference falsification from weak preferences. We do so by identifying a subset of respondents with little incentive to falsify their preferences, and then use the difference between the list experiment estimate and direct responses for that group as an estimate of the threshold effect. A formal derivation of our estimator can be found in Online Appendix S.8.
To preview the results, we find that although only a small share of respondents deliberately misrepresented their attitudes about the war in Ukraine in winter 2023, a sizeable fraction exhibited preferences weak enough that they were sensitive to the threshold effect. But the distribution of preference falsification versus weak preferences can shift over time: data collected in summer 2023 show a decrease in preference falsification and an increase in the threshold effect among strong supporters.Footnote 6 Although data limitations prevent us from definitively separating preference falsification from weak preferences in earlier surveys, we argue that weak preferences can plausibly explain much of the gap between direct and indirect estimates of war support that researchers have observed since February 2022. Our data do not support the claim that most Russians lie in surveys, but they do indicate that the strength of their support varies considerably.
Data and Experimental Set-up
Our study uses data from a daily online public opinion survey that was launched in mid-May 2022, three months after Russia’s full-scale invasion.Footnote 7 The survey employed random device engagement (RDE) sampling, an online analog of random-digit dialing.Footnote 8 We conducted two waves of the experiment that included all the relevant questions required for our estimation approach: the first from 16 February 2023 to 4 March 2023, and the second from 12 June 2023 to 31 July 2023. In the February–March wave, we collected 3,094 responses, of which 2,907 include responses to the list experiment.Footnote 9 In the June–July wave, we collected 3,319 responses, of which 3,061 answered the list experiment. A discussion of the sample composition and performance is available in Online Appendix S.11.
Respondents first viewed an informed consent form describing potential risks and data storage protocols. They then reported their support for Russia’s ‘special military operation’ (SMO) in Ukraine on a four-point Likert scale, with ‘don’t know’ and ‘prefer not to answer’ options. Later, they completed a list experiment measuring support for the SMO. We randomly assigned respondents to equal-sized control and treatment groups, and presented each group with a list of items. The control group received four items; the treatment group received the same list plus the sensitive item: the SMO (see Table 1). Respondents were asked to indicate how many items they supported. Full question texts can be found in Online Appendix S.3 and S.4.Footnote 10
List experiment treatment and control items

Table 1. Long description
A table with two columns and six rows comparing control and treatment items. The columns are labeled ‘Control items’ and ‘Treatment items’. The control items include legalization of same-sex marriage in Russia, increase in pensions, mandatory vaccination against coronavirus, and government tax on environmental pollution. The treatment items include only the legalization of same-sex marriage in Russia. The table also mentions Russia’s special military operation in Ukraine.
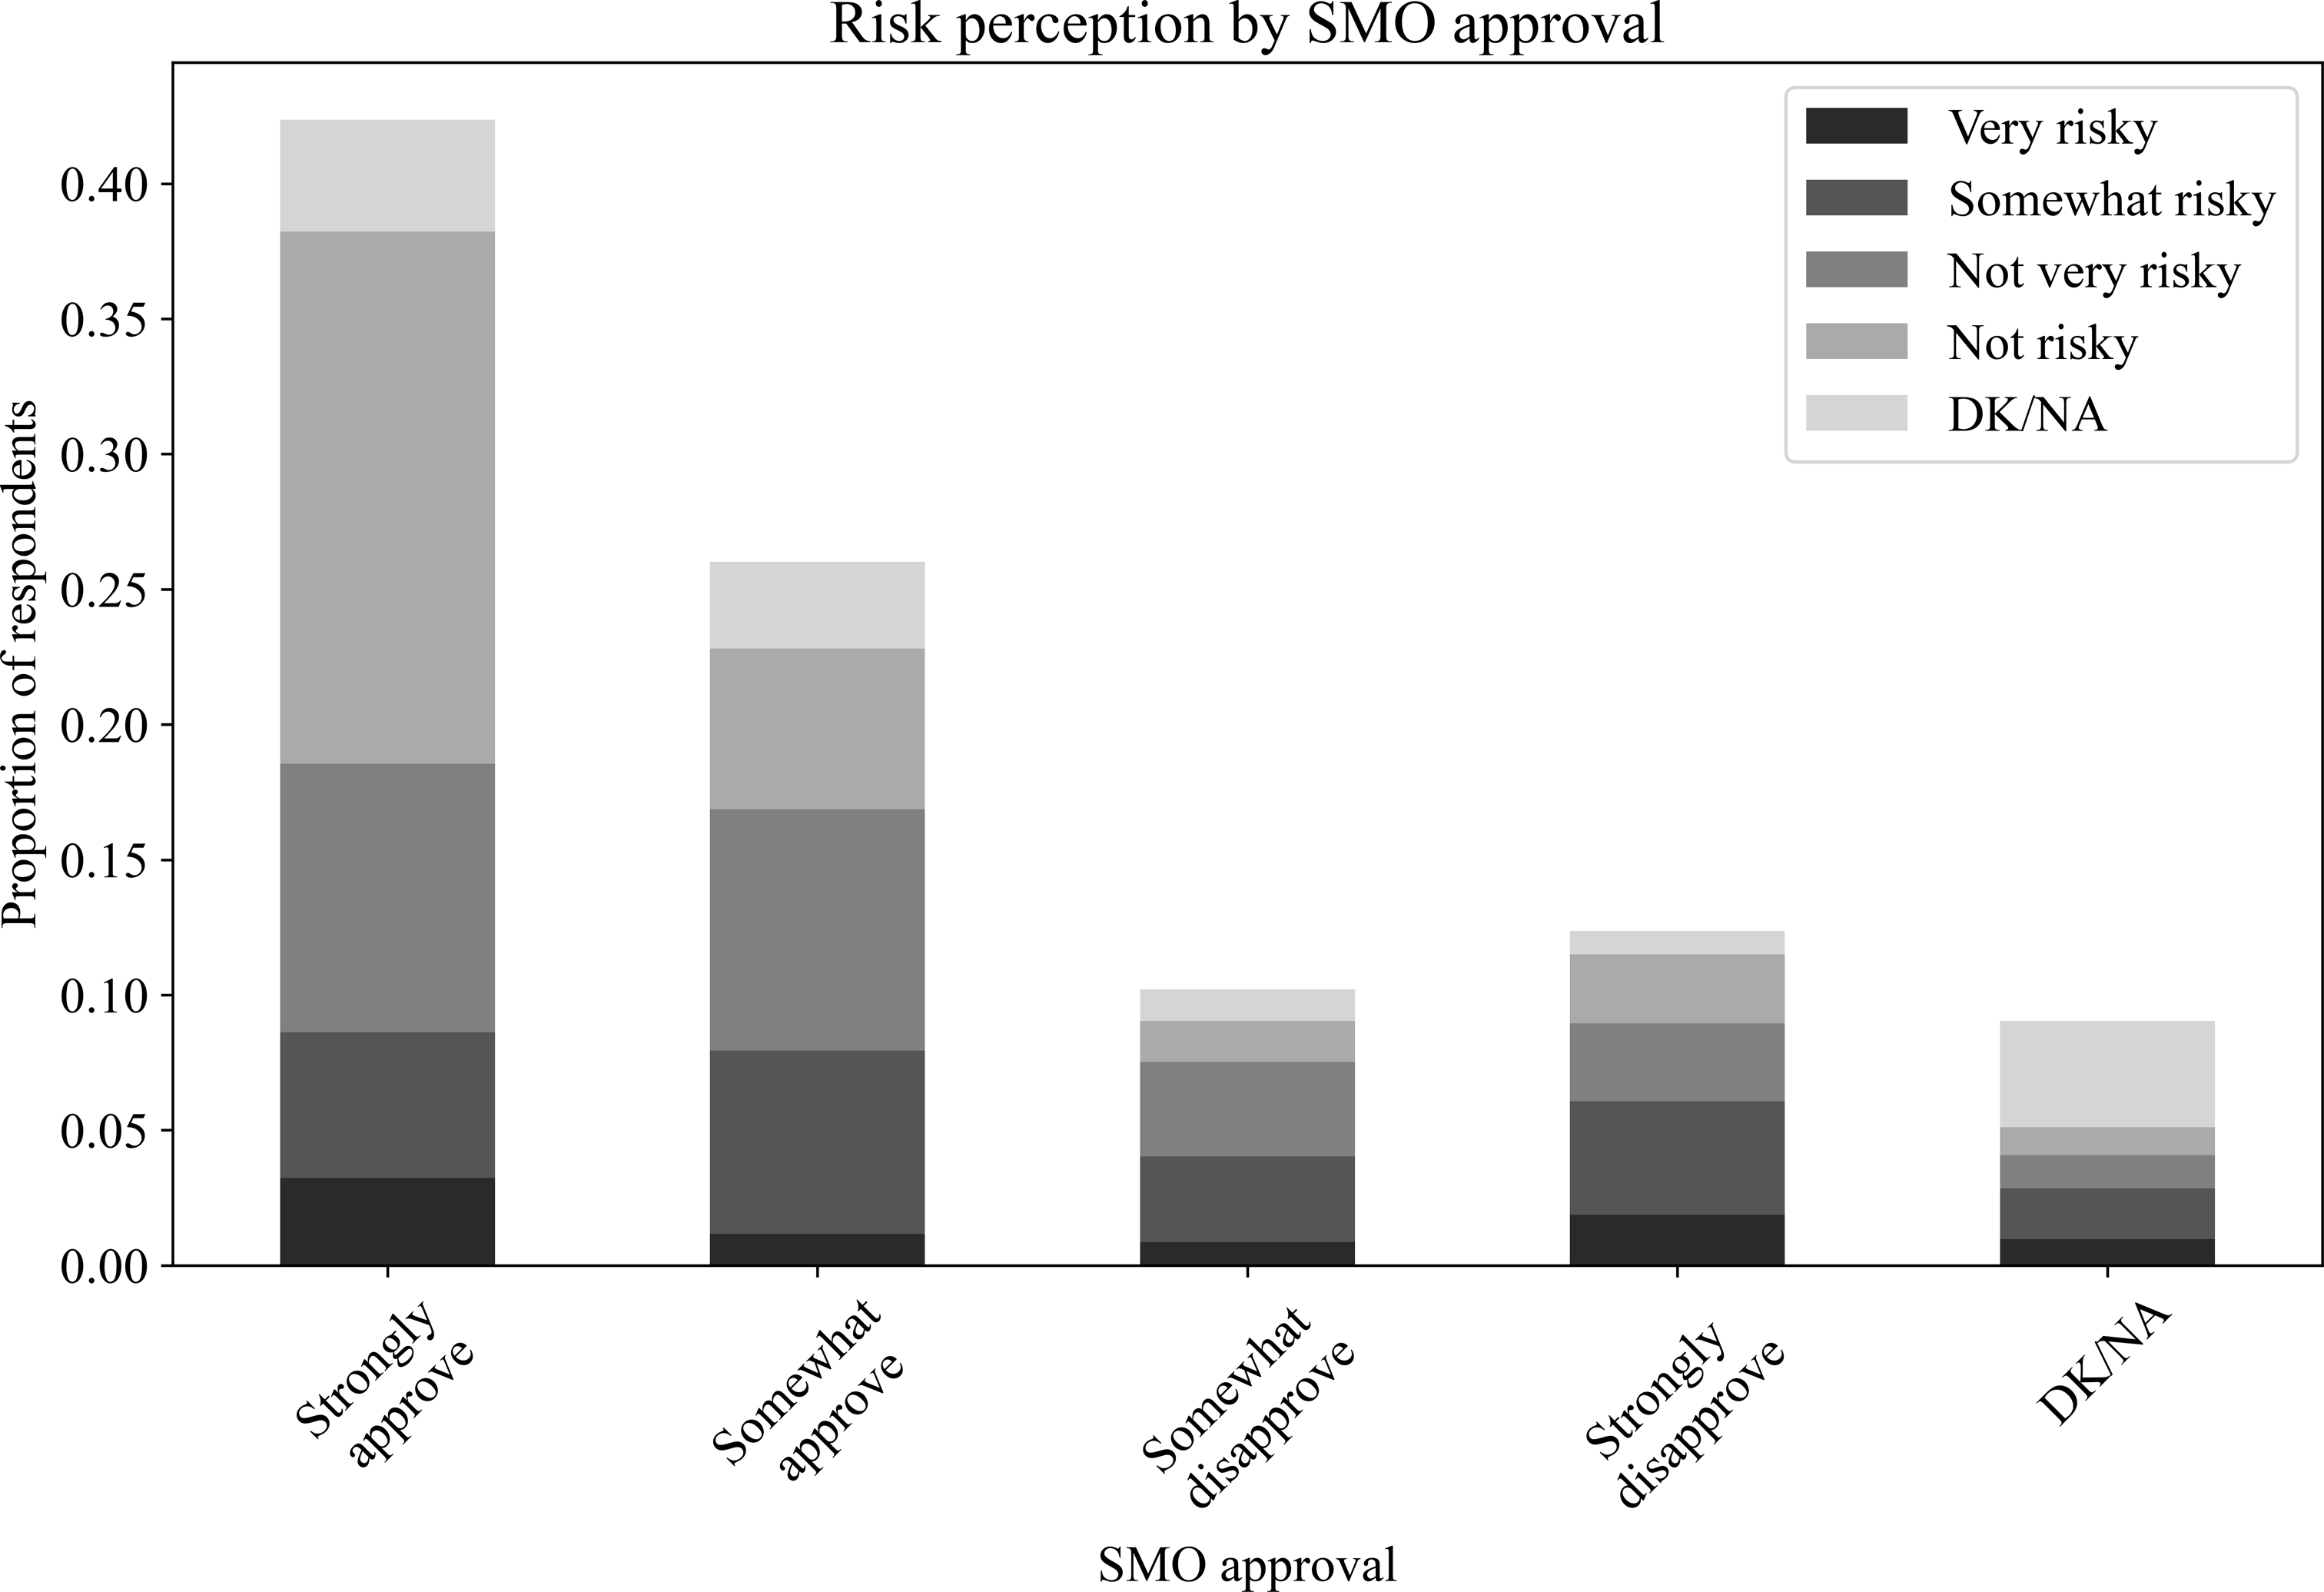
At the end of the survey, we included a question asking respondents how risky it would be for someone to express opposition to the ‘special military operation’ in an online survey. Figure 4 shows the distribution of perceived risk of expressing opposition to the war in an online survey among respondents for different levels of SMO support, as expressed in the direct question at the beginning of the survey. Respondents vary widely in how risky they think it is to criticize the war in online surveys: in the February–March wave, 30 per cent saw no risks and 27 per cent thought that expressing opposition to the SMO in an online survey was ‘not very risky’. A smaller but sizeable group (21 per cent) considered this action somewhat risky, while about 8 per cent perceived high risks. We argue that incentives to lie about war support in the direct question should rise with higher risk perceptions, and we use this distribution to separate preference falsification from weak preferences on our survey.
Joint distribution of responses to the direct SMO support question and perceived risk of expressing opposition, using unweighted means from the winter 2023 list experiment field period (16 February–4 March 2023).

Risk perceptions are strongly negatively correlated with war support, meaning that self-professed war supporters perceived lower risk than war opponents: 30 per cent of weak supporters and 20 per cent of strong supporters saw moderate-to-high risks, while about half of war opponents did (see Figure 4). This shows that many war opponents put a high expressive value on voicing their opposition in a survey, even if they think that doing so could carry some risks – a dynamic highlighted in recent research by Vyrskaia et al. (Reference Vyrskaia, Tkachenko and Martynova2025). However, given that almost two-thirds of survey respondents claim to support the war, the group that is arguably most likely to engage in preference falsification – self-avowed war supporters who think that expressing dissent in online surveys is risky – accounts for about 16 per cent of our sample.
Our approach relies on two assumptions. The first is that there exists a subset of ‘non-liars’ – that is, people who see minimal risk in expressing opposition to the SMO. Our second assumption is that, within each level of self-reported war support, the expected threshold for endorsing the SMO on the list experiment does not differ by perceived survey risk.
Figure 5 summarizes list experiment results for each stratum in our February–March 2023 wave.Footnote 11 The y-axis shows support for the SMO on the direct question; the x-axis shows the share who endorse the SMO on the list experiment. The red lines indicate those who consider it risky to oppose the SMO in a survey; the blue lines indicate those who do not. Among strong SMO supporters with low risk perceptions, nearly everyone endorses the SMO in the list experiment (the 95 per cent confidence interval crosses 1). By contrast, only half of the strong supporters who see high risk endorse the SMO on the list experiment.
OLS coefficients and 95 per cent CIs for the traditional list experiment estimator within each subset used to estimate
 $\hat {\gamma _A}$
. Full regression tables can be found in Online Appendix S.12.1.

One concern is that respondents who falsify war support might also lie about risk. The initial results of our list experiment suggest that this is not the case. If respondents were lying about both their support for the SMO and the perceived risk of expressing a dissenting view on a survey, we would expect to observe a list experiment estimate of less than 1 for respondents who are strong SMO supporters and express low survey risk. In the February–March 2023 wave, we cannot reject the null hypothesis that this estimate equals 1. This pattern implies that, on average, respondents in this subgroup appear to count the SMO item at rates consistent with their stated support, providing little evidence of systematic ‘double lying’.
The coefficient does differ from 1 in the second wave, which we take as evidence of a weakening of preferences. We acknowledge that it is possible that some respondents lied on both the direct SMO support and risk questions, although we think it more likely that such individuals would simply opt out of the survey entirely. In Online Appendix S.13, we estimate preference falsification in the scenario where respondents lie on both the direct question and the survey risk question. Our preference falsification estimate does increase, but remains below 10 per cent. Similarly, we do not detect a difference between the direct question and the list experiment among respondents who said they strongly support the SMO but answered ‘don’t know’ or ‘prefer not to answer’ to the risk question.Footnote 12 We therefore include these respondents in the non-falsifiers strata when estimating preference falsification.
Our second assumption is that the thresholds for respondents within each level of support are equal in expectation, regardless of the level of perceived risk. In other words, people who said they strongly support the SMO on the direct question but think expressing opposition is risky should have the same threshold or cut-off for selecting ‘Russia’s special military operation in Ukraine’ on the list experiment as strong SMO supporters who think expressing opposition is not risky. This assumption remains untested. However, we do not see a plausible reason why the level of risk perception should be directly related to the threshold for the item count.
Estimating Preference Falsification in February–March 2023
In the previous section, we provided evidence in support of the two assumptions underlying our estimator of preference falsification. Now we apply our estimator to decompose the gap between the direct and list experiment estimates of war support into preference falsification and the threshold effect, using the coefficients from Figure 5. To illustrate the logic of the estimator, we will walk through the process step by step.
We begin by estimating the magnitude of preference falsification versus threshold effect for respondents who said they strongly support the SMO when asked directly. To calculate how much of the gap between the direct estimate of war support and the list experiment estimate of war support for this group is due to the threshold effect, we look at the difference between 1 and the list experiment coefficient for those strong supporters with low perceived survey risk (0.920). Under Assumption 1, we expect to see no preference falsification for this group, so we attribute the gap (1–0.920 = 0.08) to the threshold effect. This suggests that in February–March 2023, the threshold effect was substantively small (and statistically indistinguishable from 0) for strong war supporters. Since we have no reason to expect threshold effects to be affected by perceived survey risks (Assumption 2), we take 0.08 as our estimate of the threshold effect for strong supporters with high survey risk perception. Within this group, the gap between direct support and indirect support is 0.497 (1–0.503). Subtracting the threshold effect estimate for this group (0.08) from the total difference, we estimate that 42 per cent of strong supporters with high risk perceptions – a group that accounts for roughly 10 per cent of the total sample – misrepresented their support for the war.
When we apply the same process to weak supporters, a distinct picture emerges. Under Assumption 1, we take the difference between 1 and the coefficient from the list experiment for respondents reporting low risk perceptions (0.618) as our estimate of the threshold effect. For weak supporters with high survey risk perception, the corresponding difference is 0.682. Given our assumption that this group is more likely to misrepresent their war support, 0.682 represents the sum of the threshold effect and preference falsification. To estimate the share of preference falsification, we subtract the threshold effect for low-risk respondents (0.618) from this sum (0.682–0.618 = 0.064). This suggests that 6.4 per cent of weak supporters with high risk perceptions are misrepresenting their war support on the direct question. However, this estimate is statistically indistinguishable from 0. Thus, while some weak war supporters may have falsified their preferences in the February–March wave, this effect is dwarfed by the threshold effect. Intuitively, this result makes sense: if respondents were secretly opposed to the war and decided to lie on a survey, then they might as well ‘go all the way’ and express strong support. The fact that many respondents said they support the SMO on the direct question but did not count SMO on the list experiment is indicative of soft preferences rather than hidden dissent.
Applying our estimator to war opponents, we find – as expected – no evidence of preference falsification. More noteworthy is that weak war opponents in this wave appear to be affected neither by the threshold effect nor preference falsification, as the coefficients for the list experiment across both risk perception categories are almost exactly 0. But it is important to acknowledge that if we were concerned about differences between the direct and list experiment estimates in these strata, a question about the riskiness of expressing opposition to the SMO would likely be insufficient to construct an estimator. Our estimator is more appropriate for assessing the threshold effect among war supporters than opponents. To separate preference falsification from weak preferences for war opponents, one could theoretically ask two different risk questions that capture potential sensitivity bias in both directions.
Following the approach outlined above, we can construct an estimate of the overall level of preference falsification (
 $\hat {\gamma _A}$
) in our sample. Our point estimate of preference falsification for the February–March 2023 wave is 4.6 percentage points, with a bootstrapped 95 per cent confidence interval of 0.6 to 8.7 percentage points. We present the bootstrapped distribution of estimates in Figure S6.
To summarize, our analysis suggests that preference falsification accounted for a small but non-trivial share of the self-reported strong war supporters in the February–March 2023 wave of our experiment: roughly one in eight respondents who said they completely supported the SMO seem to have done so out of fear of the potential consequences of opposing the war in a survey. Subtracting these 5 percentage points of preference falsifiers, strong war supporters made up 35 per cent (not 40 per cent) of the sample across these dates. But this reduction only accounts for about a fifth of the gap between the direct experiment estimate of war support (65 per cent) and the list experiment estimate (44 per cent). Most of the remaining gap (15 percentage points) can be explained by the threshold effect among weak war supporters.
Does the gap between direct and indirect estimates of war support differ across socio-demographic groups? We compared estimates of SMO support from the direct question versus the list experiment across several key groups: gender (men/women), age (18−44/45+), education (university/no university), and income (low/medium–high). The only notable difference was by gender: the gap was significantly larger for women than for men. This could reflect either more frequent preference falsification among women or weaker/more malleable preferences; our preliminary evidence is consistent with a combination of both. Because our sample is not well-powered for fine-grained subgroup analyses, we treat these patterns as exploratory. Full results are reported in Online Appendix S.14.
Preference Falsification Versus Weak Preferences over Time
A natural next step is to assess whether the distributions of preference falsification and the threshold effect change over time, as political conditions shift. From June to July 2023, we ran another wave of list experiments. To estimate the magnitude of preference falsification versus the threshold effect for this wave, we follow the same process outlined above using the coefficients in Figure 6.
OLS coefficients and 95 per cent CIs for the traditional list experiment estimator within each subset used to estimate
 $\hat {\gamma _A}$
. Full regression tables are in Online Appendix S.12.2.

Comparing the plots from the two waves of our experiment visually, we observe little change among self-professed war opponents. The confidence intervals for war opponents cross the 0 line, indicating that we cannot reject the null hypothesis that there is no difference between the direct and list experiment estimates. In other words, effectively everyone who said they oppose the war on the direct question did not select the SMO on the list.
We observe more substantial differences between the February–March wave and the June–July wave among respondents who indicated support for the war on the direct question. The coefficients on the list experiment for people who said ‘somewhat support’ on the direct question are higher in summer 2023 than four months earlier, signifying a smaller gap between the direct and indirect estimates. Given that there are minimal differences based on perceived risk, these patterns suggest smaller threshold effects among weak supporters.
The most notable shift occurred among self-professed strong supporters. The point estimates for strong supporters with high and low perceived survey risk are similar (about 0.90 and 0.83 respectively), and the difference between them is statistically insignificant. This indicates that in the summer 2023 wave, we no longer find evidence of preference falsification among strong supporters. We do, however, find evidence of threshold effects that were not present among strong supporters in the winter wave: only 85 per cent of all strong supporters (both high and low perceived risk) selected SMO on the list experiment – a difference that is statistically different from 100 per cent. We interpret this difference as evidence of threshold effects that affected not only weak but also strong war supporters by summer 2023. This interpretation is based on evidence that preferences among strong supporters weakened between the two periods: we asked respondents during both waves of the experiment to place their support for the ‘special military operation’ on a scale from 0-100, with levels of the Likert scale from the direct question placed at regular intervals. Strong supporters in the second wave rated their support on this scale at a statistically significantly lower level than strong supporters in the first wave, as shown in Online Appendix S.16. This means that more of the strong supporters in the June–July surveys would have been susceptible to the threshold effect.
An alternative explanation for the above results is that more respondents are lying about both risk and war support in the summer wave of the survey. However, if some strong supporters began to falsify their response to both the question about war support and the risk question, we should see an increase in the proportion of strong supporters with low risk perceptions. To the contrary, we find that in the second wave, strong supporters reported a higher level of risk perception on average, as shown in Online Appendix S.17.
Applying our estimator described above to this wave’s data, we arrive at an estimate of preference falsification of 0.35 percentage points with a confidence interval of −4.0 to 4.7 percentage points. Figure 7 shows an updated version of Figure 2 that incorporates the results of our estimator. The graph suggests that non-trivial changes in the distribution of preferences occurred between the February–March 2023 wave and the June–July 2023 wave, which are not detectable when considering direct or list experiment estimates on their own. Although we estimated that 5 per cent of the sample (mostly strong supporters) misrepresented their support for war in the winter wave, we find no evidence of preference falsification in the summer wave.
Horizontal lines show our estimate of direct war support, averaged over the period on the x-axis. Black bars show indirect war support from the list experiment. Final bars shade our February–March and June–July estimates of preference falsification versus the threshold effect.

Our results are consistent with a decrease in the share of preference falsifiers in the sample. Nonetheless, a large share of respondents remained sensitive to the threshold effect in summer 2023: about 16 percentage points. During this period, the threshold effect is detectable among not just weak war supporters, but also strong war supporters. Given the significant political developments that occurred in Ukraine and Russia over this time, it is impossible to identify a single explanation for the change. Between winter and summer, drone strikes hit Moscow (Roth and Sauer Reference Roth and Sauer2023), Ukraine launched a new counteroffensive (The New York Times 2023), and a mercenary group staged a mutiny against Russia’s military leadership (Gupta Reference Gupta2023). These events almost certainly affected Russians’ attitudes towards the war.
Comparing the two waves suggests that the relative magnitude of preference falsification and the threshold effect varies over time and across subsets of the sample. Simple comparisons of direct and indirect war-support estimates obscure these patterns. We are thus hesitant to infer how earlier gaps – when we did not field the risk question – should be decomposed between deliberate dissembling and weak preferences; we leave that judgment to readers. What we can say with reasonable confidence is that much of what appears to be preference falsification likely reflects weak preferences.
Additional Evidence from Word Association Tests
Given the limitations of our list experiment analysis – chiefly, the strong assumption of no preference falsification on the risk-treatment item – a skeptical reader could still wonder whether weakly held pro-war preferences or outright concealment better explains the gap between direct and indirect support. To provide additional evidence consistent with the weak-preference mechanism underlying the threshold effect, we turn to a second technique: Word Association Tests (WAT). Embedding a WAT in our survey provides an independent and behaviorally grounded window on many Russians’ weakly held attitudes towards the war, complementing the list experiment evidence.
WATs have a century-long pedigree in psychology, dating back to Jung’s association method to uncover emotional ‘complexes’ (Jung Reference Jung1910), and to Kent–Rosanoff normative studies that first quantified common associations (Kent and Rosanoff Reference Kent and Rosanoff1910). Related reaction-time paradigms show that the content and speed of associations can reveal latent evaluations that explicit questions often miss (Greenwald et al. Reference Greenwald, McGhee and Schwartz1998; Payne et al. Reference Payne, Cheng, Govorun and Stewart2005). In its classic format, a WAT simply presents a cue word and records the first (or first several) words that come to mind. Recent political science applications confirm that WATs can uncover implicit partisan and nationalist sentiment in authoritarian contexts like China (Han et al. Reference Han, Truex and Liu2025).
From 31 October to 28 December 2022, we embedded a WAT module in the public opinion survey described in the section Data and Experimental Set-up. Each respondent saw eight cue words: one sensitive cue – special military operation – and seven distractor cues randomly drawn from a bank of high-frequency Russian nouns and cultural figures (full list in Table S17). Respondents (N = 3, 136) were randomly assigned to one of twenty experimental lists that varied both the distractor set and the sensitive-cue position, minimizing order and priming effects. For every cue, the survey recorded: (i) exact strings typed, (ii) total number of tokens, and (iii) completion time.
The most common word in responses was simply ‘war’, which represents 16 per cent of all WAT tokens (that is, text units). Many Russians use this word colloquially, despite its formal prohibition (Faulconbridge Reference Faulconbridge2023). Responses also contained words with strongly positive or negative connotations: ‘victory’ was the third most common, and ‘death’ the fourth most common. Terms associated with Kremlin-sponsored propaganda narratives surrounding the war – for example, ‘victory’, ‘protect’, and ‘Nazi’ – appear more frequently in the WAT responses of war supporters. Opponents were more likely to use the words ‘death’, ‘fear’, and ‘pain’ – a pattern reinforced by the sentiment analysis below.Footnote 13
To analyze WAT output systematically, we computed a lexicon-based sentiment score for each response and compared it to self-reported SMO support. We adapted Kulagin (Reference Kulagin2021)’s Russian sentiment dictionary KartaSlovSent (46,127 entries; scores from +1 to −1) to our stemmed tokens and scored each response as the mean sentiment of its constituent words. We made a few coding adjustments for clearly propagandistic and purely definitional terms; full pre-processing and dictionary modifications are described in Online Appendix S.18.3.
We find a strong positive association between self-reported SMO support and WAT sentiment: respondents who report stronger support tend to generate more positive associations, and stronger opponents more negative ones.Footnote 14 Figure 8 plots the predicted mean WAT sentiment score by SMO support level from a linear model with support treated as a factor variable. This modeling choice means that the figure’s monotonic trend is not an artifact of model specification. The mean scores are: 0.2 for strong supporters, 0.04 for weak supporters, −0.15 for weak opponents, and −0.35 for strong opponents; non-respondents fall near the center at −0.06. This pattern suggests that most respondents are consistent in their self-expressed attitudes towards the war, whether on the direct question or the WAT. Importantly, the smaller predicted sentiment magnitudes among weak supporters and weak opponents are consistent with the idea that their attitudes are less crystallized.
Predicted mean WAT sentiment score by SMO support level, from a linear model. ChatGPT-4o was used to help create code for this figure.

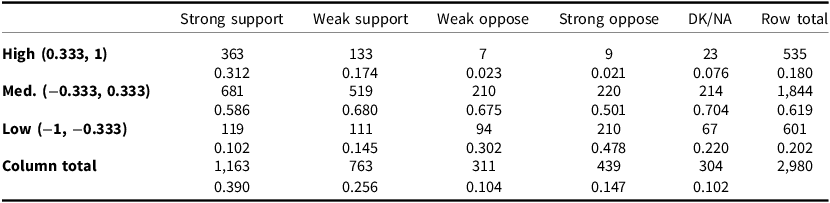
These average sentiment scores mask meaningful variation within each SMO support level, however. Even if strong supporters provide WAT responses that are positive on average, there may still be a non-trivial number whose responses are negative. To characterize this heterogeneity, we trichotomized response-level sentiment into ‘high’ (0.333 to 1), ‘medium’ (−0.333 to 0.333), and ‘low’ (1 to −0.333).Footnote 15 Table 2 presents the cross-tabulation of WAT sentiment and SMO support. For both strong and weak supporters, the most common outcome is middling rather than strongly positive sentiment: 59 per cent and 68 per cent, respectively, fall in the medium category, suggesting low associative strength. This finding is in line with our argument that many people who say they ‘somewhat support’ the war on the direct question – and possibly even some who say they ‘strongly support’ the war – have weak preferences that are vulnerable to the threshold effect.
Cross table of average WAT sentiment by SMO approval

Table 2. Long description
A table titled ‘Cross table of average WAT sentiment by SMO approval’ with four rows and six columns. The columns are labeled ‘Strong support’, ‘Weak support’, ‘Weak oppose’, ‘Strong oppose’, ‘DK/NA’, and ‘Row total’. The rows are labeled ‘High (0.333, 1)’, ‘Med. (-0.333, 0.333)’, ‘Low (-1, -0.333)’, and ‘Column total’. The table presents the following data: Row 1: Strong support, 363; Weak support, 133; Weak oppose, 7; Strong oppose, 9; DK/NA, 23; Row total, 535. Row 2: Strong support, 681; Weak support, 519; Weak oppose, 210; Strong oppose, 220; DK/NA, 214; Row total, 1,844. Row 3: Strong support, 119; Weak support, 111; Weak oppose, 94; Strong oppose, 210; DK/NA, 67; Row total, 601. Row 4: Strong support, 1,163; Weak support, 763; Weak oppose, 311; Strong oppose, 439; DK/NA, 304; Row total, 2,980. The table also includes percentages for each column: Strong support, 0.390; Weak support, 0.256; Weak oppose, 0.104; Strong oppose, 0.147; DK/NA, 0.102.
A smaller share of self-reported supporters fall into the low category (about 10 per cent of strong supporters and 15 per cent of weak supporters), indicating that some respondents who nominally endorse the SMO nevertheless associate it with negative concepts. If we assume, conservatively, that all of them are lying on the direct question, then the overall level of preference falsification is about 7.6 per cent.Footnote 16 However, this should be treated as an upper bound, as some discordance is to be expected when attitudes are weak. Indeed, about 2.1 per cent of strong war opponents and 2.3 per cent of weak opponents provide WAT responses that fall into the ‘high’ sentiment category, which is likely an indication of noise in the data, given that there are no real incentives for respondents to represent themselves as war opponents when they in fact are not. If we take the latter shares as estimates of ‘noise’, then our simple upper-bound estimate of preference falsification is 6.3 per cent – not far off the estimate of 4.6 per cent that we derived from list experiments analyzed above.Footnote 17
Limitations
Several limitations merit discussion, not least because they point towards avenues for future methodological development. First, our preference falsification estimator using list experiments is based on the assumption that the risk question is a good proxy for respondents’ willingness to falsify preferences. We assume that those who perceive low risk are highly unlikely to falsify. Although this assumption seems reasonable empirically, it is not directly testable, and some respondents may falsify regardless of perceived risk or violate the assumption in other ways. We provide suggestive evidence that it holds in this setting, but applications elsewhere will require context-specific wording and content. Relatedly, while the political-risk item is not inherently online-only, it may require additional privacy protections in a face-to-face survey (for example, self-administered entry on a tablet). Second, we have not yet developed a way to test the assumption of equivalent cut-offs within Likert categories; future work should develop tests or approaches that relax this assumption.
The fact that we find such minimal evidence of overt preference falsification may come as a surprise to readers who have observed the steady erosion of political freedoms in Russia since February 2022. Our analysis is not intended to deny the importance of widespread censorship, repression, and fear that many Russians experience. Our claims are more modest: Russians who answer public opinion surveys are not lying nearly as much as we might expect. This finding is consistent with other research conducted in Russia since the full-scale invasion, which finds minimal evidence of preference falsification (Frye et al. Reference Frye, Hale, Reuter and Rosenfeld2024) but considerable evidence of Russians who ‘support’ the war despite reservations (Rogov Reference Rogov2022). Recent work by Vyrskaia et al. (Reference Vyrskaia, Tkachenko and Martynova2025) uses telephone survey response rates to show that public opinion polling may serve as an alternative channel for political expression in wartime Russia.
Readers may naturally wonder about Russians who do not answer public opinion surveys: surely many people avoid answering surveys altogether, given the current political circumstances. Although we leave a longer discussion of this concern to future work, the design of our survey offers evidence that should mitigate this concern. The advertisement shown to potential respondents is generic, without information about the survey’s content. Respondents can opt out after reading the consent statement, which they must agree to before starting the survey. On most days on which the survey was conducted, at least 90 per cent of people who reached the consent form page agreed to participate, although there was a modest decline over time, possibly due to survey fatigue (de Koning et al. Reference de Koning, Egiz, Kotecha, Ciuculete, Ooi S.Z., Bankole N.D., Erhabor, Higginbotham, Khan, Dalle, Sichimba, Bandyopadhyay and Kanmounye2021). We do not have data on the kinds of people who chose not to answer our survey, and it is plausible that people who are prone to falsifying their preferences (namely, those with anti-war views) would be more likely to ignore the advertisement or opt out after reading the consent form. It is worth noting, however, that research from panel surveys conducted in Russia before and after the full-scale invasion shows that regime opponents were not more likely than regime supporters to opt out of surveys after February 2022 (Levada Center 2022b). If anything, Frye et al. (Reference Frye, Hale, Reuter and Rosenfeld2024) find that regime opponents were less likely to stop answering surveys. Still, we cannot rule out the possibility that the message in our consent form would disproportionately deter potential preference falsifiers. More research is needed to better understand the role of survey non-response bias in authoritarian regimes.
Although we are limited by many of the issues faced by survey researchers everywhere, this should not take away from the important insights that surveys provide in places like Russia. In a recent review, Rosenfeld (Reference Rosenfeld2023) emphasizes that surveys are ‘likely to be of central importance’ for addressing key questions about the future of Russian politics, and we must adapt our research designs to new challenges, rather than reject surveys altogether. She advises researchers to combine list experiments with other indirect methods to gauge attitudes towards especially sensitive topics. This kind of methodological innovation is precisely what our paper does.
Conclusion
We find that most Russians are not lying in surveys about their support for their country’s war against Ukraine. The fact that estimates of war support from list experiments are significantly lower than those from direct questions is not conclusive evidence of preference falsification. Our research suggests that most of the difference between direct and indirect estimates is due to weak preferences. An important implication is that previous research on public opinion in Russia and other authoritarian regimes may inflate the magnitude of preference falsification, and future work must take care to distinguish between the deliberate misrepresentation of preferences and soft preferences that may be expressed differently depending on the survey task.
Our research has implications for the study of contemporary Russian politics and research on authoritarian regimes more broadly, given how popular list experiments are for measuring sensitive political attitudes in autocracies (Blair et al. Reference Blair, Coppock and Moor2020). Absent better information about survey non-response, we refrain from making conclusive statements about the entire Russian population. What we can say with some confidence is that although direct estimates of war support among Russian survey respondents are not wrong, they do require a nuanced discussion about the nature of that support. Nearly 70 per cent of respondents expressed either weak or strong support for the war over the course of our survey. Although our analysis suggests that only a small share of respondents (around 5–6 per cent, depending on the method we use) appear to have engaged in outright preference falsification, a much larger share (around 15 per cent in January–March 2023) have preferences that are weak enough to shift depending on how the survey question is posed.
The primary contribution of this paper, however, is methodological. We show that the gap between direct and indirect estimates of support for a sensitive item can be decomposed into at least two main sources: (a) preference falsification, or the deliberate misrepresentation of one’s true attitude, and (b) the threshold effect, which occurs when the comparisons introduced by list experiments lead to different outward expressions of the same underlying preference. Simple comparisons between direct questions and list experiments are likely to overstate preference falsification, as they cannot distinguish between the two. This problem should be especially acute when the direct question lies along a distribution and when we are studying an issue for which a non-trivial subset of respondents holds weak preferences.
Given that preference falsification and the threshold effect are observationally equivalent in a list experiment setting, researchers must use other methods to separate them. In this paper, we provide evidence the threshold effect exists and that the sensitive item in our case is affected by it – a method that researchers could replicate by using a single pair of carefully chosen lists to test whether their item is sensitive to thresholding. The minimum distance between the direct item and either list in the pair can also be taken as a loose upper bound of the level of preference falsification. We then use two ways to explicitly separate liars from respondents with weak preferences. The first method relies on a risk assessment question to identify subsets of respondents who are most likely to falsify their preferences. Researchers seeking to measure preference falsification in both positive and negative directions should note that the risk question we use was designed to measure preference falsification for one side of the Likert scale (that is, war supporters who may be lying), so it should be adapted for other cases.Footnote 18 Second, we apply word association tests to understand what comes to mind when people think about the SMO. This method may be better suited to detecting a mismatch in stated preferences towards a policy and the kinds of associations people have with it for respondents on both sides of the Likert scale.
What practical consequences can we offer for interpreting the results of a list experiment? One way is to use auxiliary questions, such as our risk assessment question, to separate the threshold effect from preference falsification. Alternatively, researchers could build on our list-pairs analysis to run list experiments with pairs of lists whose control items differ in their distributions with respect to the share of respondents who strongly agree with particular items. While the fixed effects approach used in this paper would require at least eight pairs of lists, which translates into an approximate required sample size of 8,000, even a single pair with sufficient variation in the distribution of the two control items would allow researchers to assess the sensitivity to threshold effects. In all cases, it would be important to ask the sensitive question (and ideally the control items as well) on a Likert scale rather than dichotomously, since the nature of the distribution would signal the likelihood of threshold effects.Footnote 19
Where this additional information is unavailable, researchers can rely on more general guidelines about the conditions under which we would expect the threshold effect or preference falsification to be greater. Researchers should be concerned about the threshold effect when testing whether survey respondents are telling the truth about an issue that is not a binary choice. The threshold effect is primarily a function of the location of preferences, so we would expect a larger threshold effect when attitudes are closer to the middle of a distribution. Importantly, an increase in the threshold effect need not entail a decrease in preference falsification.
At least three factors should matter when we study preference falsification: the nature of the regime, the type of sensitive question, and the survey mode. All else equal, preference falsification should increase in regimes with a more aggressive approach to prosecuting divergent views; on issues where political or societal pressures are more salient; and in survey settings where respondents have more reasons to worry about the anonymity of their responses or social pressures (for example, for in-person surveys).Footnote 20
Apart from survey mode, our specific case – Russian support for the war in Ukraine – should theoretically be on the higher end for preference falsification, given the repressiveness of the Putin regime and the pressures against opposing the war. The fact that we find minimal preference falsification even in this setting suggests that preference falsification may contribute even less to the gaps observed in list experiments in surveys conducted elsewhere.
On a deeper level, our findings suggest that people living in authoritarian regimes should not be treated as closet dissidents by default. There are many Russians who oppose the war against Ukraine. There are also many Russians who actively support it. Finally, many Russians seem to express nominal support but hold weak and potentially unstable preferences, which could shift quickly and are likely to play a crucial role in the informational cascades that can sometimes topple seemingly stable authoritarian regimes. In this sense, the threshold effects we have documented in this paper should not be treated as a mere statistical nuisance – as traditional design effects typically are – but can provide important nuance to our interpretation of the nature of public opinion on sensitive issues and/or in repressive environments.
Supplementary material
The supplementary material for this article can be found at https://doi.org/10.1017/S0007123426101768.
Data availability statement
Replication data for this paper can be found at https://doi.org/10.7910/DVN/P3X1RT.
Acknowledgements
The authors would like to thank Bryn Rosenfeld, Graeme Robertson, and participants at workshops in Princeton and Astana (Kazakhstan) for helpful feedback on previous drafts. We used OpenAI’s ChatGPT (GPT-4o and GPT-5) for light copyediting (grammar and clarity) on portions of the manuscript, and to help generate code for some of the figures as noted. All substantive content, analysis, and interpretations are the authors’ own.
Financial support
This work was supported by the National Science Foundation (Award No. 2242057) and the following Princeton University-affiliated programs and centers: the Liechtenstein Institute for Self-Determination; the Program in Russian, East European and Eurasian Studies; the Mamdouha S. Bobst Center for Peace and Justice; the Data-Driven Social Science Initiative; and the Princeton School of Public and International Affairs.
Competing interests
None to disclose.
Ethical standards
The research was conducted in accordance with the protocols approved by Princeton University Institutional Review Board (Protocol No. 14697).



 γA^

 γA^




 Open access

