


NOMENCLATURE
List of abbreviations
- ALR
-
Air to Liquid mass Ratio
- CEA
-
Chemical Equilibrium Analysis
- CFD
-
Computational Fluid Dynamics
- CRN
-
Chemical Reactor Network
- EI
-
Emission Index
- ODE
-
Ordinary Differential Equation
- PaSR
-
Partially Stirred Reactor
- PFR
-
Plug Flow Reactor
- PSR
-
Perfect Stirred Reactor
- SMD
-
Sauter Mean Diameter
List of symbols
- B
-
droplet's Spalding transfer number
- Cp
-
specific heat at constant pressure
- D
-
droplet diameter
- dP
-
pressure drop
- K
-
thermal conductivity
- L
-
latent heat of evaporation
- Pr
-
Prandtl number
- Re
-
Reynolds number
- S
-
mixing parameter (unmixedness degree)
- T
-
temperature
- Y
-
mass fraction
- U
-
velocity
- λ
-
evaporation constant
- ν
-
kinematic viscosity
- ρ
-
density
- σ
-
surface tension/standard deviation
- τ
-
characteristic time
- φ
-
equivalence ratio
List of subscripts
- A
-
air
- F
-
fuel
- G
-
gas (compounds of fuel vapour and air)
- Inf
-
infinity (far from the droplet)
- M
-
based on mass transfer
- R
-
relative
- Ref
-
reference
- S
-
droplet's surface
- T
-
based on heat transfer
1.0 INTRODUCTION
According to the restrictive laws concerning the authorised levels of pollutants emission of aircrafts, the science of gas turbine design is moving toward the modification or development of a new generation of combustors. Combustion is a complex physicochemical process and its modelling is recognised as a challenging process. The combustor designer should consider a significant number of design requirements that include maximum efficiency, flame endurance, stability, and reliability; these requirements have been in conflict with each other and make the designer's job difficult. Possessing the relevant tools to model the combustion and pollutants emission is essential in the design process.
Regarding the differences that exist in the approaches of engineering design, this procedure could be divided into four phases: conceptual, preliminary, detail, and experimental tests. With progress in design steps, more details of the final product are evident. Design is an iterative procedure and it may be necessary to go back numerous times to update the process and/or apply changes based on newly gained information.
The preliminary design of the gas turbine cycle and its components are presented in existing literatures(Reference Korakianitis and Wilson1–Reference Cumpsty and Heyes4). In the aircraft gas turbine industry, stability and the fuel consumption are known as the main objectives of the combustor's design. In recent years, environmental issues and noise have gained particular importance. Therefore, several studies have concentrated on preliminary design for noise reduction(Reference Leifsson, Mason, Schetz, Haftka and Grossman5–Reference Diedrich, Hileman, Tan, Willcox and Spakovszky7). As an example, Doulgeris et al.(Reference Doulgeris, Korakianitis, Avital, Pilidis and Laskaridis8) introduced a new methodology for the preliminary design of jet engines, featuring noise reduction as the main design objective.
Applying emission prediction models in the initial phases of design have fundamental differences in comparison with the final phases. The high-fidelity approaches for combustion modelling and prediction of engines emission is mostly utilised in the detail design phase; the exact information of geometry as well as the initial and boundary conditions is required in these methodologies. In the initial phases of combustor design, only the general characteristics of the geometry and flow-field might be specified and the aim of the emission predictions in these steps is to gain a better perspective of the problem. The outputs of the conceptual design phase can be improved by using an enhanced tool for emission prediction, leading to a less costly and shorter design process.
In selecting an approach for combustion modelling and emission prediction in the initial phases of design, there are several features that must be considered. First, the model should incorporate the engine physical parameters and fluids characteristics to represent the actual phenomena. Also, a more detailed model of the chemical kinetics of the fuel is desirable. The required inputs of the model should contain high-level design parameters. For example, the engine's thermodynamic cycle data and fuel-air ratio in the combustor's zones are more applicable than the detailed data such as the cooling holes type and configurations in the mentioned design phases. Finally, the methodology must be extendable to different types of gas turbine combustors. The chemical reactor network (CRN) modelling approach can theoretically meet these requirements.
Four principal types of the ideal chemical reactor are used for constructing CRNs. They are the perfect stirred reactor (PSR), the plug flow reactor (PFR), the mixer(Reference Turns9), and the partially stirred reactor (PaSR)(Reference Chen10). Initially, Bragg(Reference Bragg11) introduced the concept of flame modelling by using a PSR followed by a PFR. Further progress in this approach was proposed by Swithenbank et al.(Reference Swithenbank, Poll, Vincent and Wright12) who model the combustor by dividing the combustor volume into zones represented by the ideal reactors elements of PSR, PFR, and mixer. Rubin and Pratt(Reference Rubin and Pratt13) studied the trend concerning the development of the zonal model for emission prediction in gas turbine combustors. In recent years, new methodologies based on extensive chemical reactor networks were introduced(Reference Fichet, Kanniche, Plion and Gicquel14–Reference Stagni, Cuoci, Frassoldati, Faravelli and Ranzi18). In most cases, the CRNs were constructed based on the details data achieved from solving the computational fluid dynamics (CFD) of the combustor flow field. In these investigations, the CRN modelling approach is used to upgrade the results of a high-fidelity methodology. Nevertheless, the application of CRN modelling in combustion systems is not limited to networks with a large number of elements. Based on the amount of available information as input, simple models were found to be valuable in combustion modelling(Reference Rutar and Malte19–Reference Xu, Shen, Li and Zheng21).
The objective of this study is to propose a newly developed methodology for modelling the aircraft's combustion chamber in the conceptual phase of the design process; the outputs are used for the prediction of pollutants emissions and also investigate the flame static stability. In this way, we focused on the chemical kinetics of the fuel, the physics of fuel evaporation, and the fuel-air mixing quality in the combustor's primary zone.
2.0 COMBUSTOR DESIGN STRATEGY
The various inputs for the design of an aircraft engine combustor in the conceptual design phase include flight conditions, thermodynamic data of engine cycles, geometrical constrains, etc. All of the operating conditions for the designed combustor must assure flame endurance, stability, and reliability with the maximum possible efficiency. In addition to these requirements, pollutant emissions is another important requirement that leads to the development of a new generation of gas turbine combustors. Nowadays, the design science of gas turbine combustors is moving toward reducing the pollutant emissions of aircraft engines.
The conventional approach to satisfy the mentioned requirements is the sizing of the different components of the combustor toward the desired flow distribution. Simultaneously, based on the design inputs and calculated geometrical and flow characteristics, the combustion kinetics of the combustor must be modelled to evaluate the performance parameters. Since a physiochemical phenomenon occurs in the gas turbine combustion chamber, the study of any type of the combustors must include the key issues of flow field analysis, combustion analysis, and also their interactions.
The first step of the proposed procedure for the conceptual designing of a conventional gas turbine combustor is presented in Fig. 1. The aims of this step are to determine the combustor's appropriate geometrical features and flow field characteristics. Before starting the design process, it is essential to define the required inputs. The inputs can be divided into two main categories: engine cycle thermodynamic data and constraints and variables of design space. The input data are used to estimate the reference diameter and area. The calculated dimensions and other input data are required for a component design module. Finally, the calculated geometrical data are used for producing an overall two-dimensional drawing of a combustor. The information concerning the mentioned methods and the calculating algorithms are provided in detail by Saboohi et al.(Reference Saboohi, Ommi and Fakhrtabatabaei22).
Flowchart of the combustor design procedure.

In addition to the stated inputs, the general data of the combustor geometry and flow distribution inside the combustor, obtained from the described procedure, are used for modelling the combustor performance. For the acceptable accuracy and desired numerical effort, the chemical reactor network (CRN) approach was chosen for the combustion analysis of combustors in the conceptual design phase. This paper focuses on the application of CRN modelling in the prediction of pollutant emissions of the combustor in the conceptual phase of design process.
3.0 MODELLING THE COMBUSTOR USING CRN
Regarding the level of the information available in conceptual design phase, the CRN approach is sought to be appropriate in analysing the finite rate combustion process. This modelling approach requires inputs from geometrical specifications (combustor's zones length, cross section and/or volume), thermodynamic data of operating conditions, and the combustion mechanism of elementary reactions and thermodynamic properties of species. This approach is based on dividing the combustor internal space into several regions, keeping the variation of physical and chemical parameters in the region small. Each region can be modelled using one or a series of ideal chemical reactors.
The type of the reactors and their connections are subject to the flow field and combustion reaction rate. The Damkohler dimensionless number is used in assigning the type of the reactors of CRNs. The Damkohler number represents the ratio of characteristic flow or mixing time to a characteristic kinetic time(Reference Turns9):
 $$\begin{equation}
{\rm{Damkohler}} = {\tau _{{\rm{flow}}}}/{\tau _{{\rm{chem}}}}
\end{equation}$$
In the study of a combustion process, Damkohler numbers greater than one mean that the chemical reaction rates of combustion are slower than the flow mixing rate. Though, for a Damkohler number smaller than one (numbers close to zero), the chemical reaction rates rules the physiochemical process.
The proposed CRN for predicting the performance of the conventional gas turbine combustor is presented in Fig. 2. The network consists of PSR, PFR, and MIXER elements. The PSR stands for perfectly (well) stirred rector. The PSR is a zero dimensional ideal reactor in which instantaneous perfect mixing of fuel and air as well as products occurs(Reference Glassman and Yetter23). The Damkohler number is assumed equal to zero for the PSRs. The plug flow reactor (PFR) is a one dimensional reactor in which flow properties change in the axial direction while remaining uniform in the radial direction (i.e. flow moves like a plug). In the MIXER reactor, no chemical reaction occurred and the entering streams mixed uniformly. More information on the ideal reactors that were utilised in constructing the CRN can be found in Turns(Reference Turns9).
A proposed CRN for aircraft gas turbine combustors.

Even though the designing details of any conventional combustor differ from each other, most of them have three distinctive combustion zones. Each of these zones has certain functions which are named as primary, secondary (intermediate), and dilution zones.
The primary zone is positioned at the beginning of the combustor liner. This zone is a place that the flame is anchored. To sustain the flame at all loading conditions, a swirler induces the recirculation flow. The swirled flow improves the fuel-air mixing and also prevents flame blow-off by recirculating the portion of the hot gases back to the flame region. Considering the above, due to the strong turbulence in a combustion process of combustor's primary zone, the characteristics mixing time is considerably shorter than the characteristics kinetic time. As a result, the Damkohler number of the primary zone is low (i.e. goes to zero). The consequence enables the modelling of the primary zone using PSRs. As shown in Fig. 2, the conventional combustor is modelled using a series of parallel reactors at the proposed CRN primary zone.
The secondary or intermediate zone is the region that is placed between the first and next set of the dilution flow holes. The role of the intermediate zone of a combustor is to allow any incomplete reactions remaining from the primary zone proceed to become complete. For this purpose, moderate amounts of diluting and cooling air are added to this zone. However, it is desirable to keep the temperature of the fuel-air mixture at a high level to improve the oxidation process of CO. In the proposed CRN, the assumption is that the degree of turbulent intensity in the intermediate zone is high enough to model this region with a PSR.
The remaining annulus air is added to the core through the second set of dilution holes. The dilution zone is the region between the mentioned holes set through the turbine inlet plane. The function of the combustor's dilution zone are to bring the hot gases to an acceptable mean temperature and also create the proper profile and pattern factor for the first stage of the turbine blades. The flow in this post-flame region is relatively calm and can be considered one-dimensional. Thus, it can be modelled accurately with PFRs. This zone is modelled in the suggested CRN via two serial plug flow reactors; in this manner, the addition of annulus air to the core region of the dilution zone is divided into two parts. The first one potentially has an impact on CO emissions, and the latter affects the pattern factor. The sum lengths of the two PFRs are considered equal to the combustor's dilution zone length.
Complementary information on the calculation of the parameters and inputs of the submitted CRN are presented in the following sub-sections.
3.1 Droplet Evaporation Model
In the current investigation, we focused on the use of liquid fuel in the combustors of aero engines. The aim of the droplet evaporation model is to determine the portion of vaporised fuel before the ignition delay time.
The fuel droplets in the proposed model were assumed as perfect spheres and given in the form of Sauter mean diameter (SMD). In the different literatures, several correlations of determining the SMD are provided for different types of atomizers(Reference Lefebvre24,Reference Lefebvre25) . Generally, the SMD of the presumed injector is a function of geometry and fluid physical properties. These parameters were used for the development of the empirical correlations for determining the fuel's mean droplet size. Pressure and air-blast are commonly used atomizer types for the application of the gas turbine combustors.
One of the most widely cited expressions for pressure atomizer is based on the Radcliffe experiments(Reference Radcliffe26):
 $$\begin{equation}
SMD = 7.3\ {\left( \sigma \right)^{0.6}}\ {\left( {{\nu _f}} \right)^{0.2}}{\left( {{{\dot{m}}_f}} \right)^{0.25}}\ {\left( {d{P_f}} \right)^{ - 0.4}},
\end{equation}$$
in which σ is the fuel surface tension, ν
f
is the fuel dynamic viscosity,
 ${\dot{m}_f}$
is the fuel mass flow rate, and dPf
is the pressure drop of the atomizer. The dissimilar pressure atomizer is mostly affected by the pressure drop while the performance of the air-blast type atomizer is reliant on the fuel and air physical properties. Furthermore, the correlation for the air-blast atomizer type introduced by Rink and Lefebvre is expressed as(Reference Rink and Lefebvre27):
 $$\begin{equation}
SMD = 0.00365\ {\left( {\frac{{{\rho _f}\sigma \ }}{{{\rho _A}^{0.5}\ {U_R}^2\ }}} \right)^{0.5}}\ {\left( {1 + \frac{1}{{ALR}}} \right)^{0.7}},
\end{equation}$$
where ρ f is the fuel density, ρ A is the air density, UR is the relative velocity of air to liquid, and ALR is the air to fuel (liquid) mass ratio.
To estimate the vaporised fraction of fuel before ignition, a transient calculation procedure presented by Lefebvre(Reference Lefebvre24) have been applied. This method uses the SMD formation and all of the fuel droplets are assumed to be uniformly distributed at the spraying moments. Also, the number of droplets is constant until they all vaporize simultaneously. With a given initial condition, the rate of change of the droplet diameter and the rate of change of the droplet surface temperature (Ts ) are given by the following equations:
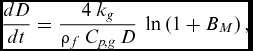 $$\begin{equation}
\frac{{dD}}{{dt}} = \frac{{4\ {k_g}}}{{{\rho _f}\ {C_{p,g}}\ D}}\ \ln \left( {1 + {B_M}} \right),
\end{equation}$$
 $$\begin{equation}
\frac{{d{T_s}}}{{dt}} = \frac{{{{\dot{m}}_f}\ L}}{{{m_D}\ {C_{p,f}}\ }}\left( {\frac{{{B_T}}}{{{B_M}}} - 1} \right),
\end{equation}$$
in which k is the thermal conductivity, L is the fuel latent heat, BM is the Spalding number based on mass transfer, BT is the Spalding number based on heat transfer, mD is the fuel droplet mass, and Cp is the specific heat at constant pressure. Correspondingly, the subscripts of f and g respectively represent the fuel and gas (compounds of fuel vapor and air) fluid properties.
The Spalding numbers are defined as follows:
 $$\begin{equation}
{B_M} = \frac{{\ {Y_{f\ S}}}}{{1 - {Y_{f\ S}}}},
\end{equation}$$
 $$\begin{equation}
{B_T} = {C_{p,g}}\frac{{{T_{inf}} - {T_s}}}{{L\ }},
\end{equation}$$
where Y fS is the droplet vapor mass fraction at the surface and Tinf is the temperature far from the droplet and can be considered equal to the compressor's exit temperature.
For solving the present system of ordinary differential equations (ODE), the parameters in the right-hand side of Equations (4) and (5) have to be known. For this purpose, the physical properties of the four groups of air, liquid fuel, vapored fuel, and gas must be calculated. The physical properties of fuel and air can be found in the handbooks of aviation fuel properties(Reference Council28). For estimating the physical properties of the vapored fuel around the droplet, according to the following equation, the reference temperature (Tref ) can be used:
 $$\begin{equation}
{T_{{\rm{ref}}}} = {T_s} + \frac{{{T_{inf}} - {T_s}}}{3}\
\end{equation}$$
The effect of convection on the droplet vaporization rate could be considered using the following equation:
 $$\begin{equation}
{C_{{\rm{convection}}}} = 1 + 0.3\ R{e_D}^{0.5}\ P{r_g}^{0.33}\ ,
\end{equation}$$
where Pr and Re are the dimensionless Prandtl and Reynolds numbers, respectively.
The mass flow ratio of vaporised fuel to the total fuel was defined as the evaporation constant (λ). This parameter is based on the d2 law and can be expressed as:
 $$\begin{equation}
\lambda \left( t \right) = - \frac{{d\ {D^2}}}{{d\ t}}\
\end{equation}$$
The combination of the convective correlation in Equation (9) with the expression of the evaporation constant in Equation (10), and considering Equation (4) leads to:
 $$\begin{equation}
\lambda \left( t \right) = - \frac{{8\ {K_g}}}{{{\rho _f}\ {C_{p,g}}\ }}\ \ln \left( {1 + {B_M}} \right)*\left( {1 + 0.3\ R{e_D}^{0.5}\ P{r_g}^{0.33}} \right)
\end{equation}$$
The above methodology is used to obtain the variation of the fuel droplet diameter (D), droplet surface temperature (Ts ), and evaporation constant (λ) after an obvious ignition delay time. The accuracy of the model is very dependent on the calculation of four groups of air, liquid fuel, vapored fuel, and gas fluids physical properties.
After the ignition delay time, part of the injected fuel that remains liquid participates in the formation of the diffusion flame. Combustion of these droplets is modelled using a PSR and equivalence ratio equal to one. The rest of the fuel and air flow are considered as pre-mixed before ignition. This mixture is not uniform. The non-uniformity of the fuel-air mixture has considerable effect on the pollutant level and temperature of the premixed flame.
3.2 Non-Uniform Mixture Model
The mixture of the evaporated fuel and air in the combustor's primary zone is not uniform. Therefore, the assumption of the general equivalence ratio for the entire mixture generates an error in the combustion modelling. To recognize the unmixedness level of the fuel and air, a Gaussian (Normal) distribution around the mean equivalence ratio (
 $\bar{\varphi }$
) is assumed(Reference Heywood and Mikus29):
 $$\begin{equation}
f\left( \varphi \right) = \left( {\frac{1}{{\sqrt {2\pi {\sigma ^2}} \ }}} \right)\ \exp \left[ { - \frac{{{{\left( {\varphi - \bar{\varphi }} \right)}^2}}}{{2{\sigma ^2}}}} \right],
\end{equation}$$
where σ is standard deviation. The mixing (Heywood) parameter (S) is defined as the ratio of standard deviation to the mean equivalence ratio
 $$\begin{equation}
S = \frac{\sigma }{{\bar{\varphi }}}
\end{equation}$$
The mixing parameter is a dimensionless number which is used as a quality measure for the non-uniformity and dispersion of the equivalence ratio in the primary zone. As the quality of mixing gets higher, the mixing parameter is reduced (goes toward zero). The mixing parameter depends on the geometrical characteristic of the combustor's components (swirler, injector, etc.) and the flow characteristic (turbulent intensity) in the primary zone. The mentioned parameters are not available in the conceptual design phase. Based on the published documents, the overall trend of unmixedness degree versus the mean equivalence ratio is comparable for different types of gas turbine combustion chambers(Reference Smith30,Reference Allaire31) .
Figure 3 shows the implemented curve fitting on the experimental data to attain a function that relates the mixing parameter to the average equivalence ratio of the combustor's primary zone. The proposed equation for curve fitting is the fifth-order polynomial as follows:
 $$\begin{equation}
S = - 0.6646\ {\bar{\varphi }^5} + 5.26\ {\bar{\varphi }^4} - 15.19\ {\bar{\varphi }^3} + 19.06\ {\bar{\varphi }^2} - 9.524\ \bar{\varphi } + 1.961
\end{equation}$$
Mixing parameter as a function of primary zone equivalence ratio.

In a certain engine's power setting, at a given mean equivalence ratio of the combustor's primary zone, the mixing parameter could be calculated via Equation (14); consequently, the standard deviation and the Gaussian distribution of
 $\bar{\varphi }$
can be attained through Equation (13) and Equation (12), respectively.
The Gaussian distribution of Equation (12) is continuous and infinite and should be discretized. Choosing an inappropriate number of intervals should be avoided as small numbers of intervals leads to weak modelling of mixture unmixedness. Conversely, selecting large numbers of intervals results in rounded-off and truncated errors growth in CRN modelling and consequently, increasing the run time.
In this paper, the primary zone of the combustor is modelled using an n-number of parallel PSRs (Fig. 2). As previously discussed, one of these reactors is used in modelling diffusion flame and the remaining ideal reactors are utilised for modelling the premixed flame in the primary zone. To model the performance of a specific engine and defined power settings, the total number of parallel PSRs is selected from an integer ranging from seven to eighteen.
The number of reactors for modelling the combustor's primary zone is finalised in an automatic process for a specific engine. In this procedure, at first the maximum mixing parameter (S) of the engine's operating conditions is found. For the selected power setting, the variable numbers of the parallel PSRs are run to the modelling of the primary zone of the combustor. The outputs of molar fractions of CO and NO emissions are taken. Then, the % change (related to the previous run) of the mentioned molar fractions are calculated and compared. The % change in outputs mole fractions for NO and CO were calculated as
 $$\begin{equation}
\% \ \Delta {\left[ {NO} \right]_{i + 1}} = \left( {{{\left[ {NO} \right]}_{i + 1}} - {{\left[ {NO} \right]}_i}} \right)\ /\ {\left[ {NO} \right]_i}.
\end{equation}$$
 $$\begin{equation}
\% \ \Delta {\left[ {CO} \right]_{i + 1}} = \left( {{{\left[ {CO} \right]}_{i + 1}} - {{\left[ {CO} \right]}_i}} \right)\ /\ {\left[ {CO} \right]_i}.
\end{equation}$$
in which i states to the number of parallel PSRs in the primary zone model. Finally, as the change of % for both of the parameters fell below 7%, the number of parallel PSRs is set respectively.
4.0 CO AND NOX FORMATION MECHANISMS
4.1 Formation of Carbon Monoxide
In the chemical reaction of hydrocarbon based fuel with air, the oxidation of CO is the main source of heat generation. The key role in the formation of CO within the combustion chamber is due to the oxidation of CO to CO2 and the dissociation of CO2 to CO. The elementary reactions of CO formation are presented in the following(Reference Turns9):
 $$\begin{equation}
CO + {O_2} \rightleftharpoons C{O_2} + O.
\end{equation}$$
 $$\begin{equation}
CO + OH \rightleftharpoons C{O_2} + H,
\end{equation}$$
 $$\begin{equation}
CO + H{O_2} \rightleftharpoons C{O_2} + OH,
\end{equation}$$
 $$\begin{equation}
CO + {H_2}O \rightleftharpoons C{O_2} + {H_2},
\end{equation}$$
These reactions continuously occur until all of the species reach equilibrium. The presence of water or hydrogen considerably enhances the CO oxidation rate(Reference Mavris32). The rate of the mentioned reactions is significantly affected by the combustor pressure and temperature. As the temperature and pressure increase, CO oxidation occurs more quickly, thus achieving a more complete combustion and lower CO emission(Reference Marchand33). Regarding the above, it can be expected that the most CO molar fraction is produced at low power settings, e.g. idle mode of engine operation.
4.2 Formation of Nitrogen Oxides
The main chemical mechanisms that form NOx are: thermal NO mechanism, prompt NO mechanism, N2O intermediate mechanism, and nitrogen dioxide formation mechanism. A brief description for each of these NOx formation mechanisms are as follows:
The thermal (Zeldovich) is the main path for NO production in gas turbine combustors which is due to the oxidation of atmospheric nitrogen at high temperatures. The production rate of NO by the Zeldovich mechanism is exponentially raised beyond the 1800 Kelvin temperatures. These temperatures ordinary exist in the region of the flame and in post flame gases of conventional gas turbine combustors. The extended Zeldovich mechanism contains the following chemical reactions(Reference Turns9):
 $$\begin{equation}
O + {N_2} \rightleftharpoons NO + N,
\end{equation}$$
 $$\begin{equation}
N + {O_2} \rightleftharpoons NO + O,
\end{equation}$$
 $$\begin{equation}
N + OH \rightleftharpoons NO + H,
\end{equation}$$
The N2O intermediate mechanism is produced in the lean mixture of fuel and low temperature conditions and can be described as follows(Reference Turns9):
 $$\begin{equation}
O + {N_2} + M \rightleftharpoons {N_2}O + M,
\end{equation}$$
 $$\begin{equation}
H + {N_2}O \rightleftharpoons NO + NH,
\end{equation}$$
 $$\begin{equation}
O + {N_2}O \rightleftharpoons NO + NO,
\end{equation}$$
The third mechanism leading to NO formation was first introduced by Fenimore(Reference Fenimore34). This mechanism is known as “prompt NO”. When Fenimore studied the laminar premixed flame, he discovered that some NO was formed particularly fast close to the flame zone, long before any formation of NO by the thermal mechanism would be predictable. The prompt NO is more prevalent in rich flames. Some of the species from the fragmentation of hydrocarbon fuel was suggested as the source (e.g. C, CH, CH2 . . .) of prompt NO formation mechanism. The initiation reactions of this mechanism could be written as follows:
 $$\begin{equation}
CH + {N_2} \rightleftharpoons HCN + N,
\end{equation}$$
 $$\begin{equation}
C + {N_2} \rightleftharpoons CN + N,
\end{equation}$$
where the first reaction is the main route of the NO prompt formation. The oxidation of HCN to NO is based on the following reactions:
 $$\begin{equation}
HCN + O \rightleftharpoons NCO + H,
\end{equation}$$
 $$\begin{equation}
NCO + H \rightleftharpoons NH + CO,
\end{equation}$$
 $$\begin{equation}
NH + H \rightleftharpoons N + {H_2},
\end{equation}$$
 $$\begin{equation}
N + OH \rightleftharpoons NO + H,
\end{equation}$$
In post-flame regions of gas turbine combustors, i.e. dilution zone, some part of the produced NO converts to NO2. In the following, the formation and destruction reactions of NO2 are described:
 $$\begin{equation}
NO + H{O_2} \rightleftharpoons N{O_2} + OH,
\end{equation}$$
 $$\begin{equation}
N{O_2} + H \rightleftharpoons NO + OH,
\end{equation}$$
 $$\begin{equation}
N{O_2} + O \rightleftharpoons NO + {O_2},
\end{equation}$$
The production rate of NO2 is higher in low temperature regions and for high temperature regions, the NO production rate is dominant. The main nitrogen oxides pollutants at the combustor outlet is the mixture of NO and NO2, which is called NOx. In most of available technical reports, the nitrogen oxides pollutant emission of gas turbine engines is expressed in terms of the amount of NO and NO2 produced (in grams) to fuel spent (in kilogram). This expression is called emission index (EI) and is applied for carbon monoxide pollutant, too.
5.0 CHEMICAL REACTION MECHANISMS OF FUEL
For modelling the gas turbine combustor using the network of ideal reactors, an appropriate chemical mechanism must be selected. So far, there are lots of combustion mechanisms available for different types of fuel(Reference Mawid, Park, Sekar, Arana and Aithal35–Reference Cuoci, Frassoldati, Faravelli and Ranzi43).
This study focuses on Jet-A (or JP-8) aviation fuel. Aviation fuels consist of more than 300 components. The percentage of the species present in these fuels differ and are dependent on the different oil wells, refineries and time of the year that they are extracted and refined. Thus, it would be more logical to use the major constituents that have the largest fractions instead of using a complete set of the fuel components in a combustion analysis(Reference Mavris32,Reference Mawid, Park, Sekar, Arana and Aithal35,Reference Montgomery, Cannon, Mawid and Sekar36) . Paraffins and aromatics are the major constituents of common aviation fuels. Therefore, by using a mixture of surrogate components of parraffins and aromatics, a simple model of fuel could be created. For Jet-A, Lindstedt and Maurice(38,39) suggested using 89-mol% of n-decane (C10H22) as a representative of alkane and 11-mol% of an aromatic fuel. The representative of the aromatic fuel can be chosen from toluene (C6H5CH3), ethyl-benzene (C6H5C2H5), or naphthalene (C10H8).
In this paper, three different chemical reaction mechanisms were examined. The first chemical mechanism, made available by Ranzi(Reference Ranzi, Frassoldati, Grana, Cuoci, Faravelli, Kelley and Law40–Reference Cuoci, Frassoldati, Faravelli and Ranzi43), was the detailed and lumped mechanism of pyrolysis, partial oxidation, and combustion of hydrocarbon and oxygenated fuels. The second is the Gas Research Institute mechanism (GRImech) version 3.0 that was created at the University of California at Berkeley by a team of researchers led by Smith(Reference Smith, Golden, Frenklach, Moriarty, Eiteneer, Goldenberg, Bowman, Hanson, Song and Gardiner37). GRI 3.0 contains the detailed combustion of C1-C3 hydrocarbon fuels. The third chemical mechanism is a reduced mechanism developed precisely for jet fuel combustion represented as C12H23 that was published by Kollrack(Reference Mattingly44).
The total number of species and reactions for each mechanism can be seen in Table 1.
Comparison of the amount of species and reaction from considered chemical mechanism

The application of chemical mechanisms in the prediction of combustor performance and the pollutants emission through CRN modelling is studied. For this purpose, the operational conditions of the primary zone of a conventional gas turbine combustor are modelled using an ideal PSR reactor. The conditions for the reactor applied are a 28 atmosphere of pressure, 9500 (cm3) volume, and an inlet gas temperature equal to 800 Kelvin.
Figures 4–6 show the results of the comparisons of the introduced chemical mechanisms. The jet fuel in the Ranzi-detailed mechanism is assumed to be a mixture of 89-mol% n-decane and 11-mol% toluene. Furthermore, assuming propane (C3H8) as a fuel in the GRI 3.0 mechanism, the results have been acquired. The assumption is made due to the similarity of the carbon-hydrogen ratio and also the equivalence of the amount of air required to stoichiometrically react between the propane and Jet-A fuel.
Reactor temperature versus equivalence ratio for a single PSR.

NO molar fraction versus equivalence ratio for a single PSR.

CO molar fraction versus equivalence ratio for a single PSR.

The overall trends of studied parameters for all three chemical mechanisms are similar. The results of GRI 3.0 and Ranzi mechanisms are in good agreement; all the values of the combustor equivalence ratio are practically in coincident. The calculated values of the produced NO and CO molar fractions of Kollrack mechanism are lower than other mechanisms. Particularly, the NO is certainly under predicted over the entire range of the equivalence ratio; this is due to the lower number of species and reactions that is presumed by the Kollrack chemical mechanism. Similarly, the Kollrack mechanism doesn't include the complete sub-mechanism of the NOx formation. The NO chemistry of the mentioned mechanism only includes thermal NO by the extended Zeldovich reactions.
The purpose of this investigation is to introduce the finest methodology to estimate the combustor emissions and its performance in the conceptual design phase. Design is an iterative procedure and in the primary phases of the combustor design, enormous amounts of combustor modelling and analysis is needed for determining the fundamental dimensions and features of the engine's combustion chamber(Reference Saboohi, Ommi and Fakhrtabatabaei22). Consequently, the important criteria for choosing the fuel combustion mechanism (moreover a realistic mechanism) are the execution time of the modelling. Using a detailed fuel chemical mechanism (such as Ranzi), more accurate results could be achieved. On the other hand, increasing the number of species and reactions in the chemical mechanism can exponentially increase the computational time of the prearranged analysis; correspondingly, the convergence becomes more difficult. To explain further, a single PSR with the Ranzi-detailed fuel mechanism is solved in several minutes, while the GRI 3.0 or Kollrack mechanisms requires in comparison less than a second to reach convergence. By considering the results of the studied fuel chemical mechanisms and the presented explanations, the GRI 3.0 mechanism is selected for the CRN modelling of the engine's performance in the conceptual design phase.
6.0 RESULTS AND DISCUSSION
To establish confidence in the proposed methodology in pollutant emission prediction, the obtained results were compared with the experimental data of two selected engines. Both of the evaluating combustors are single annular type and designed for civil aircraft engines. Part of the required data and 2D drawing of these combustors are available in the public domain(Reference Burrus, Sabla and Bahr45–Reference Burrus, Chahrour, Foltz, Sabla, Seto and Taylor47). Moreover, any information not found in the literatures, such as flow partitioning data, is acquired by using the design algorithms displayed in Fig. 1.
According to the aims of current study, this section presents the results of other potential methodologies in order to establish a more comprehensive study. Figures 7 and 8 show the results of the NOx and CO emission prediction of engine-a, respectively. Similarly, the output values of the pollutants emission of engine-b are presented in Figs 9 and 10. The pollutants emission indices are presented for the power settings of 7%, 30%, 85%, and 100% that are proportional to the ground-idle, approach, climb and Take-off operating conditions, respectively.
Comparison of the predicted and the experimental NOx emission indices for different operating conditions of engine-a.

Comparison of the predicted and the experimental CO emission indices for different operating conditions of engine-a.

Comparison of the predicted and the experimental NOx emission indices for different operating conditions of engine-b.

Comparison of the predicted and the experimental CO emission indices for different operating conditions of engine-b.

Two groups of the results in the cited figures are compared with the experimental data. The calculated results from the proposed CRN methodology in this paper with regard to the “droplet evaporation model” and the “non-uniform mixture model” are called the augmented model. In front of this denomination, the results of the CRN modelling to withdraw the effects of the fuel evaporation and the non-uniformity in the fuel-air mixture are called the simple model. In the simple model, it is assumed that 100% of the fuel evaporates at the ignition moment and the mixture is perfectly uniform. Accordingly, the primary zone of the combustor would be modelled using a PSR rather than a collection of the parallel PSRs.
The overall trends of the predicted pollutants emission indices are captured correctly as the experimental data. However, it can be stated that the EI NOx result is more acceptable than the EI CO results.
The EI NOx and EI CO prediction via the augmented modelling approach are obtained based on the unmixedness degree values that are attained from the polynomial equation which was previously presented; thus, the unmixedness parameter that is utilised for modelling the non-uniformity mixture is approximate. In other words, due to the uncertainty in the input parameters, it is normal that there are some errors in the predicted results.
When comparing the results presented in Figs 7–10, the augmented model clearly had more accurate results than the simple model for both of the studied engines and both of the emission indices. The latter confirms that by taking into consideration the droplet evaporation and the unmixedness models, an increase in the accuracy of emissions prediction in the CRN modelling approach occurs.
The EI NOx results of the augmented model produce a higher accuracy in high power settings. An overall review of the results of Figs 7–10 would reveal that the CO emission is the decisive factor in the lower power settings (i.e. ground idle) and the NOx emission is more critical in the higher power settings (i.e. take-off).
In Figs 8 and 10, at a low power setting of ground idle condition for both engines, the simple model shows lower values for CO emission than the augmented model. It can be stated that this is due to the low equivalence ratio of the primary zone at the mentioned flight condition. In general, the source of CO production at low power settings is due to the high temperature local regions produced by diffusion burning of the droplets or non-uniform fuel-air mixture. In the simple model, with the lack of consideration of droplet evaporation model and non-uniform mixture model, every local hot region that is the source of the CO production is removed. Though, in the augmented CRN model, some of the parallel PSRs are employed to model the diffusion flame and local high temperature regions with more equivalence ratio as compared to the average equivalence ratio of the primary zone.
In the post-processing of the results of the augmented CRN modelling, the production rates of both CO and NOx emissions were calculated after each zone. The results of engine-b are presented for four power settings in Figs 11 and 12.
Combustor zone contribution of CO emission.

Combustor zone contribution of NOx emission.

The overall form of zone contribution of CO emission in all the studied power settings is similar. By reason of the high temperature regions and diffusion flame, most of the CO is produced in the primary zone and large quantities of the produced CO is oxidised to CO2 in the secondary zone. In the dilution zone, flame does not exist and therefore, CO pollutant is not formed; on the other hand, there are minor values of CO pollutants for oxidization to CO2. Therefore, the dilution zone plays a minor role in the production or oxidation of CO emission in comparison with primary and intermediate zones.
Comparing the results presented in Figs 8 and 10 with Fig. 11, an important point arises. The amounts of CO formed in the primary zone of the take-off condition is greater than that formed in the primary zone of other flight conditions. In other words, even though the CO emissions from the combustors increased by reducing power settings, the CO formation in the primary zone of the combustor had a reverse trend. The latter is consistent with CO kinetics since at low equivalence ratios, CO oxidation does not occur fast enough to produce equilibrium values of CO(Reference Lefebvre25,Reference Allaire31) .
Figure 12 shows that NOx are mainly produced in the primary zone and the amounts of NO emission are much more than the NO2 emission in this zone. The overall form of zone contribution of the NOx emission at an idle-ground operating condition as opposed to the other cases is different. In this case, a considerable part of the produced NO is oxidised to the NO2 at the secondary and dilution zones.
As discussed earlier, the Zeldovich mechanism is the main route of NOx formation in the gas turbine combustors and its production rate is strongly dependent on the temperature. In all of the flight conditions, the majority of the NOx is produced in the primary zone that has the highest temperature. By lowering the power settings from take-off to ground-idle conditions, the temperature in the primary zone decreases because of the reduction in the combustor's pressure and equivalence ratio of the fuel-air mixture. The latter makes a significant difference in the amount of NOx production of the primary zone in the so-called operating conditions. In the post flame zones of the combustors, some part of the produced NO converts to NO2. The results of Fig. 12 show that in secondary and dilution zones of approach and ground-idle conditions, the thermal mechanism is not a decisive formation of NOx pollutant in regard to the minor temperature and the greater residence time (lower mass flow compared to other conditions).
Figure 13 displays the axial variations of temperature inside the combustion chamber. In each graph, two sets of temperature calculations obtained from equilibrium analysis and augmented CRN model are shown. In the chemical equilibrium analysis (CEA), it can be assumed that the residence time is considered large enough for both reactants and products are reached in concentrations which do not have a tendency to change with time. The mentioned state is known as chemical equilibrium. In the equilibrium model, the rise in the temperature of the combustion of the definite fuel is the function of inlet temperature, combustor pressure, combustion efficiency and equivalence ratio. Using outputs of the component design module, the equivalence ratio of all the combustor's zones at different flight conditions can be found. A NASA CEA code was utilised for the calculation of axial temperature by the CEA approach(Reference Gordon and McBride48).
Axial temperature variations across combustor zones.

As expected, predicted temperature values via the CRN modelling approach are lower than the equilibrium analysis. The latter is due to the assumption of combustion efficiency for the ideal equilibrium analysis equals to unity despite; the CRN model implicitly considers efficiency in the model through the residence time of the reactors and equivalence ratio distribution. Closer determination of temperature to the experiment leads to more accurate pollutants emission prediction results.
The augmented CRN model could be used to analyse the combustor stability. A static stability loop is determined by running the CRN model at different operating conditions until flame extinction is detected. Figure 14 illustrates the engine-b stability loop at the take-off condition. The resulting plot shows that the mixture mass flow rate at the design point have margins of several orders of magnitude far from the blowout value; this confirms that the engine can operate stably at this point.
Predicted combustor stability loop of engine-b using augmented CRN model.

7.0 CONCLUSION
In this paper, an augmented CRN model for the prediction of aircraft engine emission is created and applied to two different gas turbine combustors. The results are compared with the actual experimental data for the estimation of pollutants emissions in different power settings. The results demonstrated that the model could realistically capture the trend of the changes of NOx and CO. Also, the augmented CRN model yields more accurate results in comparison with the other possible CRN approaches in the conceptual phase of the design procedure.
The possibility of the applying the chemical combustion mechanism with the large number of intermediate reactions are obtainable for the CRN modelling approach. Therefore, three different chemical mechanisms for Jet-A fuel have been studied. Considering various aspects of the use of mechanisms in combustor's emission prediction modelling, the results show that the GRI 3.0 mechanism was more appropriate to the defined targets.
In the current work, the droplet evaporation model was used to capture the generalised physics of evaporation. This model divides the part of fuel-air mixture that participated to the diffusion flame from the premixed flame. The limitation of a model is that we assumed a single droplet size for the distribution of fuel that is in contradiction with the main physics. As a result, a more realistic model that considers the distribution of the fuel droplet at any position of the combustor can improve the accuracy of the emission model.
It could be noted that although the combustor's performance must be ultimately derived from the full-scale engine tests, the augmented CRN model gives an applicable tool to the prediction of engine behaviour in initial design phase, parametric studies, and also further investigations such as fuel operability ranges. Although this methodology is only applied to the conventional combustion chambers, it can be implemented to other recent configurations with minimal changes.
7.1 Limitations and Future Studies
The objective of the present work was to introduce a methodology for modelling the chemical reactions of combustion and the prediction of engine emissions in the conceptual design of the gas turbine combustors. In this design stage, the details of the combustor's geometry are not defined and thus, it is not possible to use the high fidelity approaches for modelling the internal flow-field. In the development of the presented emission model, the simplicity and the execution time are considered as two major characteristics. Nevertheless, according to the above-mentioned preface, the limitations of this study are listed as follows:
-
• Combustion instability prediction
-
• Accurate CO prediction (particularly in low power settings)
-
• Not considering the effects of heat transfer by liner and casing walls
-
• Not considering the effects of the engine's other components such as the turbine and nozzle on the pollutants emission
It should be noted that some of the issues raised are difficult to incorporate even in the more detailed modelling approaches.
In future studies, the proposed augmented CRN model could be enhanced by using PaSR in the areas that combustion and flow characteristic times have a close order. Also, the replacement of the unmixedness degree correlation with a better one (based on physical parameters of combustor) could improve the results.



