INTRODUCTION
The widely recognised increase in central and western European population densities following the local appearance of farming (Collard et al., Reference Collard, Edinborough, Shennan and Thomas2010; Hinz et al., Reference Hinz, Feeser, Sjögren and Müller2012; Stevens and Fuller, Reference Stevens and Fuller2012; Shennan et al., Reference Shennan, Downey, Timpson, Edinborough, Colledge, Kerig, Manning and Thomas2013; Timpson et al., Reference Timpson, Colledge, Crema, Edinborough, Kerig, Manning, Thomas and Shennan2014; Whitehouse et al., Reference Whitehouse, Schulting, McClatchie, Barratt, McLaughlin, Bogaard, Colledge, Marchant, Gaffrey and Bunting2014) is attributed to a suite of advantageous effects of agriculture including the increased dietary availability of a greater complement of carbohydrate-rich plant foods (i.e., in Eurasia the grain crops such as cereals and pulses), reduced mobility, earlier onset of weaning, and concomitant higher fertility (Bocquet-Appel, Reference Bocquet-Appel, Bocquet-Appel and Bar-Yosef2008, Reference Bocquet-Appel2011; Shennan, Reference Shennan, Bocquet-Appel and Bar-Yosef2008, Reference Shennan2018). Annual population growth rates for some regions in the early Neolithic are estimated to have been as high as 1.2% per year (fig. 5 in Bocquet-Appel, Reference Bocquet-Appel2002), which, in the absence of outmigration, would have tripled the size of regional populations in under a century. This is clearly not sustainable and it is thus not surprising that the rapid increase in population did not persist for more than a few centuries before growth rates declined as density-dependent effects on survival and reproduction took hold (Shennan, Reference Shennan, Bocquet-Appel and Bar-Yosef2008; Downey et al., Reference Downey, Bocaege, Kerig, Edinborough and Shennan2014, Reference Downey, Haas and Shennan2016).
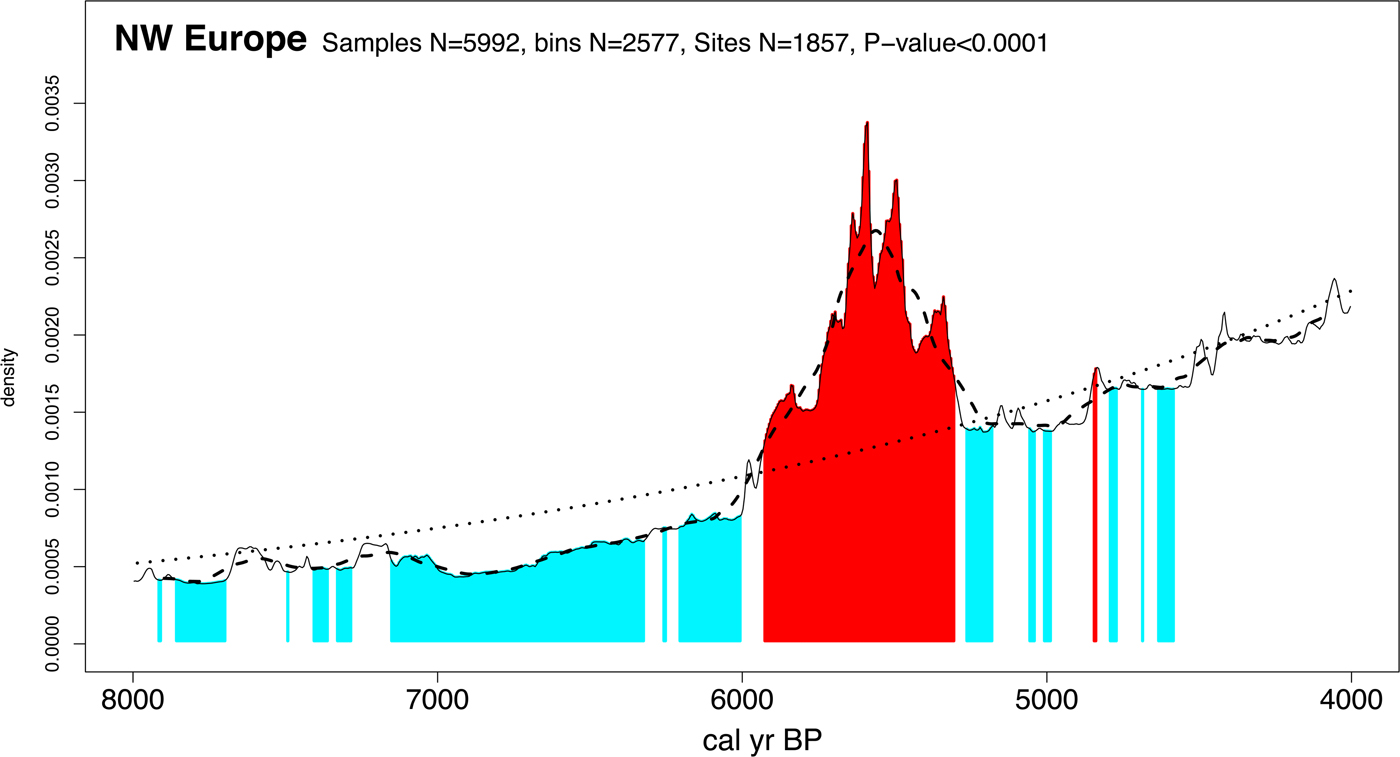
Analysis of radiocarbon summed probability distributions (SPDs) provides insight into the chronology and scale of this demographic process across different regions of central and western Europe (for discussions of the method and sampling issues, see Shennan et al. [Reference Shennan, Downey, Timpson, Edinborough, Colledge, Kerig, Manning and Thomas2013]). For example, it has been demonstrated that there was particularly rapid growth of northwest (NW) European populations starting about 5950 cal yr BP and reaching a peak approximately four hundred years later (at ~5550 cal yr BP). Populations then rapidly declined until ~5250 cal yr BP, followed by several centuries of densities far lower than their previous peak (Fig. 1).
Summed calibrated date probability distribution inferred population density change ~7950–3950 cal yr BP for NW Europe (Manning et al., Reference Manning, Timpson, Colledge, Crema and Shennan2015). Statistically significant positive and negative deviations from a null model of exponential growth are indicated in red and blue, respectively. Dotted line shows the fitted null exponential model. (For interpretation of the references to color in this figure legend, the reader is referred to the web version of this article.)

The inferred change in population densities from the early to middle Neolithic has been characterised as a “boom-and-bust” pattern and is recognisable across most of central and western Europe, although with some regional differences in intensity and periodicity (Collard et al., Reference Collard, Edinborough, Shennan and Thomas2010; Hinz et al., Reference Hinz, Feeser, Sjögren and Müller2012; Shennan, Reference Shennan2013; Shennan et al., Reference Shennan, Downey, Timpson, Edinborough, Colledge, Kerig, Manning and Thomas2013; Timpson et al., Reference Timpson, Colledge, Crema, Edinborough, Kerig, Manning, Thomas and Shennan2014; Whitehouse et al., Reference Whitehouse, Schulting, McClatchie, Barratt, McLaughlin, Bogaard, Colledge, Marchant, Gaffrey and Bunting2014). However, the SPDs for Ireland, Scotland, and England exhibit trends similar to the overall NW European pattern, with a period of rapid growth at the introduction of agriculture (~5950 cal yr BP) followed by a crash between ~5450 and ~5250 cal yr BP (fig. 3 in Shennan et al., Reference Shennan, Downey, Timpson, Edinborough, Colledge, Kerig, Manning and Thomas2013; fig. 3 in Timpson et al., Reference Timpson, Colledge, Crema, Edinborough, Kerig, Manning, Thomas and Shennan2014). Explanations to account for the demographic crash after the initial growth of farming populations have been much debated. When carrying capacities increase due to intensification of food production and food management strategies, a complex of factors, both cultural and ecological, determine how long the new levels are sustainable. Declines in agricultural productivity as a result of soil exhaustion, erosion, or deleterious climatic changes affecting rainfall and temperature will, in the absence of mitigation strategies, reduce local carrying capacity and lead to population decrease. In such scenarios, stability may be dependent upon further intensification of food production systems, increasing the capacity of food storage and distribution of resources, and related changes in social relationships to enable resource management and control. For NW Europe, Hinz et al. (Reference Hinz, Feeser, Sjögren and Müller2012, p. 3340) have proposed that “the population decrease…around 3350 cal BC cannot be explained as easily and its explanation can probably be found in the social realm”. Opinions vary as to the role of climate: Shennan et al. (Reference Shennan, Downey, Timpson, Edinborough, Colledge, Kerig, Manning and Thomas2013) could not find a convincing pan-regional correlation with palaeoclimate proxies but others, notably Verrill and Tipping (Reference Verrill and Tipping2010), Stevens and Fuller (Reference Stevens and Fuller2012, Reference Stevens and Fuller2015), Whitehouse et al. (Reference Whitehouse, Schulting, McClatchie, Barratt, McLaughlin, Bogaard, Colledge, Marchant, Gaffrey and Bunting2014), Bevan et al. (Reference Bevan, Colledge, Fuller, Fyfe, Shennan and Stevens2017), and Warden et al. (Reference Warden, Moros, Neumann, Shennan, Timpson, Manning and Sollai2017), have presented evidence that links declines, or even abandonment, of Neolithic cereal-based agriculture with climatic deterioration.
The suggestion of a correlation between declines in agricultural productivity and a decrease in population density is compelling, but it remains to be tested at the wider geographic scales from which Neolithic population histories have been reconstructed. Our geographic focus in this paper is NW Europe (Fig. 2) and our assessment of relationships between population levels and agricultural productivity is limited to this region. However, because the “boom-and-bust” pattern is documented more widely across central and western Europe (see previous references), our study is also applicable at a broader scale for the general explanation that demographic declines are correlated with changes in the Neolithic agricultural economy.
Map showing location of sites with archaeobotanical records included in the study.
1, Abingdon; 2, Albersdorf-Brutkamp LA 5; 3, Achnasavil; 4, Alt Chrysal; 5, Ballinglanna North; 6, Ballybannon; 7, Ballinaspig More; 8, Ballintaggart; 9, Boghead; 10, Bromfield; 11, Briar Hill; 12, Bharpa Carinish; 13, Barrow Hills; 14, Barnhouse; 15, Balbridie; 16, Caythorpe; 17, Caw; 18, Caherabbey; 19, Cherryville; 20, Claish Farm; 21, Clowanstown; 22, Cowie Road; 23, Coneybury “Anomaly”; 24, Carzield; 25, Deer's Den; 26, Down Farm; 27, Dösjöbro; 28, Eisendorf; 29, Enagh; 30, Flögeln; 31, Flagstones; 32, Gortaroe; 33, Gortore 1; 34, Granny; 35, Gransha; 36, Haggardstown; 37, Hazendonk; 37, Hazendonk; 38, Hereford—Asda site; 39, Hekelingen 3; 40, Hemmingstedt LA2; 41, Hambledon Hill; 42, Hjulberga; 43, Hazleton North; 44, Harristown Big; 45, Ibister “Tomb of the Eagles”; 46, W59 King Barrow Ridge; 47, Kerloge; 48, Kilsheelan; 49, Kinbeachie; 50, Knap of Howar; 51, Karlsfält; 53, Lidsø; 54, Lønt; 55, Lismore Fields; 56, Magheraboy; 57, Maiden Castle; 58, Månasken; 59, Marton-le-Moor; 60, Monanny; 61, Mogetorp; 62, Moel y Gerddi; 63, Newrath 35; 64, Newrath 37; 65, Oldenburg Dannau LA191; 66, Oldenburg Dannau LA77; 67, Østerskov Å; 68, Pool; 69, Piledal; 70, Potlock cursus monument; 71, Pepperhill; 72, Rastorf LA6c; 73, 3017 Reading Business park; 74, Rijswijk-Ypenburg; 75, Russellstown; 76, Rowden; 77, Scord of Brouster; 78, Schipluiden-Harnaschpolder; 79, Bad Segeberg LA 93; 80, Spodsbjerg; 81, Spong Hill; 82, Sarup; 83, Stora Råby; 84, Stones of Stenness; 85, Stengade; 86, Sturup; 87, Svenstorp; 88, Tankardstown Site; 89, Thirlings; 90, Tofts Ness; 91, The Stumble; 92, Tullahedy; 93, Visborg; 94, Windmill Hill; 95, hitesheet Down; 96, Windmill Hill—external features; 97, West Kennett Palisade; 98, Wangels LA505; 99, Wateringen 4; 100, Whitton Hill.

FARMING SYSTEMS IN NEOLITHIC EUROPE
In part based on analogy with ethnographically observed slash-and-burn agriculture in tropical southeast (SE) Asia, it was long assumed that early Neolithic farming introduced to central and some parts of western Europe in the second half of the eighth millennium BP was based on shifting cultivation (for a comprehensive review of the literature see Bogaard, Reference Bogaard2004). Shifting cultivation—and the necessity to move to new plots after one to three years to ensure stability in crop yields—gave rise to the concept of migratory farmers who moved across Europe taking with them the domestic crops that were first cultivated in southwest (SW) Asia (Bogaard, Reference Bogaard2004). It is an extensive system of production, with low labour input and low returns per unit area, but high returns per capita (table 1 in van der Veen, Reference van der Veen2005), and involves the opening up of small plots in wooded areas by tree felling, followed by burning of the cleared surfaces and cut timbers (Nye and Greenland, Reference Nye and Greenland1965; Juo and Manu, Reference Juo and Manu1996; Schier et al., Reference Schier, Ehrman, Rösch, Bogendrieder, Hall, Herrman, Schultz, Kerig and Zimmerman2013). Crops are sown or planted directly in the cleared layer, usually without any prior preparation of the soil, and subsequent growth is enhanced by the nutrient-rich ash that accumulates after burning (Nye and Greenland, Reference Nye and Greenland1965; Schier, Reference Schier2009). Although crop yields are maintained at high levels for the first two to three years, subsequent annual returns decline to such an extent that further cultivation on the same plot becomes unviable due to the rapid depreciation in soil fertility because of the high net nutrient losses that shifting cultivation incurs (Nye and Greenland, Reference Nye and Greenland1965; Kleinman et al., Reference Kleinman, Pimentel and Bryant1995; Juo and Manu, Reference Juo and Manu1996; Rösch, Reference Rösch2012; Schier et al., Reference Schier, Ehrman, Rösch, Bogendrieder, Hall, Herrman, Schultz, Kerig and Zimmerman2013). Nutrient reserves are restored and soil productivity is improved in the long fallow period after cultivation and cropping (Kleinman et al., Reference Kleinman, Pimentel and Bryant1995; Schier et al., Reference Schier, Ehrman, Rösch, Bogendrieder, Hall, Herrman, Schultz, Kerig and Zimmerman2013).
Over the last two decades advances in archaeobotanical analysis and reevaluation of data previously used in support of shifting cultivation has led to the formation of a new model. Based on direct evidence from weed assemblages in crop-rich samples (for detailed discussion, see Weed ecology in the Methods section) and, more recently, isotopic analysis of crop and faunal material (Fraser et al., Reference Fraser, Bogaard, Heaton, Charles, Jones, Christensen, Halstead, Merbch, Poulton, Sparkes and Styring2011; Bogaard et al., Reference Bogaard, Fraser, Heaton, Wallace, Vaiglova, Charles and Jones2013, Reference Bogaard, Hodgson, Nitsch, Jones, Styring, Diffey and Pouncett2016), the current consensus is that the early Neolithic farming in central and parts of western Europe, which was almost entirely confined to loess-based soils, was instead founded on a system of intensive cultivation that ensured sustainable practices and occupational permanency (Maier, Reference Maier1999; Bogaard, Reference Bogaard2002, Reference Bogaard2004, Reference Bogaard2005; Jacomet et al., Reference Jacomet, Leuzinger and Schibler2004; Bogaard and Jones, Reference Bogaard, Jones, Whittle and Cummings2007; Jacomet, Reference Jacomet2009; McClatchie et al., Reference McClatchie, Bogaard, Colledge, Whitehouse, Schulting, Barratt and McLaughlin2014). The hypothesis that cultivated soils would have become rapidly depleted of nutrients (thus leading to the adoption of shifting cultivation methods) has been rejected on the basis of field trials in which application of fertilisers (e.g., midden deposits and animal manure) and the use of appropriate field maintenance techniques suggest that sustainable yields can occur whilst continuously cropping (Bogaard, Reference Bogaard2002, Reference Bogaard2004, Reference Bogaard2005). Also, the claimed lack of evidence for long-term occupation of early Neolithic sites in Europe that had been cited in support of transient and shifting cultivation has now been discounted, at least for the Linearbandkeramik (LBK) early Neolithic of central Europe (Bogaard, Reference Bogaard2004); some sites, e.g., Vaihingen in southern Germany, were occupied for hundreds of years (Bogaard et al., Reference Bogaard, Krause and Strien2011). Moreover, compared to tropical slash-and-burn systems where the maintenance of soil productivity is totally reliant on the “resting fallow” period because of leaching of nutrients through high rainfall, it is argued that the fertility of intensively cultivated soils recovers more easily in temperate climates, and the greater reliance on domestic mammals in Neolithic Europe, especially cattle, meant that there was a guaranteed supply of manure (Nye and Greenland, Reference Nye and Greenland1965; Bogaard, Reference Bogaard2004; van der Veen, Reference van der Veen2005).
This system of intensive cultivation is small in spatial scale and the investment of labour produces high returns per unit of land but low returns per capita (Bogaard, Reference Bogaard2004; Jones, Reference Jones2005; van der Veen, Reference van der Veen2005; McClatchie, Reference McClatchie and Smith2014). In an efficiently functioning intensive system, the aim is not only to maintain productivity but also to enhance crop yields by using land management techniques that preserve and improve soil quality (i.e., rather than by expanding the area under cultivation, as in extensive farming systems), so that increased frequency of cropping is viable (Reeves, Reference Reeves1997; McClatchie, Reference McClatchie and Smith2014). Its success, in terms of long-term sustainability, is reliant not only on the adequate investment of labour and the efficient organisation of seasonal scheduling throughout the annual cultivation cycle, but also on the close interrelationship with small-scale animal husbandry (Bogaard, Reference Bogaard2005). The benefits of fully integrated “intensive mixed farming” are clear: the welfare of livestock is assured because there is guaranteed year-round provision for their nutritional needs in the form of fodder (crop by-products) and forage (crop stubble), the end-product of which is manure that can be used to fertilise the fields (Bogaard, Reference Bogaard2005, pp. 179–180; for references on isotopic analyses and their relevance to reconstructions of past land use, see Fraser et al. [Reference Fraser, Bogaard, Heaton, Charles, Jones, Christensen, Halstead, Merbch, Poulton, Sparkes and Styring2011] and Bogaard et al. [Reference Bogaard, Fraser, Heaton, Wallace, Vaiglova, Charles and Jones2013]). Addition of manure ensures that soil organic matter and nutrients are replaced and losses incurred during cultivation (e.g., tillage and harvesting) are compensated for, and therefore soil productivity is maintained (Bakels, Reference Bakels1997; Isaakidou, Reference Isaakidou, Hadjikoumis, Robinson and Viner2011; Bogaard, Reference Bogaard and Jones2012; for discussion of the possible deficiencies in animal manure during the Neolithic, see Bogaard [Reference Bogaard and Jones2012]). The inference being, therefore, that this model of Neolithic agriculture was founded on an intensive system of cultivation that was sustainable (i.e., long-lived or permanent) and involved husbandry practices that preserved soil productivity over prolonged crop harvest cycles (Kleinman et al., Reference Kleinman, Pimentel and Bryant1995; Bogaard, Reference Bogaard2002, Reference Bogaard2005; Bogaard and Jones, Reference Bogaard, Jones, Whittle and Cummings2007; Jacomet, Reference Jacomet2009; Bogaard et al., Reference Bogaard, Krause and Strien2011, Reference Bogaard, Fraser, Heaton, Wallace, Vaiglova, Charles and Jones2013; McClatchie et al., Reference McClatchie, Bogaard, Colledge, Whitehouse, Schulting, Barratt and McLaughlin2014).
According to the fixed plot model, cultivation on the same plots of land over long periods was long-lived, therefore maintained populations and precluded the need for frequent relocation. On the basis of evidence derived from archaeobotanical records of weeds of cultivation found in crop-rich samples, small-scale, intensive, “garden-type” cultivation was first proposed for the early Neolithic LBK of the central European loess belt and has subsequently been applied more widely to the middle/late Neolithic and to other regions of Europe, e.g., the northwest and the Alpine Foreland in the south (Bogaard, Reference Bogaard2002, Reference Bogaard2004, Reference Bogaard2005; Bogaard and Jones, Reference Bogaard, Jones, Whittle and Cummings2007; Jacomet, Reference Jacomet2009; McClatchie et al., Reference McClatchie, Bogaard, Colledge, Whitehouse, Schulting, Barratt and McLaughlin2014). The fixed-plot model of sustainable returns and occupational permanency is argued to have characterised central and western Neolithic agriculture, to such an extent that “the practice of intensive cultivation itself was a central expression of Neolithic ideology” (Bogaard, Reference Bogaard2004, p. 169). However, two aspects of this system remain unclear for areas beyond the central loess belt of preferred LBK soils: (1) the long-term (i.e., over several centuries) viability of intensively worked soils of different characteristics; and (2) the relative performance of fixed versus shifting strategies of field management. In fact, given the Neolithic “boom and bust” population pattern documented by Shennan et al., (Reference Shennan, Downey, Timpson, Edinborough, Colledge, Kerig, Manning and Thomas2013) and also evidence that post-LBK (middle and late Neolithic) agricultural systems in Europe may have adopted shifting cultivation strategies with long fallow periods (Rösch, Reference Rösch1993; Schier, Reference Schier2009; Schier et al., Reference Schier, Ehrman, Rösch, Bogendrieder, Hall, Herrman, Schultz, Kerig and Zimmerman2013; for an alternative viewpoint, see Jacomet et al. [Reference Jacomet, Ebersbach, Akeret, Antolin, Baum, Bogaard and Brombacher2016]), it is reasonable to consider the possibility that the system of intensive, fixed-plot cultivation may not have been sustainable over the very long-term, independently of any hypothesised climate-driven worsening of growing conditions.
HYPOTHESES
What was the relationship between the Neolithic agricultural economy and changes in population densities observed between ~5950 and ~5250 cal yr BP? Although climate forcing is a distinct possibility (e.g., as recently tested by Bevan et al., Reference Bevan, Colledge, Fuller, Fyfe, Shennan and Stevens2017), it should also be considered that early Neolithic cultivation practices themselves were detrimental to soil health. We thus consider in some detail the relationship between cultivation and soil degradation to evaluate the possibility that this was a further factor in the decline in agricultural productivity over the period in question. The hypothesis that we develop and test in this paper proposes that the Neolithic population decline was exacerbated by a decrease in the productivity of crop-based agriculture. The alternate hypothesis is that observed regional population crashes were unrelated to agricultural output—e.g., the “social reasons” alluded to by Hinz et al. (Reference Hinz, Feeser, Sjögren and Müller2012). To test the hypothesis, we evaluate the correlation between population change, crop use, and soil quality for the time period in question. By showing that archaeobotanical data for domestic crop taxa and weeds (e.g., as indicators of field ecologies) change in ways consistent with a reduction in productivity, we strengthen the hypothesis that Neolithic farming practices were a contributory factor in the decline, and loss of productivity is a reasonable causal explanation for the population crash.
MATERIALS
The data for this analysis were collated during the Cultural Evolution of Neolithic Europe project (EUROEVOL, http://www.ucl.ac.uk/euroevol), the geographical scope of which is the western half of temperate Europe, covering the period from ~7950 to ~3950 cal yr BP (Manning et al., Reference Manning, Timpson, Colledge, Crema and Shennan2015, Reference Manning, Colledge, Crema, Shennan and Timpson2016; http://discovery.ucl.ac.uk/1469811/). The EUROEVOL database includes archaeobotanical data for 334 sites with 398 phases (for the applied definition of “phase,” see Shennan et al. [Reference Shennan, Downey, Timpson, Edinborough, Colledge, Kerig, Manning and Thomas2013]) that are taken from published reports, in which there are comprehensive lists of plant taxa together with descriptions of criteria used to confirm identifications, and details of sampling (e.g., sample sizes and contexts sampled) and recovery methods (e.g., flotation, wet-sieving, dry sieving, and mesh sizes; Colledge, Reference Colledge2016). The data are entered in the database at the level of site or site phase, our rationale being that the project aims are concerned with comparisons at broad regional scales, for example, assessment of intra- and interregional processes and not individual site-based activities, for which much more detailed sample information would be required.
We assess our hypothesis of a link between population declines and agricultural productivity in the following sections using archaeobotanical data extracted from the published records for 110 phases (from 100 sites) in NW Europe (Britain, Denmark, northern [N] Germany, Ireland, Netherlands, and southern [S] Sweden) dating between 5950 and 4700 cal yr BP (Fig. 2). The majority of site records are from Britain and Ireland (45% and 25%, respectively) and those from other countries in the study area comprise just under a third of the total (30%). Selection of the data was made with reference to review articles by Moffett et al. (Reference Moffett, Robinson, Straker, Milles, Williams and Gardner1989), Robinson (Reference Robinson2003), Jones and Rowley-Conwy (Reference Jones, Rowley-Conwy, Colledge and Conolly2007), Bishop et al. (Reference Bishop, Church and Rowley-Conwy2009), Kirleis et al. (Reference Kirleis, Klooß, Kroll and Müller2012), and McClatchie et al. (Reference McClatchie, Bogaard, Colledge, Whitehouse, Schulting, Barratt and McLaughlin2014) in which regional lists of sites with archaeobotanical records are provided. Many of the sites listed were excluded from our data set because they did not conform to the parameters defined for the analysis; for example, no cereals were present, site dates were too late for our study (or there was insufficient information on dating), or site locations were outside the study area. In addition, several site records could not be accessed because they were in unpublished reports. We also omitted archaeobotanical records for taxa that were waterlogged, on the basis that the rate of survivability of plant materials preserved by waterlogging is disproportionately higher than those preserved by charring and any comparisons between the two are therefore likely to be biased in favour of the greater quantity and diversity of the former type of remains (Colledge and Conolly, Reference Colledge and Conolly2014). All records of domestic crops and wild species are included in the data set. We used presence data rather than count data in our analyses and, to avoid duplication, different plant parts of same species or genera were amalgamated so that for each there is a single record only. The rationale for this being that we wanted to compare individual species rather than their constituent plant parts per se.
METHODS
We test for declines in agricultural productivity between 5950 and 4700 cal yr BP in three ways, by assessing the data set for significant changes in: (1) the representation of cereal crops over time that indicate a shift to taxa more tolerant of poorer soils or; (2) changes in weed ecology that indicate a reduction of soil fertility; and (3) changes in site location patterns that indicate a higher incidence on lower ranked soils, all of which are suggestive of a deterioration in growing conditions. Each set of data and statistical evaluation is described separately in the sections that follow.
Neolithic agricultural ecology in NW Europe
Cereal crops
All crops have defined minimum and maximum abiotic requirements (most crucially in terms of temperature and moisture levels) below or above which viability is compromised, and between which environmental factors that determine healthy growth are the most favourable (referred to as the ecological optimum; Grigg, Reference Grigg1989; cf. edaphic optimum, see below). Critical variables, such as precipitation, solar energy, day-length, and temperature, are dependent on latitude and in the north at high latitudes, for example, conditions are suboptimal for many crops and as a consequence yields are reduced (Grigg, Reference Grigg1989). Thus if there are declines in soil fertility or extended cold periods with high rainfall, we would expect there to be increased use of crops capable of withstanding these unfavourable conditions, at the expense of other less tolerant species. The range and type of crops represented at sites therefore provide an indication of the conditions in which they were cultivated and also the relative yields.
Barley (Hordeum vulgare), oats (Avena sativa), and spelt wheat (Triticum spelta) are better suited to poor growing conditions than many other cereal species. Barley can be grown successfully from the tropics to the Arctic Circle, in areas that experience droughts and also those with frequent frosts (Leonard and Martin, Reference Leonard and Martin1963). Its broad ecological scope and tolerance of poor soils makes barley one of the most adaptable crops (Newton et al., Reference Newton, Flavell, George, Leat, Mullholland, Ramsay and Revoredo-Giha2011; Kirleis et al., Reference Kirleis, Klooß, Kroll and Müller2012; Bogaard et al., Reference Bogaard, Fraser, Heaton, Wallace, Vaiglova, Charles and Jones2013; Styring et al., Reference Styring, Maier, Stephan, Schlichtherle and Bogaard2016). Oats are also productive in more extreme environments subject to cold-wet climates and on soils of low fertility (Leonard and Martin, Reference Leonard and Martin1963; Gill and Vear, Reference Gill, Vear, Vear and Barnard1980; Buerstmayr et al., Reference Buerstmayr, Krenn, Stephan, Grausgruber and Zechner2007). Spelt wheat encompasses all the same qualities shown in oats and barley and is well-suited to poor growing conditions in areas that are usually considered marginal for cultivation (Bonafaccia et al., Reference Bonafaccia, Galli, Francisci, Mair, Skrabanja and Kreft2000). The robust glumes that surround the grains in spikelets of emmer (Triticum diccoccum), einkorn (Triticum monococcum), and spelt wheat serve as protection when crops are susceptible to fungal attack, and particularly in regions with high seasonal rainfall (Hillman, Reference Hillman and Mercer1981, Reference Hillman, van Zeist and Casparie1984; Riesen et al., Reference Riesen, Winzeler, Rüegger and Fried1986; Nesbitt and Samuel, Reference Nesbitt, Samuel, Padulosi, Hammer and Heller1996). Einkorn has the added advantage in comparison with many of the other cereal crops in that it does not “lodge” (i.e., the plants remain upright) after heavy rain (fig. 15.11 in Kreuz, Reference Kreuz, Colledge and Conolly2007; Zaharieva and Monneveux, Reference Zaharieva and Monneveux2014; Bogaard et al., Reference Bogaard, Hodgson, Nitsch, Jones, Styring, Diffey and Pouncett2016). Free-threshing wheats are more exacting in terms of their growth requirements: hexaploid bread wheat (Triticum aestivum) is able to endure colder conditions with frosts than tetraploid durum/macaroni wheat (Triticum durum), which thrives in warmer climates but is more demanding in terms of edaphic quality and prefers soils with high nutrient levels (Percival, Reference Percival1974; Zohary et al., Reference Zohary, Hopf and Weiss2012; Kirleis and Fischer, Reference Kirleis and Fischer2014). In comparison with wheat (in particular bread wheat), barley and oats produce much lower yields but their greater tolerance range affords them obvious advantages in regions with unfavourable growing conditionsFootnote 1 (Campbell, Reference Campbell2007; Shewry, Reference Shewry2009; DEFRA, 2014).
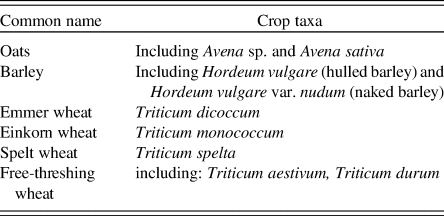
We tested for changes in cereal crop use over time by counting numbers of phases exhibiting each of the six crop types in five 250-yr date bins from 5950 to 4700 cal yr BPFootnote 2 (see Table 1 for the list of crop types in the data set). We evaluated the differences between phases with Manhattan distance matrices using the difference between the proportions of the six crops in each date binFootnote 3. Manhattan distances have few assumptions, work with count data, and may be less sensitive to larger outliers (McCune and Grace, Reference McCune and Grace2002). The Manhattan distance coefficient is scaled from 0 to 1, with higher numbers indicating greater dissimilarity. The statistical significance of the observed coefficients was established by a permutation test with 1000 simulations from which we calculated Manhattan distance for each of 1000 randomisations. The difference between the observed distances for each of the paired date bins was converted to a standardised (z) which provides a measure of statistical significance. Finally, to isolate which crops were contributing to observed differences, we calculated ubiquity (percentage presence) scores by date bin for each crop to identify trends in use over time and also examined the difference between observed and expected crops in each of the five date bins.
List of crop types included in the analyses.

Weed ecology
By studying the ecology of weeds, it is possible to obtain information about the conditions of fields in which they grow, such as overall soil quality, and also about the cultivation practices of the crops with which they co-habit, for example tillage, weeding, and manuring. To assess likely field conditions and how they changed over time we draw on insights from phytosociology and autoecology. Phytosociology is a hierarchical system for assessing floristic composition and is reliant on the recognition, distinction, and classification of “community units” (Poore, Reference Poore1955). Autoecology is the study of the behaviour of individual plant species and is based on sets of measured variables that indicate the tolerance range for certain environmental conditions; examples include Ellenberg's indicator values (Ellenberg, Reference Ellenberg and Strutt1988, Reference Ellenberg1991) and the functional interpretation of botanical surveys (FIBS, 2015). Both phytosociological and autoecological approaches have been applied in analyses of archaeobotanical assemblages (van Zeist and Palfenier-Vegter, Reference van Zeist and Palfenier-Vegter1981; Wasylikowa, Reference Wasylikowa1981; Jacomet, Reference Jacomet and Suter1987; Jones, Reference Jones1988; Hillman, Reference Hillman, Harris and Thomas1989; Küster, Reference Küster, Harris and Thomas1989; Behre, Reference Behre, van Zeist, Wasylikowa and Behre1991; Jones, Reference Jones, Pals, Buurman and van der Veen1992, Reference Jones2002; van der Veen, Reference van der Veen1992; Karg, Reference Karg2008; McClatchie et al., Reference McClatchie, Bogaard, Colledge, Whitehouse, Schulting, Barratt and McLaughlin2014). There are, however, methodological problems that to some extent undermine the use of either in the identification of ancient landscapes (van der Veen, Reference van der Veen1992). A major limitation of phytosociology is the fact that it cannot be assumed vegetation dynamics have remained constant and therefore that present-day communities are necessarily an accurate representation of those in the past (Hillman, Reference Hillman, Harris and Thomas1989; Cappers, Reference Cappers1995; Jones, Reference Jones2002). In addition, taphonomic filtering (e.g., resulting from post-harvest cleaning processes or differential preservation) further diminishes the validity of phytosociology when applied to the study of ancient plant communities. Amalgamation of data, rather the reliance on single, diagnostic species circumvents the problem of incomplete archaeobotanical records. As noted by Jones (Reference Jones2002, p. 187): “‘indicator’ species are relatively rare and so, in an already restricted archaeobotanical data set it seems sensible to use information derived from all available species.”
As has been common practice in archaeobotanical studies (van der Veen, Reference van der Veen1992), we adopted both phytosociological and autoecological approaches to obtain comparative data on the ecology of wild species (i.e., those represented at sites/site phases with crop-rich samples). We referred to Ellenberg's records for ~3000 species that were compiled on the basis of field surveys and laboratory experiments carried out in central Europe (Ellenberg, Reference Ellenberg and Strutt1988). His hierarchical classification system comprises eight main vegetation units (or communities) that include (in order of increasing cover): vegetation of wetlands, frequently disturbed places, heaths and grasslands, and woodlands. Of the eight main vegetation units described in Ellenberg's classification system, units 3 and 5 (hereafter U3 and U5) are the most informative about plant communities characteristic of landscapes that are shaped largely under anthropogenic influence; for example, U3 is described as “herbaceous vegetation of frequently disturbed sites” and comprises segetal and ruderal weed communities (including Chenopodietea and Secalietea; Ellenberg, Reference Ellenberg and Strutt1988, pp. 667–669), and U5 is described as “heaths and grasslands determined by human and animal activity” and includes pasture and meadow communities (Ellenberg, Reference Ellenberg and Strutt1988, pp. 670–672). The individual species data for environmental variables (indicator values) relate to climate and soils, and of these nitrogen and reaction/pH values (classified on scales of one to nine) provide the most useful means of evaluating the relative quality of the soils on which Neolithic crops were grown (Ellenberg, Reference Ellenberg and Strutt1988). Although Ellenberg's data were based on the central European flora they have been used successfully in other regions of Europe in both modern (e.g., see list of references in Schaffers and Sýkora, Reference Schaffers and Sýkora2000) and ancient ecological studies (e.g., in NW Europe: Kirleis, Reference Kirleis2002; Karg, Reference Karg2008; McClatchie et al., Reference McClatchie, Bogaard, Colledge, Whitehouse, Schulting, Barratt and McLaughlin2014; Schepers, Reference Schepers2014).
Data on the life cycles of wild species are also included in our study and are used as a basis for making inferences about the relative intensity of cultivation and the degree of permanence of cultivated fields. Modern survey data of weeds growing in cultivated plots created in recently cleared woodland, and thus replicating shifting cultivation, have been shown to reflect both the ecology of the original wooded area and the intensity of tillage methods used after clearance (e.g., the Hambach Forest experiment; Bogaard, Reference Bogaard2002). Perennial weeds, and most notably those species common to woodlands, were recorded as being dominant in all plots and those known to grow in more disturbed habitats were prevalent where there had been more invasive tillage; annual species were in a minority in all the experimental plots. The greater proportions of annual species in crop-rich assemblages are thought likely to be an indication of intensive cultivation (Bogaard, Reference Bogaard2002, Reference Bogaard2004, Reference Bogaard2005; Bogaard and Jones, Reference Bogaard, Jones, Whittle and Cummings2007). Comparison of these modern data, specifically the proportions of annuals and perennials, with the life cycles of arable weeds found in archaeobotanical assemblages can, therefore, be used to distinguish between extensive and shifting versus intensive and permanent systems of cultivation.
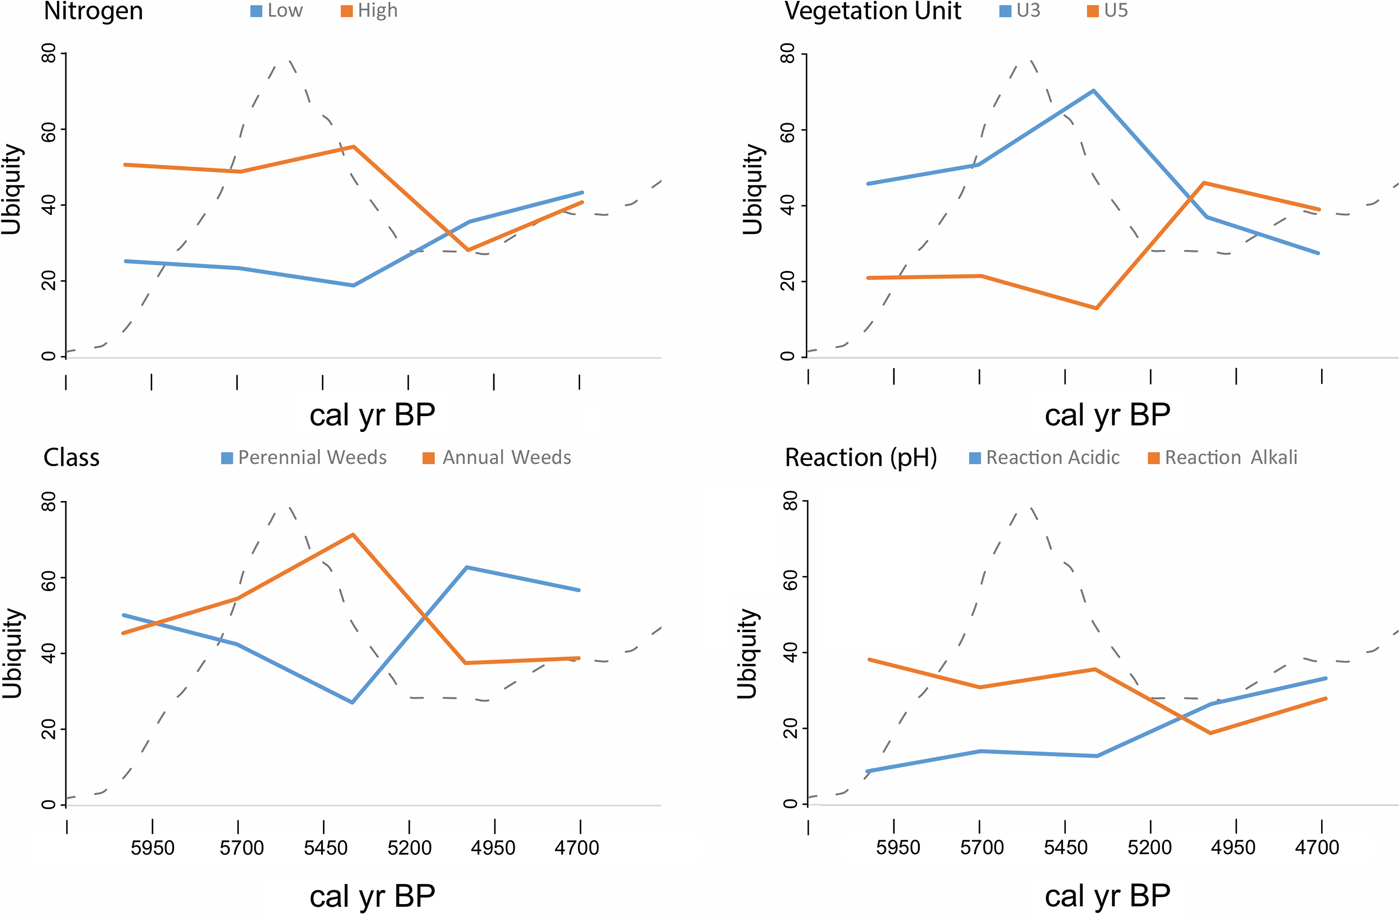
The analyses included all wild taxa represented in the data set that are identified at the species level (with the exclusion of trees and shrubs); ecological data were assigned to a total of 128 species in 67 phases (from 61 sites; NB: not all archaeobotanical site and phase records include wild taxa identified to species). As in previous studies, we have assumed that the wild species in our data set, which occur in archaeological samples together with crops, are weeds (or “potential weeds”) of cultivation that were collected and brought to sites as contaminants of harvests (van der Veen, Reference van der Veen1992; McClatchie et al., Reference McClatchie, Bogaard, Colledge, Whitehouse, Schulting, Barratt and McLaughlin2014). For this analysis we counted numbers of species records (n = 334) from phases between 5950 and 4700 cal yr BP in the five 250-year bins corresponding to each of Ellenberg's (1) vegetation units U3 and U5; (2) reaction indicator values in two classes: low (1 to 5, acidic) and high (6 to 9, alkali); (3) nitrogen level indicators in two classes: low (1 to 5) and high (6 to 9)Footnote 4; and (4) the counts of phases with perennial and annual weeds. The prediction is that declines in productivity on preferred soils (whether from climate stress or reduced fertility, or a combination of both) will be detectable by temporal trends in vegetation units (i.e., a shift towards an increase in use of pasture lands), reaction and nitrogen values (i.e., an increase in species more tolerant of acidic/nitrogen-poor soils), and by an increase in representation of perennial over annual weed species, which may also have resulted in the movement on to other poor quality soils.
As with crops, we first compared weeds between the 250-year date bins from 5950 to 4700 cal yr BP using Manhattan distance matrices. We used the proportions of the four variables (vegetation units U3 and U5, perennial and annual weeds, and nitrogen and reaction indicator values) across the five date bins. For each date bin the expected mean and variance of observed coefficients were established by a permutation test with 1000 simulations. We used a z-test to establish the significance of the simulated data against the actual difference between chronological bins for each of the four classes. To establish temporal trends, we plotted the ubiquity values corresponding to these ecological data by 250-year date bin.
Soils
Good quality soils are defined as those that have sufficient rooting depth (shallow soils lack sufficient moisture and have reduced nutrient levels), good drainage (e.g., a texture that is neither too compact such that water permeability is restricted, nor too loose so drainage is excessive), and are not highly acidic (nitrogen-fixing bacteria are reduced in acid conditions, as are the soil organisms that enhance soil structure and texture) or alkaline (alkali/clay-rich soils have poor structure and limited water absorption capacity; Grigg, Reference Grigg1989; Reeves, Reference Reeves1997; Manna et al., Reference Manna, Swarup, Wanjari, Mishra and Shahi2007). As part of a complex cyclical process, nutrients are released into the soil through the decay and decomposition of the biomass (e.g., organic materials derived from living or recently living plants and animals; for details of soil nutrient cycling see Nye and Greenland [Reference Nye and Greenland1965] and Killham [Reference Killham1994]). Any disruption of this closed cycle influences the effectiveness with which the nutrients can be circulated between the biomass and the soil (Grigg, Reference Grigg1989); for example, disequilibrium can result from a lack of adequate compensation for nutrient losses (Nye and Greenland, Reference Nye and Greenland1965).
The edaphic optimum refers to soil conditions in which a wide variety of crops can be grown and high yields produced without the necessity for any additives in the form of inorganic fertilisers or manures (Grigg, Reference Grigg1989; Kleinman et al., Reference Kleinman, Pimentel and Bryant1995). If the specific properties that define this optimum are not met, for example, if soils are highly acidic, are waterlogged, or have low nutrient status, fewer crops can be grown and yields are diminished. Crops have different growth requirements and tolerances, but most are suited best to deep, well-drained, pH neutral (or slightly acidic) soils with a good supply of nutrients (Grigg, Reference Grigg1989).
The physical and chemical status of soils is altered as a result of intensive farming. Tillage can lead to erosion of topsoil in which the bulk of the soil organic matter is stored, consequently soil stability, compactability, and water holding capacity are adversely affected and nutrient availability is reduced (Kleinman et al., Reference Kleinman, Pimentel and Bryant1995; Shiel, Reference Shiel and Jones2013; for full descriptions of the effect of tillage on soil quality, see Cannell and Hawes [Reference Cannell and Hawes1994]). The more invasive the tillage method the greater the negative influence on soil quality; whereas hoeing, raking, digging by hand, or scratch ploughing leave crop residues on the soil surface that prevent excessive erosion (Cannell and Hawes, Reference Cannell and Hawes1994; Doran, Reference Doran2002). Extended periods of continuous cropping also lead to a decline over time in soil organic matter (Reeves, Reference Reeves1997; Doran, Reference Doran2002).
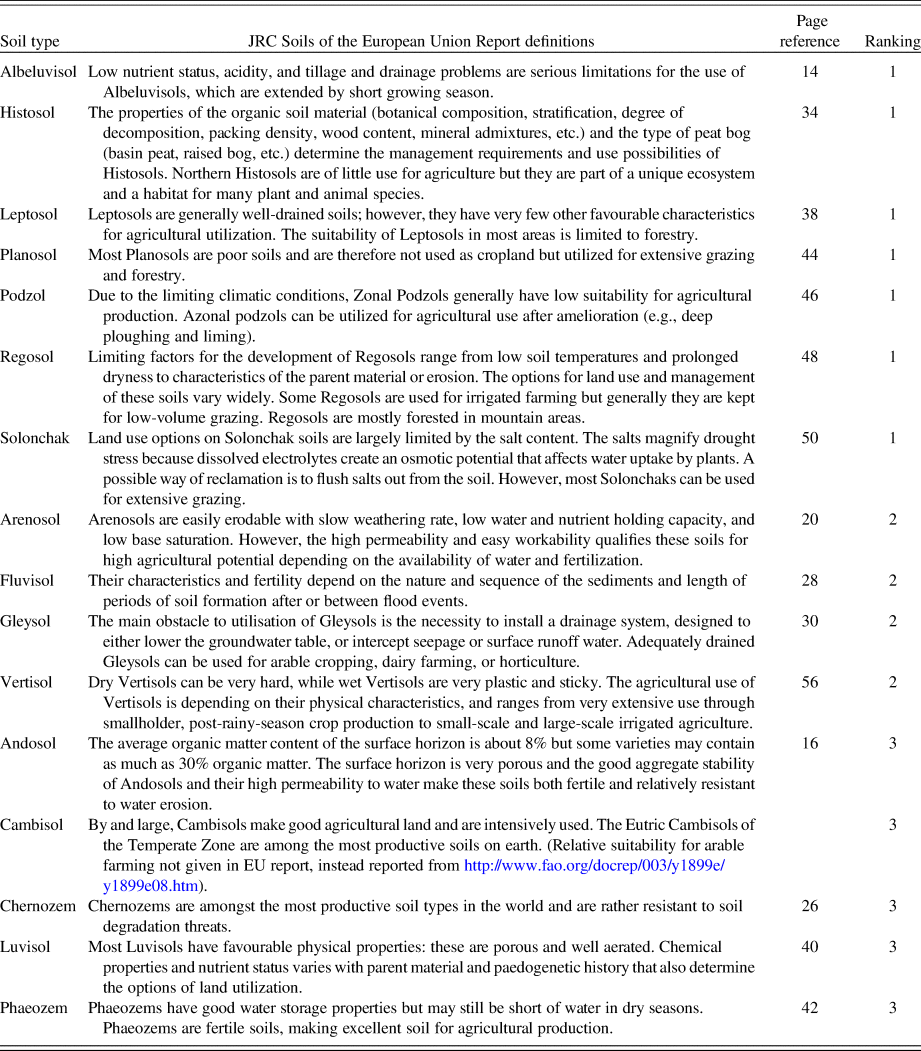
To obtain direct information on soils we referred to the European Soil Portal—Soil Data and Information Systems website (http://eusoils.jrc.ec.europa.eu/). A total of 278 NW European settlement sites (i.e., all non-habitation burial and ritual sites were excluded) recorded in the EUROEVOL database with a probability (P > .05; inferred from the summed probability of 14C dates) of occupation sometime within the range 5950 to 4700 cal yr BP were plotted on the European soil map and were classified according to the soils on which they are located. A total of 16 major soil groups were included in the analysis (for the full list, see Table 4). We ranked the soils in terms of their suitability for arable farming with reference to the descriptions given in the JRC Scientific and Technical Report available via the European Soil Portal website (Tóth et al., Reference Tóth, Montanarella, Stolbovoy, Máté, Bódis, Jones, Panagos and van Liedekerke2008), in which the soils of the European Union are classified according to a new standard as defined in the World Reference Base for Soil Resources (FAO, 1998). Our rankings (Class 3: good; Class 2: moderate; Class 1: poor; see Table 4 for ranking criteria) are based on overall soil quality and other factors that either promote or hamper farming practices; soils we considered suitable for arable farming are those described as having high organic matter content and good texture, in contrast to those less appropriate for crop cultivation that are recorded as having poor fertility and drainage and are difficult to work.
We tested for changes in site location in relation to soil quality rank. First, we computed the SPD for each site, normalised the distribution so that the total was equal to one, and then calculated the probabilities for each of the five 250-year chronological bins. For each site, we retrieved the proportion of different soil types (aggregated by the three classes) within a 5-km radius and multiplied these with the relative date probability obtained from the SPD. The aggregated value expresses the sum use of each soil class by sites for each of the five temporal bin ranges. Second, to evaluate whether there was a significant change over time in the observed distribution, we used a permutation test (1000 simulations) by randomly re-assigning the original SPDs to different site locations. We used a z-test to establish the significance of the observed soil class in each temporal bin against the simulated distribution
RESULTS
Changes in crop composition
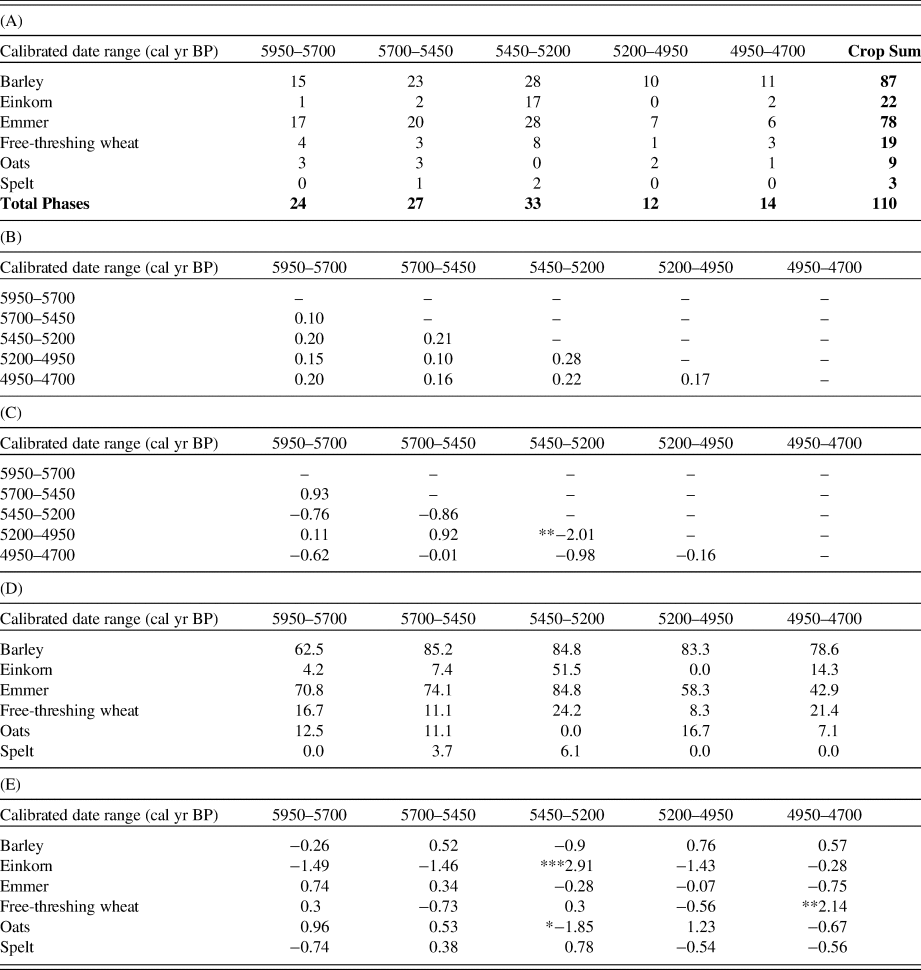
In the data set we examined, barley, emmer, and einkorn are the most common species, whereas by comparison free-threshing wheat, oats (probably weeds of crop fields in the Neolithic rather than crops per se; McClatchie et al., Reference McClatchie, Bogaard, Colledge, Whitehouse, Schulting, Barratt and McLaughlin2014), and spelt wheat occur less frequently (Table 2A). The results demonstrate that the two periods with the greatest distance from one another are 5450–5200 cal yr BP and 5200–4950 cal yr BP, with a z-score of −2.01 (two-tailed P < .05; Tables 2B and 2C). The 500 years between 5450 and 4950 cal yr BP are thus shown to experience significant changes in the types of crops cultivated in the study region. Moreover, the close similarity between the two earlier phases 5950–5700 cal yr BP and 5700–5450 cal yr BP and the later phase 5200–4950 cal yr BP further emphasizes the significant change in crop composition in the period 5450–5200 cal yr BP.
(A) Counts of phases with presence of six crop taxa from 5950 to 4700 cal yr BP for NW Europe. (B) Manhattan distance between date bins. (C) Z-score of observed distances (**P < 0.05). (D) Crop ubiquity (counts of presence as a percentage of total phases in each date bin). (E) Standardised residuals (observed versus expected crop frequencies (*P < 0.1, **P < 0.05, ***P < 0.01).

Barley remains more-or-less consistent in ubiquity, although it increases from 5950 to 5700 cal yr BP before declining slightly between 5450 and 4950 cal yr BP (Table 2D and Fig. 3). Emmer increases between 5950 and 5450 cal yr BP and thereafter decreases in frequency. Einkorn (a crop more commonly found in mainland Europe than in Britain and Ireland; McClatchie et al., Reference McClatchie, Bogaard, Colledge, Whitehouse, Schulting, Barratt and McLaughlin2014) increases dramatically from 4% to 52% between 5950 and 5450 cal yr BP, then rapidly declines. Free-threshing wheat declines between 5950 and 5700 cal yr BP and then fluctuates until increasing significantly after 5200 cal yr BP. Oats and spelt are difficult to interpret because of low sample numbers, but the former is underrepresented in assemblages between 5450 and 5200 cal yr BP whereas spelt is found in greater than expected frequencies between 5700 and 5200 cal yr BP (Table 2E).

Changes in weed ecologies
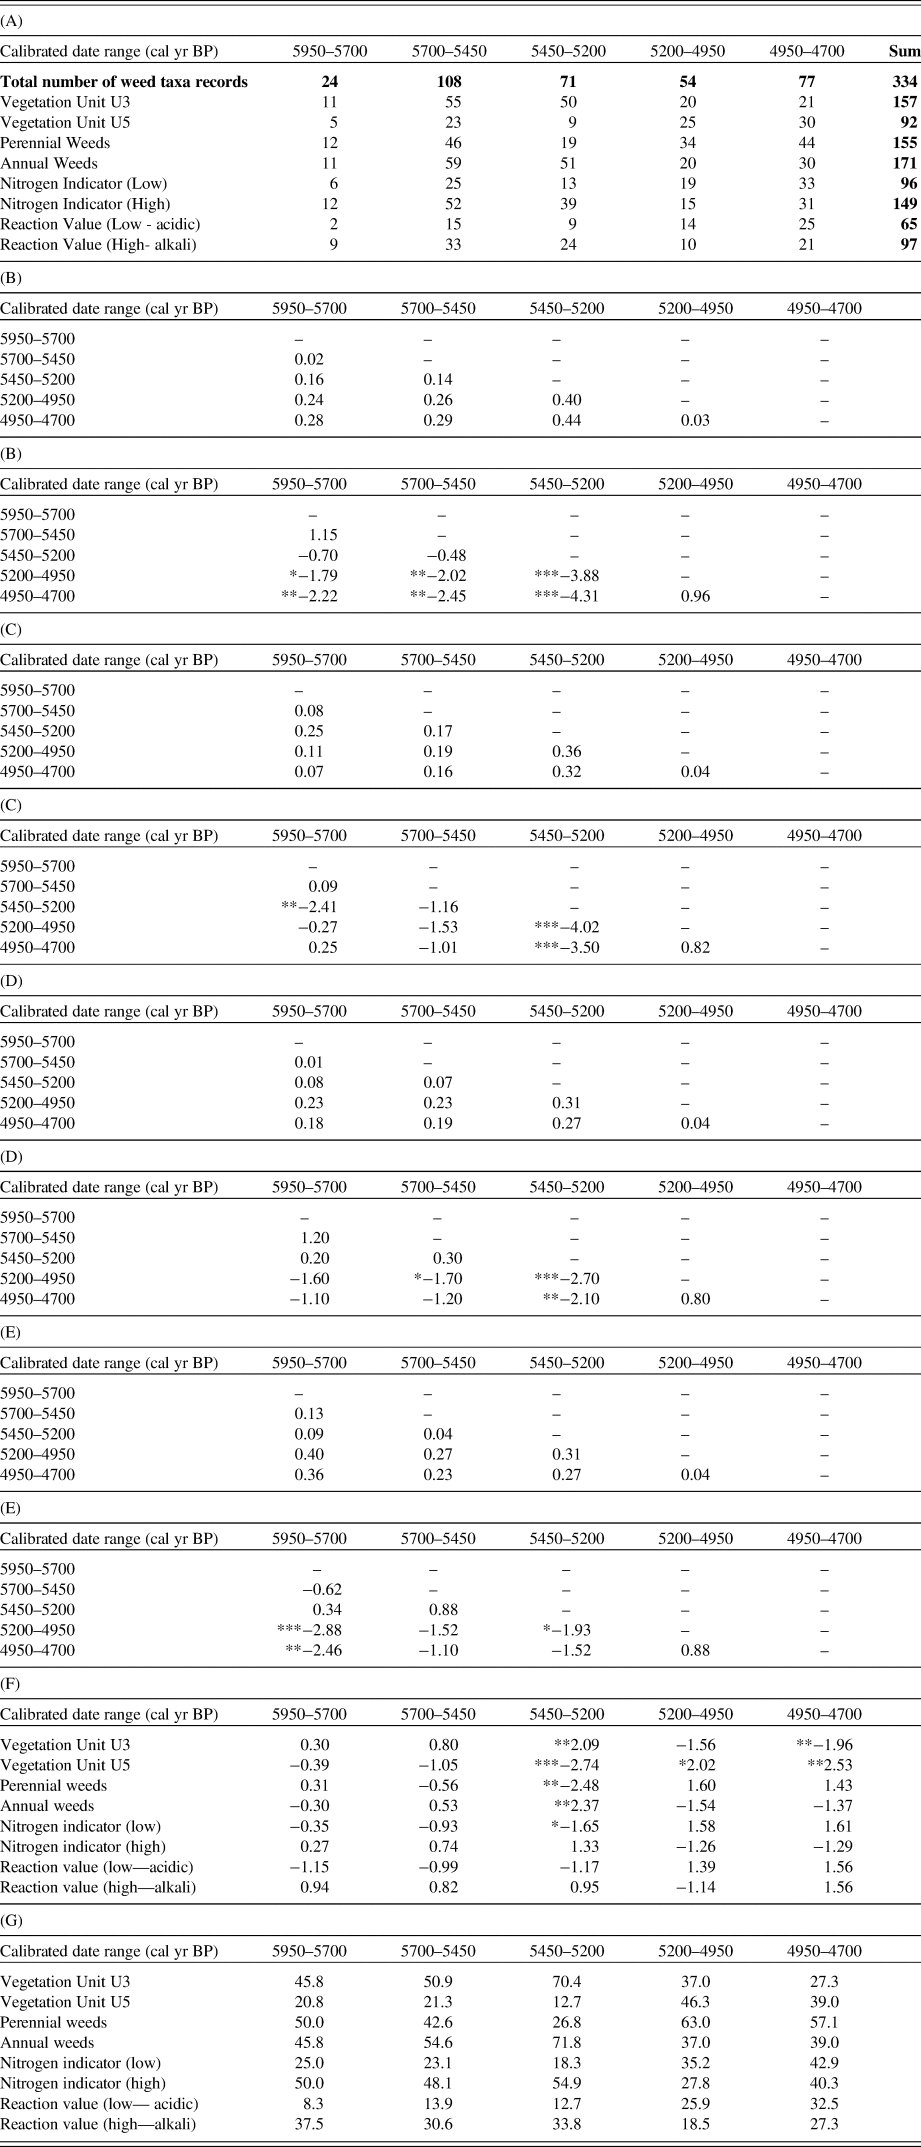
The results of the analysis of weed ecologies (Tables 3A–E) are consistent with the crop data and highlight the significant differences in ecological variables between 5450–5200 cal yr BP and 5200–4950 cal BC. The measured differences are all significant at P < .05 (two-tailed), with the exception of the reaction indicator value, which is significant at P < .1 (two-tailed). The results show that there are significant non-random changes over time in the representation of vegetation units U3 and U5, perennial and annual weeds, and nitrogen and reaction indicator values (Table 3F). Comparisons of ubiquity values show that proportions of U3 taxa spike at 5450 cal yr BP and thereafter are replaced by U5 taxa (Fig. 4, Table 3G). The analysis of nitrogen indicator values shows an identical pattern, with low nitrogen values increasing after 5450 cal yr BP and dominating by 5200 cal yr BP. Similarly, the incidence of annual species is at a maximum at 5450 cal yr BP and thereafter they are replaced by perennial species. Changes in reaction indicator values are less pronounced but there is a statistically significant trend towards increasing acidity after 5200 cal yr BP.
(A) Number of weed taxa records in each chronological bin from 5950 cal yr BP to 4700 cal yr BP, corresponding to vegetation units, perennial and annual weeds, nitrogen, and reaction indicator values. (B–E) Manhattan distance matrices and z-values for vegetation units, annual and perennial weeds, nitrogen, and reaction indicator values. (F) Standardised residuals. Negative results indicate instances where there are fewer observed taxa in that class than predicted; positive more observed taxa in that class than predicted (*P < 0.1, ** P < 0.05, *** P < 0.01). (G) Ubiquity calculated as a per cent of total weed records.

(color online) Trends over time in vegetation units, nitrogen, and reaction indicator values and perennial and annual weeds as represented by ubiquity scores of weed species according to date bin as provided in Table 3G (dashed line shows population density overlay for y-axis only, see Fig. 1 for values).

Changes in site location according to soil class
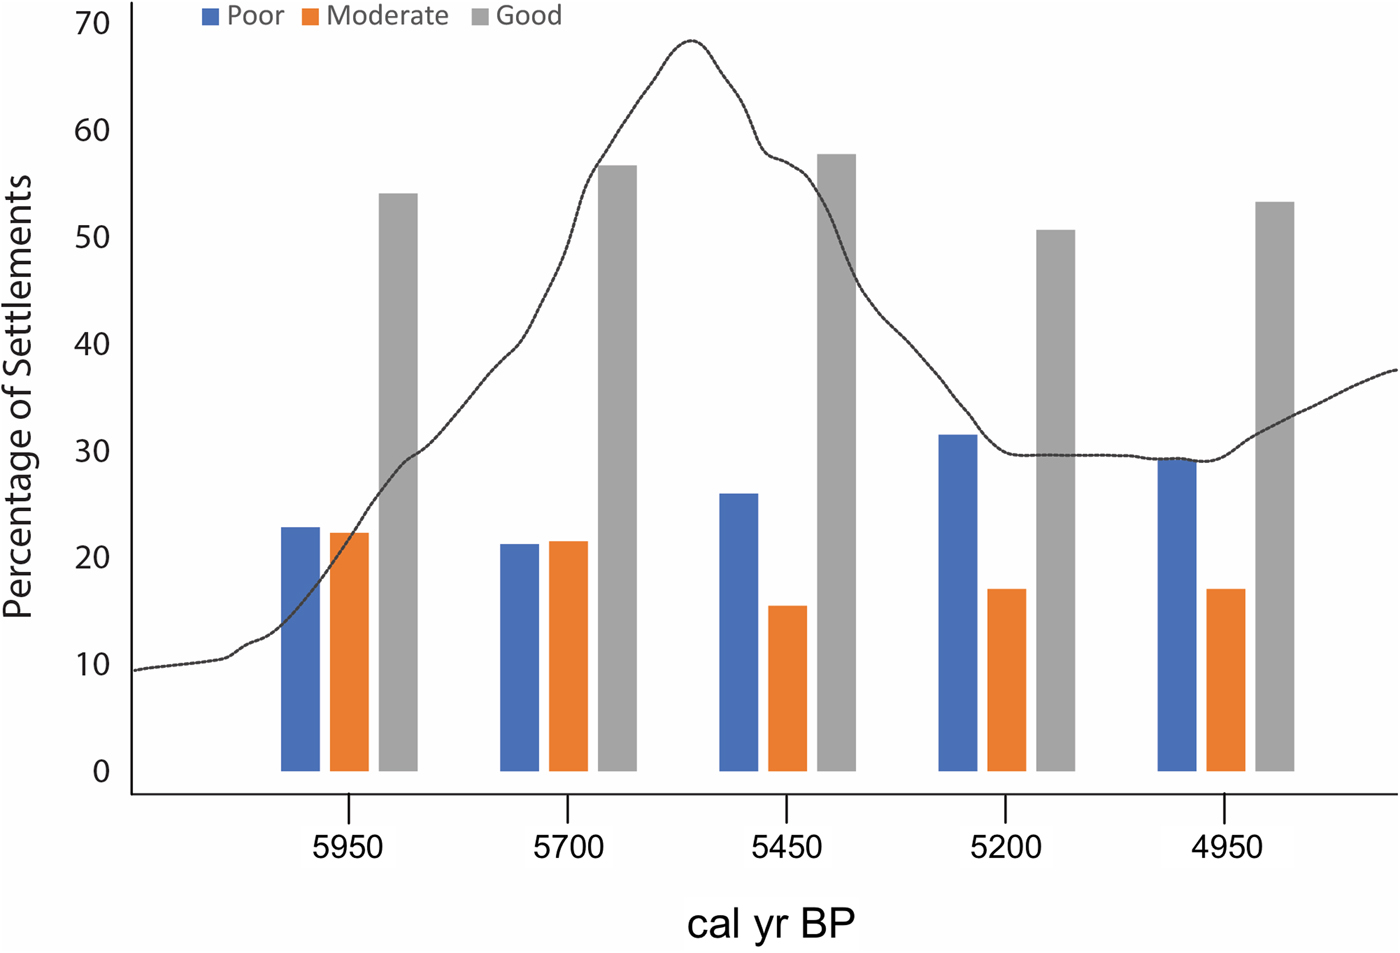
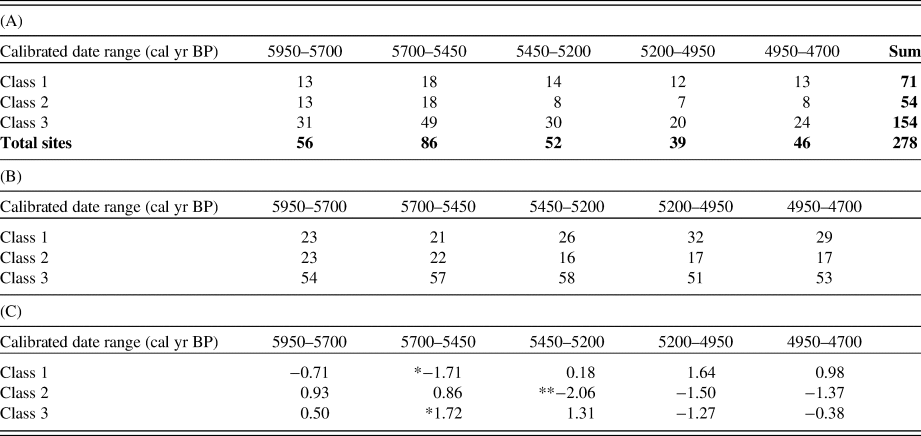
The results demonstrate that the temporal distribution of settlement locations according to soil classes is significantly different from the random model (P < .001; Fig. 5, Tables 5A–C). When each soil class and temporal bin range is examined for significance, it shows that sites on poor (Class 1) soils increase in representation from 5450 to 4950 cal yr BP. Conversely, those located on moderate (Class 2) and good soils (Class 3) are underrepresented from 5450 cal yr BP onwards.

Soil types included in the analyses. Definitions are taken from the Joint Research Centre (JRC) Scientific and Technical Report available via the European Soil Portal website (Tóth et al., Reference Tóth, Montanarella, Stolbovoy, Máté, Bódis, Jones, Panagos and van Liedekerke2008). Rankings for suitability as arable soils are made on the basis of the JRC definitions: 1, poor; 2, moderate; 3, good.

(A) Frequency of settlements (n = 278) across ranked soil classes (Class 3, good; Class 2, moderate; Class 1, poor) from 5950–4700 cal yr BP according to date bins. (B) Same data, expressed as percentages of settlements per date bins. (C) Z-scores of each date bin, calculated by permutation of soil classes (*P < 0.1; **P < 0.05). Negative results indicate instances where there are fewer observed taxa in that class than predicted; positive indicate more observed taxa in that class than predicted.

Note of caution: the limitations of using modern soils for interpreting past conditions
Any purported correlation between Neolithic site locations and present-day soil classifications that show changes in the status of cultivated land over time (as represented by archaeological assemblages of crops and wild species) requires some justification. Soils are dynamic systems and are continually evolving; their structure and composition is a function of a range of variables including climate, geology, topography, biota, anthropogenic activities (e.g., major land reclamation by drainage during the Medieval period; Honnor and Lane, Reference Honnor and Lane2002; Curtis and Campopiano, Reference Curtis and Campopiano2014), and time (Veldkamp, Reference Veldkamp2005). Modern soil properties are therefore relicts of those that were present in the past. For example, evidence suggests that the imprints of prehistoric land use are manifest in existing soils because of changes in formation processes that lead to distinctive modifications in soil properties (Macphail et al., Reference Macphail, Courty and Gebhardt1990; Davidson and Carter, Reference Davidson and Carter1998, Reference Davidson, Carter, Edwards and Ralston2003; Kristiansen, Reference Kristiansen2001; Guttmann, Reference Guttmann2005; Gerlach et al., Reference Gerlach, Fischer, Eckmeier and Hilgers2012; Gerlach and Eckmeier, Reference Gerlach and Eckmeier2012; for examples of the effects on soils of prehistoric land use in NW Europe see, Madsen [Reference Madsen1984] and Odgaard [Reference Odgaard1992, Reference Odgaard1994]). Macphail et al. (Reference Macphail, Courty and Gebhardt1990, p. 65, citing Courty et al., Reference Courty, Goldberg and Macphail1989) stress that post depositional reworking of ancient cultivated soils (e.g., by earthworm activity, trampling, or mixing) can obscure “the agricultural history from the soil.” There are obvious limitations in using modern-day soil descriptions to characterise Neolithic productivity without critical evaluation of the evolutionary edaphic processes for each case study (Davidson and Carter, Reference Davidson and Carter1998), which is beyond the scope of our present research.
DISCUSSION
Cereal cultivation in the Neolithic of NW Europe
Barley, emmer, and einkorn are all noted for being able to withstand adverse conditions (see earlier discussions on growth limitations for different cereal species) and their dominance in the data set is likely indicative that many areas covered in our study (e.g., the northernmost sites) were already marginal for arable farming. There are, however, proportional variations in the six crops we tracked that can be matched against Neolithic demographic change, and the most significant of which is a rapid uptake of einkorn from 5700 to 5450 cal yr BP (e.g., during the period increasing and peak population), suggesting this is when diversification of wheat was required. Moreover, the persistently high ubiquity of barley from 5450 cal yr BP (e.g., during the period of population decline) concurrent with the overall decrease in values for wheat species is consistent with the depreciation in growing conditions (cf. fig. 4 in Bevan et al., Reference Bevan, Colledge, Fuller, Fyfe, Shennan and Stevens2017). Our assessment of weed ecologies further highlights the close temporal correlation between a regional population crash in NW Europe and corresponding changes in the growing conditions in crop fields after 5450 cal yr BP as shown by the significant increase in U5 taxa (pasture and meadow), perennial weeds, and in species tolerant of nitrogen-poor, more-acidic soils and we interpret this as representing either in situ soil degradation or the shift to less fertile arable land, both of which are likely to have been correlated with a loss of crop yields. While acknowledging the inherent limitations of the analysis of site location according to soil quality, it is noteworthy that, at the coarse scale at which this information is being used, the chronological trends in the data are complementary to those for crops and weeds.
In sum, our combined results for analyses of crops, weed ecologies, and soils are in accordance and, most significantly, major changes are coincidental with the inferred NW European Neolithic “boom-and-bust” patterns in population growth and decline. We have shown that after an earlier period (e.g., from 5950–5450 cal yr BP) of relative stability (e.g., with evidence of comparatively higher yielding crops grown on more fertile arable land) when population levels are increasing, there is an apparent decrease in productivity as growing conditions worsened concurrent with a reduction in population (e.g., between 5450 and 4700 cal yr BP). These results therefore support our hypothesis of declining productivity of preferred soils.
Regional comparisons
Neolithic farming in Britain and Ireland and Southern (S) Scandinavia and Northern (N) Germany during the population “boom”
The trends we identify in our data are broadly consistent with those reported by others in the different regions of NW Europe, most notably in S Scandinavia and N Germany and in Britain and Ireland. Arable farming at the beginning of the Funnel Beaker culture (5950–4750 cal yr BP; Fig. 6) in S Scandinavia and N Germany is small-scale and, as indicated in pollen diagrams, there was minimal influence on the environment. It is debated whether or not cultivation was based on slash-and-burn (shifting) or intensive methods, those that support the former cite evidence from pollen diagrams of concentrations of charcoal coincidental with anthropogenic indicators of clearance (Andersen, Reference Andersen1992; Robinson, Reference Robinson, Colledge and Conolly2007; Hinz et al., Reference Hinz, Feeser, Sjögren and Müller2012; Sørensen, Reference Sørensen2014), others who question the stratigraphic integrity of these contexts consider shifting cultivation is unlikely (Rowley-Conwy, Reference Rowley-Conwy2004). Crop spectra at early Funnel Beaker culture sites show parallels with the combined study results for the equivalent period: emmer and naked barley are the most common crops grown, other less frequently occurring crops include einkorn, free-threshing wheat, spelt wheat, and hulled barley (Robinson, Reference Robinson2003, Reference Robinson, Colledge and Conolly2007; Kirleis et al., Reference Kirleis, Klooß, Kroll and Müller2012; fig. 7 in Sørensen and Karg, Reference Sørensen and Karg2012). Free-threshing tetraploid wheat is recorded as being an important crop at several sites and its successful cultivation is thought to have been possible on the nutrient-rich soils resulting from clearance by fire of small woodland plots (Kirleis and Fischer, Reference Kirleis and Fischer2014).
Comparative chronologies for northwest European Neolithic periods and cultures between 6000 and 4000 cal yr BP (Raemakers and Paulien de Roever, Reference Raemakers, Paulien de Roever, Vanmontfort, Louwe Kooijmans, Amkreutz and Verhart2010; Manning et al., Reference Manning, Timpson, Colledge, Crema, Edinborough, Kerig and Shennan2014; Whitehouse et al., Reference Whitehouse, Schulting, McClatchie, Barratt, McLaughlin, Bogaard, Colledge, Marchant, Gaffrey and Bunting2014).

There is archaeobotanical evidence to suggest that, at the advent of farming in Britain and Ireland (date ranges: British early Neolithic, 5950–5350 cal yr BP; Irish early Neolithic, 5950–5550 cal yr BP; Fig. 6), cultivation was intensive and small-scale (Bogaard and Jones, Reference Bogaard, Jones, Whittle and Cummings2007; Bishop et al., Reference Bishop, Church and Rowley-Conwy2009; Barclay, Reference Barclay1983; McClatchie et al., Reference McClatchie, Bogaard, Colledge, Whitehouse, Schulting, Barratt and McLaughlin2014; Whitehouse et al., Reference Whitehouse, Schulting, McClatchie, Barratt, McLaughlin, Bogaard, Colledge, Marchant, Gaffrey and Bunting2014). The diversity of the crop package is similar across all regions of Britain and Ireland, with emmer wheat and barley (hulled and naked varieties) as the major constituents, which is also in accord with our combined results for NW Europe. There are, however, slight regional differences in terms of which crops are cultivated preferentially. Emmer is the most common crop at Irish early Neolithic sites (i.e., dated to the Early Neolithic (EN) II period) with fewer records for naked and hulled barley, einkorn, free-threshing wheat, and flax (McClatchie et al., Reference McClatchie, Bogaard, Colledge, Whitehouse, Schulting, Barratt and McLaughlin2014, Reference McClatchie, Bogaard, Colledge, Whitehouse, Schulting, Barratt and McLaughlin2016; Whitehouse et al., Reference Whitehouse, Schulting, McClatchie, Barratt, McLaughlin, Bogaard, Colledge, Marchant, Gaffrey and Bunting2014). The southern British crop spectrum is comparable to the Irish in terms both of the variety and the frequency of occurrence of the different species (Table 23.1 in Jones and Rowley-Conwy, Reference Jones, Rowley-Conwy, Colledge and Conolly2007). Conversely, in Scotland naked barley appears to have been cultivated preferentially over emmer at more sites although there is variation within the country in the relative proportions of the different crop types (Bishop et al., Reference Bishop, Church and Rowley-Conwy2009).
Neolithic farming in Britain and Ireland and S Scandinavia and N Germany during the population “bust”
In S Scandinavia and NW Germany from ~5650–5550 cal yr BP, when population levels are high, land use practices changed and systems of extensive cultivation (e.g., expansive ard cultivation) were adopted in response to the need for enhanced production potential (Hinz et al., Reference Hinz, Feeser, Sjögren and Müller2012; Kirleis et al., Reference Kirleis, Klooß, Kroll and Müller2012; Sørensen and Karg, Reference Sørensen and Karg2012; Kirleis and Fischer, Reference Kirleis and Fischer2014). Ard marks have been found at Højensvej, høj 7 on the island of Funen (/Fyn) dated to 5720–5587 cal yr BP, and at the site of Flintbek 3 in Schleswig where the earliest evidence is only slightly later, with dates in the range ~5550–5050 cal yr BP (Mischka, Reference Mischka2011; Sørensen, Reference Sørensen2014). Barley and emmer are the most frequently occurring crops at sites of this period (Kirleis and Fischer, Reference Kirleis and Fischer2014, figure 7). Reduced fertility in soils under extensive cultivation due to insufficient manuring is thought to have limited the range of crops grown (Kirleis and Fischer, Reference Kirleis and Fischer2014). Our results for the post “boom” period for Neolithic NW Europe as a whole are indicative of similar trends in land use and growing conditions that we have suggested can be attributed to the declining fertility of arable fields.
When radiocarbon inferred population levels in Britain and Ireland are low (i.e., in the later Neolithic, from ~5350 cal yr BP; date range: Irish middle-late Neolithic: 5550–4450 cal yr BP; Fig. 6), there is evidence for a decline in the intensity of land use and for the regeneration of woodland (Whitehouse et al., Reference Whitehouse, Schulting, McClatchie, Barratt, McLaughlin, Bogaard, Colledge, Marchant, Gaffrey and Bunting2014; Woodbridge et al., Reference Woodbridge, Fyfe, Roberts, Downey, Edinborough and Shennan2014). The preferential cultivation in most regions of naked barley coincidental with an increase in the use of edible wild species are thought likely to have been necessary adaptations to cope with deteriorating environmental or social conditions (Bishop et al., Reference Bishop, Church and Rowley-Conwy2009; Verrill and Tipping, Reference Verrill and Tipping2010; Stevens and Fuller, Reference Stevens and Fuller2012; Whitehouse et al., Reference Whitehouse, Schulting, McClatchie, Barratt, McLaughlin, Bogaard, Colledge, Marchant, Gaffrey and Bunting2014; Woodbridge et al., Reference Woodbridge, Fyfe, Roberts, Downey, Edinborough and Shennan2014; Bishop, Reference Bishop2015; Bevan et al., Reference Bevan, Colledge, Fuller, Fyfe, Shennan and Stevens2017). Correlation at this time between greater use of barley and adverse growing conditions is also consistent with our combined results for NW Europe. Opinions vary as to the extent of the impact on arable farming as a consequence of worsening conditions and some authors suggest there is complete failure resulting in the change to a pastoralist economy supplemented by edible wild plant resources (e.g., as shown by a decline in cereals coincident with an increase in animal remains; Bevan et al., Reference Bevan, Colledge, Fuller, Fyfe, Shennan and Stevens2017), whereas others who are more equivocal cite clear evidence for the continuation of crop production, albeit at a reduced scale (e.g., in terms of cereal species diversity) in comparison with the early Neolithic (Stevens and Fuller, Reference Stevens and Fuller2012; Whitehouse and Kirleis, Reference Whitehouse and Kirleis2014; Bishop, Reference Bishop2015; Stevens and Fuller Reference Stevens and Fuller2015).
Neolithic farming in the Netherlands
Our results are, however, at odds with regional developments in the Netherlands and we suggest that the disparity in trends between the other two regions in our study is likely due in part to the specific requirements of farming in wetland environments and the limitations these impose on crop cultivation (cf. Out, Reference Out2008b). For example, the small-scale, semi-agrarian farming of the middle/late Swifterbant (middle Swifterbant, 6550–5850 cal yr BP; late Swifterbant, 5850–5350 cal yr BP; Hazendonk group, 5750–5350 cal yr BP; Fig. 6) registers only minimally in the SPDs for the NW European Lowlands (including the Netherlands) and there is no evidence of the dramatic increase in population densities that typifies the introduction of farming in Britain/Ireland and S Scandinavia/N Germany (Raemaekers, Reference Raemaekers2003; Cappers and Raemakers, Reference Cappers and Raemakers2008; Out, Reference Out2008a, Reference Out2008b; Schepers, Reference Schepers2014; Timpson et al., Reference Timpson, Colledge, Crema, Edinborough, Kerig, Manning, Thomas and Shennan2014; Out and Dörfler, Reference Out and Dörfler2017). At ~4650 cal yr BP, coincidental with the end of the phase of settlement of Vlaardingen group and beginning of the Single Grave Culture (Vlaardingen group, 5250–4600 cal yr BP; Single Grave Culture, 4750–4300 cal yr BP), there is a more pronounced, long-lasting increase in inferred population levels that persisted for approximately 300 years (fig. 3 in Timpson et al., Reference Timpson, Colledge, Crema, Edinborough, Kerig, Manning, Thomas and Shennan2014). The impact of farming as witnessed on sites of the Vlaardingen group is when as Raemaekers (Reference Raemaekers2003, p. 745) suggests “real agrarian settlements” first appeared.
Palaeoclimate correlates
The data we have presented support our hypothesis that a decline in agricultural production is a driver for the identified population crash in NW Europe. The remaining issue is to evaluate whether it is possible to discriminate between either anthropogenic or climatic effects as influential factors in the decline. Our assessment of the current evidence suggests that both were contributory, such that worsening climate coupled with a reduction in soil quality led inevitably to a widespread population crash.
Palaeoclimate records indicate that since the onset of the Holocene the climate was extremely variable (Magny and Haas, Reference Magny and Haas2004; Mayewski et al., Reference Mayewski, Rohling, Stager, Karlén, Maasch, Meeker and Meyerson2004). Based on high-resolution climate proxy records, at least six rapid climate change events have been identified that are thought to have been of sufficient magnitude and extent to have impacted humans and their environments (Magny and Haas, Reference Magny and Haas2004; Mayewski et al., Reference Mayewski, Rohling, Stager, Karlén, Maasch, Meeker and Meyerson2004). Pertinent to our study is the fluctuation in climate from 5550–5300 cal yr BP, as observed in the higher lake levels at Arbon Bleiche, Lake Constance (Switzerland), and which correlates with the period of declining population densities (Magny and Haas, Reference Magny and Haas2004). This episode of climatic instability is also identified in records for glacial advance and tree limit decline and is characterised by cooler and wetter conditions that are experienced globally in both hemispheres, albeit at differing intensities and scales (Magny and Haas, Reference Magny and Haas2004; Mayewski et al., Reference Mayewski, Rohling, Stager, Karlén, Maasch, Meeker and Meyerson2004; Bevan et al., Reference Bevan, Colledge, Fuller, Fyfe, Shennan and Stevens2017).
The impact of climate on agricultural productivity has been argued in several recent studies that show how colder and wetter climatic conditions after ~5500 cal yr BP are correlated with a reduction in the quality of growing conditions and evidence of decreases in local Neolithic populations in areas of NW Europe, e.g., Britain and Ireland (Verrill and Tipping, Reference Verrill and Tipping2010; Whitehouse et al., Reference Whitehouse, Schulting, McClatchie, Barratt, McLaughlin, Bogaard, Colledge, Marchant, Gaffrey and Bunting2014; Bevan et al., Reference Bevan, Colledge, Fuller, Fyfe, Shennan and Stevens2017), the British mainland (Stevens and Fuller, Reference Stevens and Fuller2012, Reference Stevens and Fuller2015), and S Scandinavia (Hinz, Reference Hinz2015; Warden et al., Reference Warden, Moros, Neumann, Shennan, Timpson, Manning and Sollai2017). For example, in their detailed survey of data from sediment cores in the Baltic Sea, Warden et al. (Reference Warden, Moros, Neumann, Shennan, Timpson, Manning and Sollai2017, p. 6) conclude that fluctuations in climate between 6000 and 4000 cal yr BP were fundamental factors in determining demographic and cultural changes in S Scandinavia. They link ameliorating conditions at the beginning of this period to a dramatic population increase and to the emergence of farming and, most significantly, given the similarity with results we highlight in our study, they state that: “the long term cooling from ca. 5,600 cal. yr BP (most pronounced after 4,500 cal. yr BP) drove a gradual decrease in farming productivity causing a reduction in population size and contributed to a later resurgence of hunter-gatherer-fisher communities”.
The fact that post-crash population levels remain low for the next several centuries across most of NW Europe, even after the proposed cold/wet climatic episode, reduces the strength of the climate-forcing hypothesis, but is consistent with the hypothesis of a depreciation in soil fertility (Downey et al., Reference Downey, Bocaege, Kerig, Edinborough and Shennan2014, Reference Downey, Haas and Shennan2016; fig. 3 in Bevan et al., Reference Bevan, Colledge, Fuller, Fyfe, Shennan and Stevens2017). Human overexploitation of soils from intensive cultivation during the earlier Neolithic therefore remains in our view a strong, and at least equally compelling explanation for declines in agricultural productivity.
CONCLUSION
We have established that agricultural production did decline in the period associated with the middle Neolithic population crash at approximately 5550 cal yr BP in NW Europe. Our data demonstrate persistently high proportions of barley relative to other crop types after 5450 cal yr BP that are consistent with the depreciation in growing conditions; but, more significantly, data on weed ecology and settlement site locations show an overall decrease in soil fertility of arable fields during this same period. Notably, these changes in agriculture are temporally correlated with declines in population densities that begin at ~5550 cal yr BP, as documented by summed radiocarbon distribution models.
In the specific case of Neolithic agriculture in NW Europe, despite the emergence of a food production system that focussed on small-scale intensive cultivation and which included the application of animal fertilisers to enhance soil quality, we propose that the impact of population growth led to increasing pressure on soils. While the model of intensive fixed-plot cultivation used during the early Neolithic provided high returns and temporarily increased carrying capacity, the data we have presented suggest that in NW Europe these strategies were not sustainable over the longer term (i.e., over four to five centuries). Our results are consistent with the hypothesis that soil degradation increased over the course of the early Neolithic, such that by the middle Neolithic there is a reduction in regional carrying capacities and a widespread change in agricultural strategy towards more extensive and livestock-based approaches (Cramp et al., Reference Cramp, Jones, Sheridan, Smyth, Whelton, Mulville, Sharples and Evershed2014; Bevan et al., Reference Bevan, Colledge, Fuller, Fyfe, Shennan and Stevens2017). We propose that because of the long-term stabilisation of populations at well below the densities of the early Neolithic “boom” period, the role of short-term climate deterioration is likely only to have exacerbated a longer-term anthropogenic source of diminishing soil quality.
The consensus amongst historical and agricultural geographers is that farmers were able to adapt practices to changing circumstances, for example to alleviate pressures of overcrowding and subsequent land shortages or to mitigate against losses due to failing harvests, and adopt appropriate strategies for maximising outputs that are not predetermined but instead are chosen from a range of possible options (Grigg, Reference Grigg1979, Reference Grigg1980; van der Veen, Reference van der Veen2005; McClatchie, Reference McClatchie and Smith2014). Few of these mitigation strategies, however, can be applied without severe consequences for the long-term sustainability of farming systems and agricultural intensification (e.g., increasing inputs per unit area to maintain or increase outputs) can result in severe soil degradation (e.g., Foucher et al., Reference Foucher, Salvador-Blanes, Evrard, Simonneau, Chapron, Courp, Cerdan, Lefèvre, Adriaensen, Lecompte and Desmet2014). But the effects of the failure to adapt, or to adopt cultivation systems according to changes in circumstances so as to maintain levels of productivity through intensification are not necessarily manifest in the short term, and as Reeves (Reference Reeves1997, p. 135) suggests, the “sustainability of an agricultural system should properly be measured in millenniums [sic], not years or even centuries.” Our work emphasises the value of taking a long-term view of changes in agricultural practices and correlating these with population reconstructions to build an integrated understanding of the relationship between food production, population history, and culture change.
ACKNOWLEDGEMENTS
This research was funded by the European Research Council Advanced Grant #249390 awarded to Professor Stephen Shennan (University College London) for the EUROEVOL project. We are grateful to Meriel McClatchie for making available the majority of the Irish archaeobotanical data and for her help collating the British and Irish records in the EUROEVOL database. Our thanks also to Adrian Timpson who produced Figure 1. Several reviewers made extremely helpful comments and we have amended the text accordingly to address many of the issues they raised; we thank them for their considered and detailed reading of our work.