Following an acute stroke, the body rapidly enters a state of hypermetabolism and hypercatabolism. This severe stress response frequently leads to malnutrition and the rapid depletion of muscle mass, a condition known as acute post-stroke wasting. Such a state of malnutrition is closely associated with an increased risk of infectious complications, delayed neurological recovery, prolonged hospital stays and higher mortality rates(Reference Dávalos, Ricart and Gonzalez-Huix1,Reference Kishimoto, Nemoto and Maezawa2) . Mismatch between prescribed energy and actual requirements may exacerbate protein catabolism, leading to accelerated muscle loss during the acute phase of stroke. Recent studies have quantified this catabolic burden, showing that a significant portion of patients lose fat-free mass within the first 2 weeks, which independently predicts poor functional outcomes(Reference Prado, Landi and Chew3). Consequently, proactive and rational nutritional support has become a critical component of the comprehensive management of acute stroke.
Currently, empiric nutritional support based on predictive equations (e.g. 25–30 kcal/kg/d) is a common strategy in clinical practice. However, these predictive formulas may not accurately reflect the actual energy expenditure of individual patients, particularly during the acute phase of stroke where pathophysiological status changes rapidly(Reference De Waele, Jonckheer and Wischmeyer4). Studies employing indirect calorimetry have consistently demonstrated a wide disparity between measured energy expenditure and values predicted by common equations, leading to both under- and overfeeding in a substantial number of cases(Reference Bendavid, Lobo and Barazzoni5). Both underfeeding and overfeeding can adversely affect patient outcomes; underfeeding exacerbates catabolism, while overfeeding may lead to metabolic complications such as hyperglycaemia and hepatic steatosis, as well as an increased risk of gastroesophageal reflux and aspiration(Reference Martindale, McClave and Vanek6).
Indirect calorimetry, recognised as the gold standard for measuring resting energy expenditure (REE), offers a pathway to personalised ‘precision nutrition’ by providing an objective assessment of individual energy needs(Reference Kleindienst, Brabant and Bock7). In critically ill patients, REE-guided nutritional support has been shown to improve clinical outcomes(Reference de Man, Gunst and Reintam Blaser8). Nevertheless, high-quality evidence from randomised or quasi-randomised controlled trials specifically investigating the impact of REE-guided support on body composition – particularly the preservation of muscle mass – and nutritional status in acute stroke patients remains limited and inconclusive(Reference Toni, Morandi and Busacchi9).
Therefore, we conducted this quasi-randomised controlled trial to test the hypothesis that an individualised nutritional protocol, guided by REE measurements via indirect calorimetry, would be associated with better preservation of fat-free mass-related surrogate indicators and improved nutritional status than standard weight-based care during the acute phase of ischaemic stroke(Reference Tatucu-Babet, Fetterplace and Lambell10–Reference Scherbakov, von Haehling and Anker12).
Accordingly, this study prospectively evaluated temporal muscle thickness and calf circumference as practical surrogate indicators of fat-free mass, while also assessing nutritional biomarkers, inflammatory biomarkers, feeding efficiency and clinical safety. Because allocation was based on admission-number parity, the study should be interpreted as a quasi-randomised trial rather than a fully randomised controlled trial.
Methods
Study design and participants
This single-centre, quasi-randomised controlled trial was conducted between April 2025 and September 2025. This study was conducted according to the guidelines laid down in the Declaration of Helsinki, and all procedures involving human subjects were approved by the Institutional Review Board of Nanjing Drum Tower Hospital, Affiliated Hospital of Medical School (Approval No: 2022-487-02), and written informed consent was obtained from all participants or their legal surrogates. Eligible patients were adults (age ≥ 18 years) admitted with acute ischaemic stroke within 48 h of onset and requiring enteral nutritional support. Key exclusion criteria included pre-existing conditions affecting muscle function, pre-existing severe hepatic or renal dysfunction, pre-existing neuromuscular diseases, expected survival of less than 14 d, pregnancy and participation in another conflicting clinical trial. Patients or the public were not involved in the design, conduct, reporting or dissemination plans of this trial.
Quasi-random allocation
Patients were allocated based on the parity of their hospital admission number (odd v. even). Blinding of clinicians and dietitians was not feasible due to the intervention requirements.
Trial registration: Chinese Clinical Trial Registry, ChiCTR-IPR-16010051, registered 30 November 2016. https://www.chictr.org.cn/
Sample size
The sample size was calculated based on an expected 0·8 cm difference in calf circumference, with a sd of 1·2 cm, α = 0·05 and 80 % power, resulting in a target of twenty-eight patients per group(Reference Kishimoto, Nemoto and Maezawa2). Given the exploratory nature of this quasi-randomised trial, the sample size was considered sufficient to detect clinically meaningful changes in calf circumference while providing preliminary data on other fat-free mass surrogates(Reference Prado, Landi and Chew3,Reference De Waele, Jonckheer and Wischmeyer4) .
Intervention
Control Group: Patients in the control group received standard nutritional support, which involved the administration of 25 kcal/kg/d based on their ideal body weight and reached the target energy within 3 d, in accordance with contemporary guideline recommendations for stroke patients.
REE-guided Group: Patients in the intervention group underwent REE measurement via indirect calorimetry (keluode Ruichao-se). The measurement was performed for 10 min under stable conditions, and the measured REE value was used to prescribe the daily caloric target. The nutritional goal was set at 120 % of the measured REE, and feeding was advanced with the aim of reaching the full caloric target within 3 d(Reference Singer, Blaser and Berger13).
In both groups, enteral nutrition was initiated within 48 h of admission, primarily via a nasogastric tube, using a standard polymeric formula. The feeding protocol followed a progressive rate increase until the target caloric intake was achieved.
Outcome measures
The primary outcomes were day 14 measurements of fat-free mass surrogates, with analyses adjusted for baseline day 0 values. These outcomes included bilateral temporal muscle thickness, measured on cranial CT or MRI scans at the level of the orbital roof, and calf circumference, measured at the point of maximal girth on each leg, with the final value representing the average of the left and right measurements.
Secondary outcomes included nutritional biomarkers (serum prealbumin, albumin and transferrin levels), inflammatory biomarkers (leucocyte count, C-reactive protein (CRP) and procalcitonin (PCT)), nutritional support efficiency (time to reach target caloric intake and duration of enteral nutrition interruption) and clinical outcomes on day 14 (gastrointestinal complications, pneumonia and National Institutes of Health Stroke Scale (NIHSS) score at discharge). Baseline values of biomarkers and NIHSS score were also recorded.
Statistical analysis
Statistical analyses were performed using SPSS Statistics version 26.0. Continuous variables were compared using Mann–Whitney U test and categorical variables with Fisher’s exact test. Primary outcomes (day 14 fat-free mass surrogates) were analysed using ANCOVA, adjusting for baseline value, age, sex, day 0 NIHSS score, day 0 CRP and total energy intake. Complete-case analysis was used, excluding patients with missing outcome data. Secondary outcomes were analysed descriptively; no multiplicity adjustment was applied as exploratory endpoints. A two-sided P value of less than 0·05 was considered statistically significant.
Results
Participant flow
A total of seventy-four patients with acute ischaemic stroke requiring enteral nutritional support were assessed for eligibility between April 2025 and September 2025. Before allocation, six patients were excluded, including two who refused treatment and four who were unable to cooperate with REE monitoring. The remaining sixty-eight patients were allocated according to the prespecified quasi-random allocation procedure. In the REE-guided group, thirty patients were allocated, of whom two were lost to follow-up and four had incomplete outcome data, leaving twenty-four patients for the final analysis. In the control group, thirty-eight patients were allocated, of whom three were lost to follow-up and five had incomplete outcome data, leaving thirty patients for the final analysis. Overall, fifty-four patients were included in the final analysis. The participant flow is shown in Figure 1, which was constructed following the CONSORT guidelines.
Participant flow diagram according to the CONSORT guidelines. Of seventy-four eligible patients assessed, six were excluded before randomisation (two refused treatment and four were unable to cooperate with REE monitoring). A total of sixty-eight patients were allocated to the REE-guided group (n 30) or the control group (n 38). After loss to follow-up and exclusion due to incomplete data, twenty-four patients in the REE-guided group and thirty patients in the control group were included in the final analysis. REE, resting energy expenditure.

Patient baseline characteristics and intergroup comparability
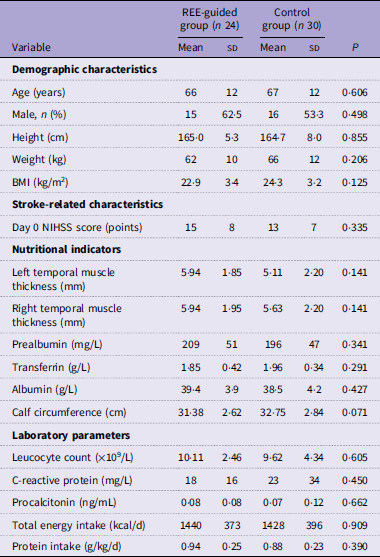
Baseline demographic, clinical, anthropometric, nutritional and laboratory characteristics were generally comparable between the REE-guided and control groups (Table 1). There were no statistically significant differences in age, sex distribution, height, weight, BMI or day 0 NIHSS score between the two groups. Baseline nutritional indicators, including left temporal muscle thickness, right temporal muscle thickness, prealbumin, transferrin, albumin and calf circumference, were also comparable between groups.
Baseline characteristics of the study population

Table 1. Long description
A table comparing baseline characteristics of the REE-guided group and the control group. The table has 24 rows and 6 columns. Column headers are Variable, REE-guided group (n 24) Mean, REE-guided group (n 24) SD, Control group (n 30) Mean, Control group (n 30) SD, and P. Row labels include Demographic characteristics, Stroke-related characteristics, Nutritional indicators, and Laboratory parameters. Each row provides mean and standard deviation values for both groups and a P value indicating statistical significance. Notable variables include Age, Height, Weight, BMI, Day 0 NIHSS score, Left temporal muscle thickness, Right temporal muscle thickness, Prealbumin, Transferrin, Albumin, Calf circumference, Leucocyte count, C-reactive protein, Procalcitonin, Total energy intake, and Protein intake.
REE, resting energy expenditure; NIHSS, National Institutes of Health Stroke Scale.
Data are presented as mean and standard deviation or number (percentage). Categorical variables were analysed using Fisher’s exact test, and continuous variables were analysed using the Mann–Whitney U test. All P values > 0.05, indicating no statistically significant differences between the two groups at baseline.
Inflammatory and infection-related laboratory parameters, including leucocyte count, CRP and PCT, did not differ significantly between groups. Baseline total energy intake was 1440 (sd 373) kcal/d in the REE-guided group and 1428 (sd 396) kcal/d in the control group (P = 0·909). Protein intake was 0·94 (sd 0·25) g/kg/d and 0·88 (sd 0·23) g/kg/d, respectively (P = 0·390).
Primary fat-free mass-related outcomes
At day 14, unadjusted comparisons for left and right temporal muscle thickness showed no statistically significant differences between the REE-guided and control groups (Table 2). Calf circumference was lower in the REE-guided group in the unadjusted day 14 comparison. However, after fully adjusting for age, sex, baseline NIHSS score, total energy intake and day 0 CRP, the REE-guided group demonstrated significantly higher adjusted left temporal muscle thickness (β = 0·56, 95 % CI 0·07 to 1·05, P = 0·031). Adjusted differences for right temporal muscle thickness and calf circumference did not reach statistical significance.
Analysis of primary fat-free mass-related outcomes at day 14

Table 2. Long description
A table comparing muscle thickness and calf circumference between REE group and control group. The table has 4 rows and 7 columns. Column headers are Parameter, REE group (n 24), Control group (n 30), Crude P, Fully adjusted β, Fully adjusted 95% CI, and Fully adjusted P. Row labels are Left temporal muscle thickness (mm), Right temporal muscle thickness (mm), and Calf circumference (cm). Row 1: Left temporal muscle thickness (mm), REE group Mean 5.32, SD 1.96, Control group Mean 4.99, SD 2.24, Crude P 0.566, Fully adjusted β 0.56, Fully adjusted 95% CI 0.07, 1.05, Fully adjusted P 0.031. Row 2: Right temporal muscle thickness (mm), REE group Mean 5.56, SD 2.10, Control group Mean 5.36, SD 2.45, Crude P 0.746, Fully adjusted β 0.18, Fully adjusted 95% CI -0.52, 0.88, Fully adjusted P 0.611. Row 3: Calf circumference (cm), REE group Mean 30.77, SD 2.33, Control group Mean 32.42, SD 3.01, Crude P 0.027, Fully adjusted β 0.32, Fully adjusted 95% CI -0.77, 1.42, Fully adjusted P 0.566.
REE, resting energy expenditure; NIHSS, National Institutes of Health Stroke Scale; CRP, C-reactive protein.
Model adjusted for group, age, sex, NIHSS score at day 0 and total energy intake and CRP at day 0.
Data are presented as mean and standard deviation. Crude P values were obtained from unadjusted between-group comparisons at day 14. Baseline-adjusted β values were estimated using ANCOVA models with the day 14 value as the dependent variable, treatment group as the main independent variable and the corresponding baseline value as a covariate. Fully adjusted β values were estimated using multivariable ANCOVA models additionally adjusted for age, sex, day 0 NIHSS score, day 0 CRP and total energy intake. β represents the adjusted mean difference between the REE-guided group and the control group. Positive β values indicate higher values in the REE-guided group.
Nutritional and inflammatory biomarkers at day 14
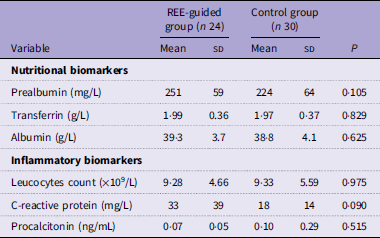
At day 14, nutritional and inflammatory biomarkers are summarised in Table 4. The REE-guided group showed numerically higher prealbumin levels than the control group, although the between-group difference did not reach statistical significance (251 (sd 59) mg/L v. 224 (sd 64) mg/L, P = 0·105). Transferrin and albumin levels were similar between groups (1·99 (sd 0·36) g/L v. 1·97 (sd 0·37) g/L, P = 0·829; 39·3 (sd 3·7) g/L v. 38·8 (sd 4·1) g/L, P = 0·625, respectively).
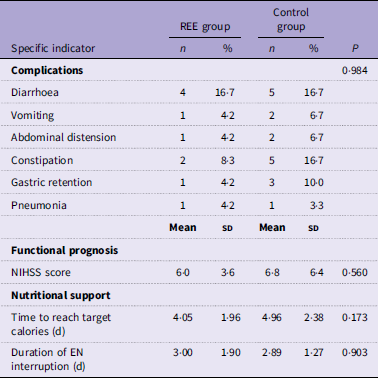
Comparison of clinical secondary outcomes between groups

Table 4. Long description
A table comparing clinical secondary outcomes between the REE group and the Control group. The table has 12 rows and 6 columns. Column headers are Specific indicator, REE group n, REE group percent, Control group n, Control group percent, and P. Row labels include Complications, Diarrhoea, Vomiting, Abdominal distension, Constipation, Gastric retention, Pneumonia, Functional prognosis, NIHSS score, Nutritional support, Time to reach target calories (d), and Duration of EN interruption (d). The table lists the number and percentage of complications for each group, along with the mean and standard deviation for functional prognosis and nutritional support metrics. Notable trends include similar percentages of diarrhoea in both groups and varying instances of other complications. The NIHSS score, time to reach target calories, and duration of EN interruption are also compared between the groups.
REE, resting energy expenditure; NIHSS, National Institutes of Health Stroke Scale; EN, enteral nutrition.
Comparison of glycaemic stability, complication rates, functional prognosis, and nutritional support efficiency between the REE-guided and control groups.
Data are presented as mean and standard deviation or number (percentage). No statistically significant differences were observed in any of these secondary outcomes (all P > 0.05), though trends favoured the REE group for improved glycaemic stability, functional recovery and nutritional support efficiency.
Inflammatory biomarkers did not differ significantly between groups at day 14. Leucocyte count was comparable between the REE-guided and control groups (9·28 (sd 4·66) × 109/L v. 9·33 (sd 5·59) × 109/L, P = 0·975). CRP was numerically higher in the REE-guided group, but this difference was not statistically significant (33 (sd 39) mg/L v. 18 (sd 14) mg/L, P = 0·090). PCT was numerically lower in the REE-guided group, but the difference was also not statistically significant (0·07 (sd 0·05) ng/mL v. 0·10 (sd 0·29) ng/mL, P = 0·515). Overall, these findings suggest that REE-guided nutritional support was associated with a non-significant trend towards higher prealbumin levels but did not produce statistically significant differences in nutritional or inflammatory biomarkers at day 14.
Clinical secondary outcomes
Clinical secondary outcomes are shown in Table 3. The overall distribution of recorded complications did not differ significantly between the two groups (P = 0·984). The frequencies of diarrhoea, vomiting, abdominal distension, constipation, gastric retention and pneumonia were broadly comparable between groups, suggesting that REE-guided nutritional support did not increase gastrointestinal or infectious complications.
Nutritional and inflammatory biomarkers at day 14

Table 3. Long description
A table comparing nutritional and inflammatory biomarkers between the REE-guided group and the control group. The table has 8 rows and 6 columns. The columns are labeled Variable, REE-guided group (n 24) Mean, REE-guided group (n 24) SD, Control group (n 30) Mean, Control group (n 30) SD, and P. The rows are labeled with different biomarkers: Prealbumin (mg/L), Transferrin (g/L), Albumin (g/L), Leucocytes count (x10/L), C-reactive protein (mg/L), and Procalcitonin (ng/mL). Each row provides the mean and standard deviation (SD) values for both groups and a P value for comparison. Notable biomarkers include Prealbumin with means of 251 mg/L and 224 mg/L, Transferrin with means of 1.99 g/L and 1.97 g/L, and Leucocytes count with means of 9.28 x10/L and 9.33 x10/L for the REE-guided and control groups, respectively.
REE, resting energy expenditure.
Data are presented as mean and standard deviation. Continuous variables were analysed using the Mann–Whitney U test. All P values were > 0.05, indicating no statistically significant between-group differences in nutritional or inflammatory biomarkers at day 14.
Neurological status at discharge, assessed by the NIHSS score, was also similar between the two groups. The NIHSS score was 6·0 (sd 3·6) in the REE-guided group and 6·8 (sd 6·4) in the control group, with no statistically significant difference (P = 0·560). Regarding nutritional support efficiency, the REE-guided group required a numerically shorter time to reach target caloric intake than the control group (4·05 (sd 1·96) d v. 4·96 (sd 2·38) d), although this difference was not statistically significant (P = 0·173). The duration of enteral nutrition interruption was comparable between groups (3·00 (sd 1·90) d v. 2·89 (sd 1·27) d, P = 0·903).
Discussion
In this single-centre, quasi-randomised trial, REE-guided nutritional support was feasible and safe in acute ischaemic stroke patients requiring enteral nutrition. The intervention was associated with higher adjusted left temporal muscle thickness at day 14, whereas right temporal muscle thickness, calf circumference, nutritional biomarkers and clinical secondary outcomes did not differ significantly. These exploratory findings warrant confirmation in larger randomised trials(Reference De Waele, Jonckheer and Wischmeyer4,Reference Cederholm, Barazzoni and Austin14) .
The day 14 biomarker analysis provided a more cautious signal regarding the physiological effects of REE-guided nutrition. Prealbumin was numerically higher in the REE-guided group than in the control group, but the difference did not reach statistical significance (251 (sd 59) mg/L v. 224 (sd 64) mg/L, P = 0·105)(Reference Shenkin15,Reference Ingenbleek and Young16) . In contrast, transferrin and albumin were almost identical between groups. These findings suggest that REE-guided nutrition may have a potential short-term effect on visceral protein-related nutritional status, but the present sample size was insufficient to confirm a statistically significant biomarker benefit(Reference Kleindienst, Brabant and Bock7,Reference Toni, Morandi and Busacchi9) .
The inflammatory biomarker profile should be interpreted conservatively. Leucocyte count was nearly identical between groups, PCT was numerically lower in the REE-guided group and CRP was numerically higher in the REE-guided group, with none of these differences reaching statistical significance(Reference Mishra, Malik and Hachiya19–Reference Montellano, Ungethüm and Ramiro22). Therefore, the present data do not support a clear anti-inflammatory effect of REE-guided nutritional support. Because albumin and prealbumin are negative acute-phase proteins, their interpretation in acute stroke should account for systemic inflammation. The observed numerical increase in prealbumin may reflect improved nutritional delivery, resolving catabolism, individual variation in inflammatory status or a combination of these factors. Further studies with larger sample sizes and repeated biomarker measurements are needed to clarify whether REE-guided nutrition has a true effect on inflammatory-metabolic recovery after stroke.
The adjusted signal for left temporal muscle thickness suggests possible preservation of one fat-free mass-related surrogate marker in the acute phase of ischaemic stroke. After adjustment for age, sex, baseline NIHSS score, total energy intake and day 0 CRP, left temporal muscle thickness was significantly higher in the REE-guided group (β = 0·56, 95 % CI 0·07–1·05, P = 0·031; Table 2), whereas right temporal muscle thickness and calf circumference showed non-significant adjusted differences (β = 0·18, 95 % CI −0·52 to 0·88, P = 0·611; β = 0·32, 95 % CI: −0·77 to 1·42, P = 0·566, respectively). This finding is biologically plausible in the context of individualised energy provision and the numerically higher prealbumin level observed in the REE-guided group. However, because inflammatory biomarkers did not show a consistent favourable pattern, the potential muscle-preserving effect should not be attributed to attenuation of systemic inflammation based on the present data(Reference Scherbakov, von Haehling and Anker12,Reference Ryan, Buscemi and Forrester24–Reference Yoo, Kim and Kwon26) . The lack of bioelectrical impedance analysis to partition water from muscle mass remains a limitation, particularly for calf circumference. Calf circumference may be influenced by lower limb oedema, a common occurrence in acute stroke patients, and should therefore be interpreted cautiously as a fat-free mass-related surrogate marker.
While weight-based calorie calculation remains feasible, predictive formulas may not accurately capture individual energy requirements during the acute phase, when energy expenditure can vary substantially due to disease severity, inflammation, immobilisation and complications(Reference Bendavid, Lobo and Barazzoni5,Reference Oshima, Berger and Waele27,Reference Singer, Blaser and Berger28) . Both underfeeding and overfeeding may be harmful: underfeeding can aggravate muscle catabolism and delay recovery, whereas overfeeding may increase the risk of hyperglycaemia, hepatic steatosis, gastrointestinal intolerance and aspiration-related complications(Reference Martindale, McClave and Vanek6,Reference Compher, Bingham and McCall31,Reference Arabi, Aldawood and Haddad32) . Therefore, individualised REE-guided nutritional support may provide more precise energy provision, reduce endogenous protein breakdown and attenuate stroke-induced sarcopenia, a key component of post-stroke disability and long-term functional dependence(Reference Scherbakov, von Haehling and Anker12,Reference Ryan, Buscemi and Forrester24) .
Clinical secondary outcomes did not differ significantly between groups. The overall complication profile, gastrointestinal complications, pneumonia, NIHSS score at discharge, time to reach target calories and duration of enteral nutrition interruption were comparable, indicating that REE-guided nutritional support was feasible and did not increase short-term clinical risks in acute ischaemic stroke patients(Reference Guyatt, Oxman and Kunz33,Reference Sun, Ioannidis and Agoritsas34) . Together with the day 14 biomarker results, these findings suggest that REE-guided nutrition may offer a modest physiological signal, mainly reflected by adjusted left temporal muscle thickness and a non-significant increase in prealbumin, rather than broad improvements across clinical or inflammatory endpoints(Reference Slingerland-Boot, Adhikari and Mensin35,Reference Duan, Zheng and Zhou36) . Although the time to reach target caloric intake was numerically shorter in the REE-guided group, this did not reach statistical significance and should be interpreted as an exploratory finding.
In conclusion, REE-guided nutritional support is a feasible and safe strategy in acute ischaemic stroke patients and was associated with a favourable adjusted signal in one fat-free mass-related surrogate indicator. These findings support larger, adequately powered trials to evaluate whether such precision nutrition translates into improved long-term functional recovery.
Limitation
Several limitations must be acknowledged. The single-centre design may limit generalisability, and the sample size was calculated based on calf circumference and may have been insufficient for detecting differences in temporal muscle thickness, biomarkers and clinical endpoints. The 14-d intervention period for the primary outcome precludes assessment of the long-term sustainability of the observed signals and their potential impact on functional independence. Future research should focus on multi-centre validation with larger cohorts, longer follow-up to assess impacts on durable functional independence, quality of life and mortality and detailed cost-effectiveness analyses of implementing indirect calorimetry routinely in stroke units(Reference Cederholm, Barazzoni and Austin14). Although REE-guided nutrition showed physiological advantages, its routine implementation requires significant resources, including equipment and trained personnel. Our results suggest clinical benefits in nutritional trajectory, but further large-scale cost-effectiveness analyses are warranted before recommending routine indirect calorimetry for all stroke admissions.
Another limitation is that nutritional and inflammatory biomarkers were analysed as exploratory secondary outcomes and were assessed using complete-case data. The study was not powered to detect differences in prealbumin, albumin, transferrin, CRP, leucocyte count or PCT. In addition, the relatively large variability in CRP values, especially in the REE-guided group, may reflect heterogeneity in post-stroke inflammatory responses, infections, stroke severity or other unmeasured clinical factors. Therefore, biomarker findings should be interpreted as hypothesis-generating rather than confirmatory.
Conclusion
In conclusion, this study suggests that REE-guided nutritional support is a feasible and safe strategy for acute ischaemic stroke patients requiring enteral nutrition. Compared with weight-based calorie calculation, REE-guided nutrition was associated with higher adjusted left temporal muscle thickness at day 14 and a non-significant trend towards higher prealbumin levels. These findings support the potential value of individualised energy prescription, but larger randomised trials are needed to determine whether REE-guided nutrition can improve nutritional recovery, muscle preservation and long-term functional outcomes after stroke. These findings advocate for the integration of indirect calorimetry as a key component of personalised medicine in acute neurocritical care, moving beyond one-size-fits-all formulas to tailor support to the individual’s evolving metabolic needs and ultimately aiming to improve long-term recovery after stroke.
Data availability statement
The data that support the findings of this study are available from the corresponding author upon reasonable request.
Acknowledgements
The authors would like to acknowledge all members in the Department of Neurology of Nanjing Drum Tower Hospital for the study development and deployment.
Author contributions
X.Y.: Data curation-Lead, Investigation-Lead, Writing – original draft-Lead; T.Z.: Data curation-Equal, Investigation-Equal; W.J.: Investigation-Equal, Project administration-Equal; H.L.: Investigation-Equal; X.C.: Validation-Equal; W.S.: Formal analysis-Lead; X.Z.: Conceptualisation-Lead, Funding acquisition-Equal, Resources-Lead, Writing – review and editing-Lead.
Financial support
This research was supported by the Clinical Trials from the Affiliated Drum Tower Hospital, Medical School of Nanjing University (2022-LCYJ-MS-20), China Institute for Hospital Reform and Development, Nanjing University (NDYGN2023034), and Hospital Management Research Institute, National Health Commission of the People’s Republic of China (YM2024ZD028).
Competing interests
All authors declare no relevant interests related to this study.