Introduction
There is controversy over whether body mass index (BMI) cut offs used for adults should be applied to older people (Heiat et al., Reference Heiat, Vaccarino and Krumholz2001), as mortality risk seems lowest for overweight elderly (Flicker et al., Reference Flicker2010), and highest for those elderly whose BMI decreases over time (Harris et al., Reference Harris, Cook, Garrison, Higgins, Kannel and Goldman1988; Deeg et al., Reference Deeg, Miles, van Zonneveld and Curb1990; Lee and Paffenbarger, Reference Lee and Paffenbarger1992; Reference Lee and Paffenbarger1996). As a potentially modifiable and readily monitored factor in health and disease, a better understanding of the significance of body mass in later life has implications for the health and well-being of older people worldwide.
Several prospective studies have examined the association between adiposity markers and dementia, but these have varied in terms of the target population, age of participants, adiposity measurement used, and duration of follow-up to dementia diagnosis. Studies investigating participants in later life have shown conflicting associations: some studies have reported that obese elderly women are at increased risk of dementia (Gustafson et al., Reference Gustafson, Rothenberg, Blennow, Steen and Skoog2003; Hayden et al., Reference Hayden2006), whereas others have reported that no such association exists (Stewart et al., Reference Stewart2005). More recent prospective studies of elderly men and women have reported that either BMI is inversely related to dementia risk (Atti et al., Reference Atti, Palmer, Volpato, Winblad, De Ronchi and Fratiglioni2008; West and Haan, Reference West and Haan2009) or that BMI in the elderly has a “J-shaped” association with dementia (Luchsinger et al., Reference Luchsinger, Patel, Tang, Schupf and Mayeux2007). In a cohort sample of 12,047 men aged 65–84 years living in Perth, Australia, we observed the lowest hazard of dementia for men within the overweight BMI range, and the cumulative hazard of dementia was greatest for men with BMI <25 (Power et al., Reference Power, Alfonso, Flicker, Hankey, Yeap and Almedia2011). We also found a J-shaped association between dementia hazard and measures of adiposity, with nadir in the overweight range, suggesting that mild to moderate accumulation of adipose tissue in older men is associated with a reduction in the risk of dementia. One way of interpreting these findings is that changes in the quantity and distribution of adipose tissue in older age are adaptive and may confer a neuroprotective effect that minimizes the risk of cognitive decline. Such a finding is consistent with the hypothesis that the loss of adipose tissue in later life may deprive the aging brain of that purported neuroprotective effect (Harvey et al., Reference Harvey, Shanley, O'Malley and Irving2005). Hence, having a better understanding of the significance of changes in body mass in late life is important, as it has major implications for the type of advice health practitioners should offer their elderly patients regarding weight loss.
Several longitudinal studies have demonstrated that elderly persons who experience weight loss have a higher risk of dementia. Atti et al. (Reference Atti, Palmer, Volpato, Winblad, De Ronchi and Fratiglioni2008) demonstrated that a BMI loss >10% over three years increased the risk of dementia in subjects >75 years of age, but the association was only present for dementia cases detected in the subsequent three years (hazard ratio (HR) = 2.2, 95% CI = 1.3–3.7). Luchsinger et al. (Reference Luchsinger, Patel, Tang, Schupf and Mayeux2007) reported that those with weight loss >1 kg had a higher risk of dementia (HR = 1.9, 95% CI = 1.2–1.9) compared with persons with stable weight, even after adjustment for confounders. Similarly, Stewart et al. (Reference Stewart2005) demonstrated that incident dementia was associated with significant previous weight loss in men between the ages of 46 and 68 years who were followed for 32 years. Similar trends for weight loss were seen in the Religious Order (Buchman et al., Reference Buchman, Wilson, Bieias, Shah, Evans and Bennett2005) and Rancho Bernado studies (Barrett-Connor et al., Reference Barrett-Connor, Edelstein, Corey-Bloom and Wiederholt1996). However, it is possible that a declining BMI is a consequence rather than the cause of the underlying neurodegeneration associated with common dementia syndromes (Nourhashemi et al., Reference Nourhashemi2003), and Atti et al. (Reference Atti, Palmer, Volpato, Winblad, De Ronchi and Fratiglioni2008) postulated that the limited time-dependent association they observed in their study (<3 years) was consistent with such a hypothesis.
The study was designed to determine if changes in BMI over time were associated with incident dementia over a follow-up period of up to eight years in a community-dwelling sample of older men. Our primary hypothesis was that decreasing body mass over time would be associated with increased risk of dementia.
Methods
Study design and setting
The design was a prospective cohort study of community-dwelling men aged 65–79 years living in the Perth metropolitan area of Western Australia at the time of enrolment. The Human Research Ethics Committee of the University of Western Australia approved the study protocol, and the project was conducted in accordance with the principles of the declaration of Helsinki. All participants provided written informed consent prior to enrolment into the study.
Participants
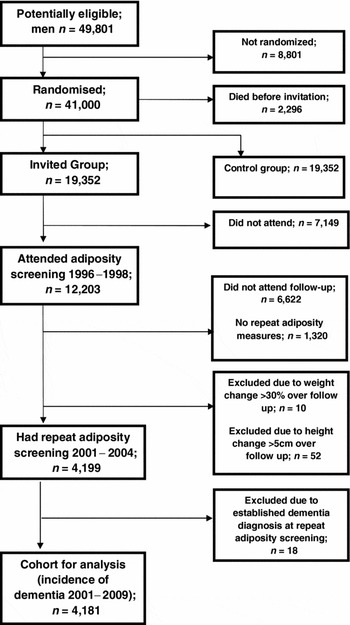
The Health In Men Study (HIMS) started in 1996 as part of a large randomized trial to reduce death caused by abdominal aortic aneurysms (Norman et al., Reference Norman2009). Eligible men at the time of recruitment were aged between 65 and 84 years and resident in Perth, and not in long-stay institutional accommodation. As enrolment to vote is compulsory for all adult Australians, a list of all 49,801 potentially eligible men was obtained from an electronic copy of the electoral role. After excluding 8,801 men who were no longer resident in Perth, and 2,296 who had died before being contacted, eligible men were randomized into either the screening group (n = 19,352) or control group (n = 19,352). Of those men invited to screening, 1,846 were ineligible, and 5,303 did not respond or declined to be screened, leaving 12,203 men who formed the HIMS cohort and attended initial screening for initial adiposity measures (see Figure 1).
Flow of participants in the study.

Eligible men were followed up for a period of five years, at which time they were invited to attend repeat screening, where adiposity measures were again performed. Of those invited to attend, 2,976 did not respond or declined to be screened, and 3,646 had died. Of 5,581 eligible participants, 4,261 had measures of adiposity. Men who had changes in adiposity measures that were deemed to be outside acceptable limits (assumed to be recording error) were also excluded from further analysis; this included a change in height >5 cm (n = 52), and a change in weight >30% (n = 10). We also excluded 18 men who had a diagnosis of dementia, leaving 4,181 men in whom were changes in adiposity over time as the exposure of interest could be ascertained, who were then followed up from this baseline for the outcome of dementia diagnosis (2001–2009) (see Figure 1). Follow-up was via the Western Australia Data Linkage System (WADLS) until they received a diagnosis of dementia, died, or had completed follow-up on 29th September 2009, whichever came first.
Outcomes of interest
Morbidity and mortality data was obtained via the WADLS, one of the most thorough electronic health record systems internationally (Holman et al., Reference Holman, Bass, Rouse and Hobbs1999). This system lends itself to longitudinal, population-based research, as it brings together name-identified records for all in-patient hospital admissions and public sector mental health services (in-patient, out-patient, and community mental health services). WADLS includes all morbidity and mortality data in Western Australia, coded according to the International Classification of Diseases, tenth revision (ICD-10); for events that occurred before 1996, coding is according to the ICD-9.
The diagnosis of dementia was the primary endpoint of interest of the study. The following ICD-9 and ICD-10 codes were used to establish the diagnosis of dementia during follow-up: all listed diagnoses (primary and secondary) for Alzheimer's dementia 331.0, F00, G30; vascular dementia 290.4, F01; fronto-temporal dementia 331.1, F02.0, G31.0; Parkinson's dementia or dementia with Lewy bodies F02.3, 331.82; Huntington's disease 333.4, G10, F02.2; mild cognitive impairment 331.83; and non-specific dementia 290.0, 290.1, 290.2, 290.3, 290.8, 290.9, 294.1, 294.8, 331.2, F02.8, F03, F05.1, G31.1, G31.8, G31.9. The text terms of these conditions were searched for in the morbidity data system to improve ascertainment of dementia cases, together with the following alternative medical terms: multi-infarct dementia, arteriosclerotic dementia, fronto-temporal lobe dementia, Pick's dementia, primary progressive dementia, and corticobasal dementia. As the accuracy of specific diagnostic causes of dementia in WADLS cannot be determined with certainty, all cases were grouped under the heading of “dementia.”
Adiposity measures
Adiposity measures were undertaken on two occasions (1996–1998, and 2001–2004), as outlined above. The same standard procedures were used to measure weight (to 0.2 kg) and height (to 0.5 cm) of all participants at both time points. Men were wearing light clothing at the time of measurement, as recommended by the World Health Organization (WHO; World Health Organization, 2000). BMI was calculated by dividing body weight (in kg) by the square of height (in meters). Men were classified in four BMI categories according to WHO definitions: less than 18.5 kg/m2 as underweight; 18.5–24.9 kg/m2 as normal weight; 25.0–29.9 kg/m2 as overweight; and 30.0 kg/m2 or more as obese (World Health Organization, 1999).
Other measures
A self-rating questionnaire was used to collect demographic, lifestyle, and clinical information from participants at baseline, at the time of repeat adiposity measures (2001–2004). The factors chosen for analysis were those in the literature associated with cognitive decline in older males. The age of participants was calculated by subtracting the date of birth from the date of assessment, and the highest educational achievement was recorded as having completed high school education or greater versus did not complete high school education. Participants were recorded as married if they reported being married or were living in a de facto relationship, and men were grouped according to whether they had been born in Australia or overseas. Lifestyle data included smoking history (never smoked, past smoker, current smoker), and alcohol intake reported as standard drinks in a week (none, less than 28 standard drinks, 28 or more standard drinks). Information about premorbid clinical diseases and treatment were self-reported at baseline (2001–2004). We asked participants, “have you ever been told by a doctor you suffer from or have you ever received treatment for” diabetes (yes/no), dyslipidemia (high cholesterol or triglycerides; yes/no), hypertension (yes/no), or coronary heart disease (if the patient reported having been told by a doctor that they had suffered a heart attack or that they had angina; yes/no). Participants who identified difficulties in any of the following areas were recorded as having sensorial problems: seeing newspaper print even with glasses, recognizing people across the road even with glasses, hearing a conversation even with a hearing aid, and speaking.
Information regarding diet and exercise were not available from baseline questionnaires (2001–2004), however were available for all participants from previous screening in 1996–1998 (at initial adiposity screening). This data included self-reported vigorous exercise of at least 150 minutes per week (e.g. jogging), and non-vigorous exercise (e.g. walking), and dietary preferences were recorded as the number of times per week meat and fish were consumed, as well as the type of milk that participants used (e.g. condensed, full cream, reduced-fat milk intake only, or a combination). These were included for analysis with the baseline data outlined above.
We used the abbreviated Duke Social Support Index (Koenig et al., Reference Koenig1993) to establish social supports of participants. Participants who indicated they had no events of social contact during the past week in at least two of three domains (spending time with another, talking on the phone, attending a group they belong to) were recorded as socially isolated. We also calculated the Charlson index based on data from WADLS in our sample; this index determines the presence and extent of significant medical comorbidity that is predictive of mortality, and has utility in longitudinal studies such as ours (Charlson et al., Reference Charlson, Pompei, Ales and MacKenzie1987). The composite score obtained was then stratified according to Quan et al. (Reference Quan2005), to produce a score ranging from 0 to 5 to reflect increasing severity of comorbidity from the Charlson index. The Mini-Mental State Examination (MMSE) was also undertaken, and participants who scored less than 24/30 on the MMSE were recorded as cognitively impaired (Kukull et al., Reference Kukull, Larson, Teri, Bowen, McCormick and Pfanschmidt1994).
Statistical analysis
Changes in BMI between the two measurement points were categorized into the following groups according to two models. Model 1: increase in BMI (gain of >1 unit of BMI), stable BMI (gain or loss of ≤1 unit of BMI), and decrease in BMI (loss of >1 unit of BMI); and Model 2: increase in BMI (gain of >2 units of BMI), stable BMI (gain or loss of ≤2 units of BMI), and decrease in BMI (loss of >2 units of BMI).
Firstly, we summarized the main exposure (change in BMI) for dementia outcome, reporting mean and standard deviation of change in BMI for dementia outcome. We then identified potential confounding factors at baseline (demographic, lifestyle, and clinical, as outlined above) within BMI change categories (increase in BMI, stable BMI, decrease in BMI), reporting frequency and percentage, and comparing categories using χ2.
Cox proportional hazard models were then used to investigate the association between changes in BMI and incident dementia, and then adjusted for the confounding factors identified above. Survival time was calculated from the date of entry into the study to the date of first recorded diagnosis of dementia, date of death, or the end of follow-up (30th September, 2009), whichever came first. The cumulative hazard of dementia over follow-up was determined and presented graphically according to change in BMI (stable, increase, or decrease), and then according to change within each of the BMI categories (BMI <25, BMI 25–29.9, BMI >30).
Using a Poisson regression analysis, we predicted incident rate of dementia for BMI. We then investigated the association between incident dementia and changes in BMI by using a restricted cubic spline with three knots. This is a function that produces a smooth curve fitted statistically through three given data points, and yields greater flexibility in the regression model and the exploration of non-linear associations (Heinzl and Kaider, Reference Heinzl and Kaider1997). The change in BMI was modeled as a continuous variable, and the results generated graphs demonstrating predicted incidence rate for dementia against change in BMI.
Finally, we performed several further analyses to determine how robust our findings were. In the first instance, we performed a sensitivity analysis and re-ran the analyses after excluding men with a survival time of less than three years (either because they had died or been diagnosed with dementia within the first three years of follow-up). Secondly, we performed an interaction analysis to determine if there was a BMI group (i.e. BMI <25, BMI 25–29.9, BMI >30) at higher risk of incident dementia, according to their change in BMI between 1996–1998 and 2001–2004.
We used Stata version 11.1 (StataCorp, College Station, Texas, USA) for analysis. Ninety-five percent confidence intervals (95% CI) were estimated for the HR and rates, and α was set at 5% and all probability tests reported are two-tailed.
Results
Included in the study were 4,181 men, whose age ranged from 69 to 87 years (mean 75.3 (SD = 4.1) years) at the repeat adiposity measures, and of whom 232 developed dementia during the 5.9±1.5 (IQR 5.3–6.6) years of follow-up. The average annual rate of dementia in this cohort was 5.5% (95% CI = 4.88–6.31). For the dementia group, participants had a mean loss of BMI of 0.5 kg/m2 (SD = 1.7 kg/m2) compared with a mean loss of BMI of 0.2 kg/m2 (SD = 1.5 kg/m2) for the group that remained free of dementia.
There were significant differences in the demographics in 1996 of the 4,181 participants for whom follow-up data on BMI was available compared to the 4,376 for whom follow-up data on BMI was not available (see Table S1 published as supplementary material online attached to the electronic version of this paper at http://journals.cambridge.org/ipg). Those 4,376 participants who were not included for analysis were: more likely to have migrated; less likely to have married; less likely to have completed high school; more likely to have smoked and do no exercise, or do less vigorous exercise; and more likely to have been hypertensive and diabetic.
BMI modeling
Model 1 had participants distributed in change categories as follows: BMI stable 56.8%, BMI decrease 25.3%, BMI increase 17.9%; there were less participants in the BMI increase and BMI decrease categories in Model 2 (BMI stable 84.9%, BMI decrease 9.5%, BMI increase 5.6%). We therefore performed analyses according to Model 1 in the first instance (increase in BMI (gain of >1 unit of BMI), stable BMI (gain or loss of <1 unit of BMI), decrease in BMI (loss of >1 unit of BMI)) and then repeated the analyses according to Model 2. Unless otherwise stated, the following results refer to analysis performed according to Model 1.
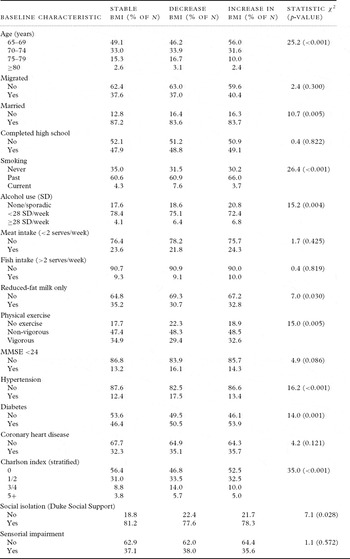
Table 1 shows the frequency of demographic, lifestyle, and clinical variables among study participants, according to BMI change categories (Model 1). Significant group differences were seen for age, marital status, smoking, alcohol use, reduced-fat milk intake, physical activity, hypertension, diabetes, and Charlson and Duke indices.
Demographic, lifestyle, and past medical characteristics of participants at study baseline (2001–2004), according to change in BMI from 1996–1998 to 2001–2004

Note: Stable BMI = gain or loss of ≤1 unit of BMI; Increase in BMI = gain of >1 unit of BMI; Decrease in BMI = loss of >1 unit of BMI; BMI = body mass index; SD = standard drinks; MMSE = Mini-Mental State Examination.
BMI change and dementia risk
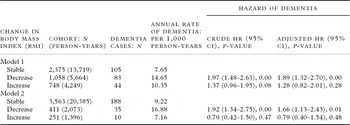
Table 2 demonstrates the association between changes in BMI and incident dementia. Those men who had a >1 unit decrease in BMI had a higher annual rate of dementia (14.6/1,000 person years) compared with those whose BMI remained stable (7.6/1,000 person years) or increased by >1 unit (10.3/1,000 person years). Those men who had a >1 unit decrease in BMI had a higher hazard of dementia than those who remained stable or whose BMI increased by >1 unit, and this remained statistically significant after adjusting for confounding factors (Table 2). When analyzed according to Model 2, the findings according to BMI change categories showed a similar significant trend (hazard of dementia for BMI decrease: crude HR = 1.92, 95% CI = 1.34–2.75; adjusted HR = 1.66, 95% CI = 1.13–2.43).
Association between changes in BMI and incident dementia

Note: Model 1: Stable BMI = gain or loss of ≤ 1 unit of BMI; Increase in BMI = gain of >1 unit of BMI; Decrease in BMI = loss of >1 unit of BMI. Model 2: Stable BMI = gain or loss of ≤ 2 units of BMI; Increase in BMI = gain of >2 units of BMI; Decrease in BMI = loss of >2 units of BMI. HR = hazard ratio; 95% CI = 95% confidence interval of the hazard ratio; Adjusted HR = hazard ratio adjusted for age, marital status, alcohol consumption, smoking, fat intake from milk, physical activity, prevalent diabetes, hypertension, social isolation (Duke Social Support Index), and stratified Charlson index.
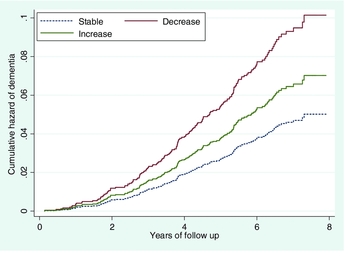
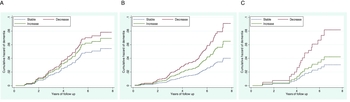
Figure 2 shows the cumulative hazard of dementia over follow-up according to change in BMI; those men who lost >1 unit of BMI over the follow-up period had the highest cumulative hazard of dementia compared with men whose BMI either increased by >1 unit of BMI, or remained stable. In addition, those men whose BMI remained stable had the lowest cumulative hazard. When analyzed according to BMI categories, similar trends emerged (Figure 3): cumulative hazard remained highest for men who had lost >1 unit of BMI, regardless of whether they were obese, overweight, or normal-underweight at initial adiposity screening in 1996–1998.
Cumulative hazard of dementia over follow-up according to five-year change of 1 unit in the BMI of elderly men.

Cumulative hazard of dementia over follow-up according to changes of 1 unit in the BMI of elderly men. Panel A shows hazard of dementia for BMI <25, Panel B for BMI 25–29.9, and Panel C for BMI ≥30.

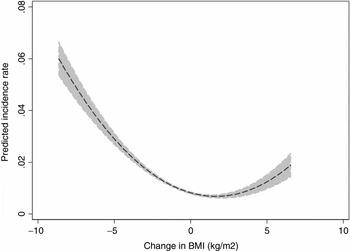
Figure 4 shows the association between change in BMI and the predicted incidence rate of dementia in elderly men. A reverse “J-shaped” association was seen, which indicated that the greater the decline in BMI the higher the predicted incidence of dementia. Men who fell within the range of no change in BMI to a small increase in BMI had the lowest risk of dementia.
Predicted incidence rate of dementia (dashed line) with confidence interval (shaded area) during follow-up according to changes in BMI (kg/m2) in elderly men.

Sensitivity analysis
After excluding those men who had died (n = 320) or had developed dementia (n = 71) during the first three years of follow-up, we repeated the analyses, and the results remained unchanged. Men who had >1 unit loss of BMI had a higher HR of dementia (Model 1: crude HR = 1.86, 95% CI = 1.31–2.63; adjusted HR = 1.86, 95% CI = 1.21–2.85).
Interaction analysis
There was no evidence that men in a particular BMI grouping (as measured in 1996–1998) had a higher risk of developing dementia according to their BMI change (Model 1: underweight/normal as the reference; overweight group HR = 0.96, 95% CI = 0.74–1.25, p = 0.75; obese group HR = 0.89, 95% CI = 0.66–1.20, p = 0.45).
Discussion
Findings
The results of our study show that changes in BMI are associated with risk of incident dementia in community-dwelling older men. Those men who had >1 kg/m2 decrease in BMI had the highest hazard of dementia over eight years of follow-up, and this remained significant after excluding men who died or were diagnosed with dementia during the first three years of follow-up. Further, we found that the cumulative hazard of dementia over follow-up for changes in BMI was greatest for men who lost >1 kg/m2, and least for those men whose BMI remained stable. This trend was seen for men in all BMI categories (underweight/normal, overweight, and obese). Finally, a reverse J-shaped association between BMI change and incident dementia was observed, with the lowest dementia rate being for those men whose BMI remained relatively stable.
Limitations of the study design
We have previously outlined some of the limitations of study design involving participants from the HIMS and adiposity markers (Power et al., Reference Power, Alfonso, Flicker, Hankey, Yeap and Almedia2011). These include: the study being limited to men only, such that we are constrained in extrapolating our findings to women; survivorship bias such that HIMS participants are healthier than men of their age living in the community; the uncertain validity of dementia diagnosis using record linkage such that we were unable to investigate adiposity change in relation to dementia typology; and the uncertain validity of self-reported nature of data on prevalent health conditions and lifestyle factors. An additional consideration in this study was that we had no self-reported data on diet and exercise from baseline questionnaires (2001–2004), and had to rely on data obtained at initial adiposity screening (1996–1998). It may well be that these lifestyle factors changed over this time period, and hence we cannot be entirely confident of their confounding effects on adiposity change in our study. However, we did control for the confounding effects of the Charlson index, which determines the presence and extent of significant medical comorbidity (Charlson et al., Reference Charlson, Pompei, Ales and MacKenzie1987). Hence, one could argue that any lifestyle factors (such as diet and exercise) that would lead to significant medical comorbidity were adequately accounted for, and further, the index is based on data obtained by the WADLS, thus providing a more reliable measure than self-report of medical comorbidity. As this study included only men with valid BMI at both time points, a further limitation is loss to follow-up; it is conceivable that men with weight loss did not attend follow-up due to poor health or frailty, in which case our results would likely underestimate the potential effect of weight loss on dementia outcome. This is supported by the findings that the 4,181 men who participated in the study appeared to be, on the whole, healthier in 1996 than the 4,376 men for whom follow-up data on BMI was not available (see Table S1).
Compared with stable weight, unintentional weight loss and weight fluctuations have long been associated with increased mortality in older men (Andres et al., Reference Andres, Muller and Sorkin1993; Lee and Paffenbarger, Reference Lee and Paffenbarger1996; Wannamethee et al., Reference Wannamethee, Shaper and Lennon2005), and hence differential survival among participants according to weight loss may also have confounded the association with dementia incidence in our study. We attempted to account for this by excluding from the analysis men who died during the initial three years of follow-up (n = 320); our results remained unchanged. Further, our group has previously demonstrated that survival in the HIMS cohort was longest for overweight men, hence we analyzed cumulative incidence according to BMI category and found a similar trend for men regardless of baseline BMI grouping. Previous authors have argued in favor of reverse causality, and that a loss of body mass is a phenotypic marker of incipient dementia in later life (Buchman et al., Reference Buchman, Wilson, Bieias, Shah, Evans and Bennett2005; Stewart et al., Reference Stewart2005; Johnson et al., Reference Johnson, Wilkins and Morris2006). We attempted to minimize the risk of reverse causality by excluding from the analysis men with a survival time lower than three years (either because they had died or had a dementia diagnosis); our results remained unchanged. Despite this, it is plausible that some men with incipient dementia at baseline received a dementia diagnosis after three years of follow-up, hence we cannot entirely dismiss reverse causality.
This study has a number of strengths that are worthy of mention. Firstly, this is the largest prospective epidemiological study investigating adiposity change and dementia in later life. Secondly, we controlled for the Charlson index in our analysis, hence we can be confident that accumulating medical comorbidities did not account for the effects that we observed in our sample. Finally, not only did we consider the effect of BMI change on incident dementia, but our analysis also considered BMI change according to BMI category at baseline, hence being able to ascertain whether BMI decrease from a BMI category was associated with a higher risk of developing dementia.
Interpretation of results
Our findings are consistent with those of recent prospective studies showing that persons with a decrease in adiposity markers over time have a higher risk of dementia (Barrett-Connor et al., Reference Barrett-Connor, Edelstein, Corey-Bloom and Wiederholt1996; Buchman et al., Reference Buchman, Wilson, Bieias, Shah, Evans and Bennett2005; Stewart et al., Reference Stewart2005; Luchsinger et al., Reference Luchsinger, Patel, Tang, Schupf and Mayeux2007; Atti et al., Reference Atti, Palmer, Volpato, Winblad, De Ronchi and Fratiglioni2008). However, unlike Atti et al. (Reference Atti, Palmer, Volpato, Winblad, De Ronchi and Fratiglioni2008) who reported that the association between BMI decrease and dementia risk was only evident in the first, and not the last three years of their follow-up, the effect that we observed on cumulative hazard of dementia became more obvious with the passage of time (Figure 2). Possible explanations for these discrepant findings is that Atti and colleagues had only a small number of men in their study at baseline (n = 330/1,255), and a likely smaller number for repeat adiposity measures (results not shown), as a total of only 646 participants had repeat adiposity measures; they also included participants from institutionalized settings, and as previously mentioned, our cohort was likely to reflect the effects of changing body mass in healthier men who were still living in the community.
The current findings suggest that BMI change in elderly men has prognostic significance with regard to their cognitive status, regardless of baseline BMI. The reverse J-shaped association between BMI change and incident dementia suggests that dementia incidence is lowest for those elderly men whose BMI remained relatively stable. If replicated, the current findings imply that the most appropriate public health message for elderly men with respect to dementia risk is to maintain a stable body mass.
There is ongoing debate about whether a decline in body mass represents a true risk factor for dementia (i.e. causality), whether it is a phenotypic marker of incipient dementia (i.e. reverse causality), or perhaps a marker of another process that increases dementia risk (e.g. hyperinsulinemia (Luchsinger et al., Reference Luchsinger, Patel, Tang, Schupf and Mayeux2007)). While numerous authors have argued for reverse causality (Buchman et al., Reference Buchman, Wilson, Bieias, Shah, Evans and Bennett2005; Stewart et al., Reference Stewart2005; Atti et al., Reference Atti, Palmer, Volpato, Winblad, De Ronchi and Fratiglioni2008), the findings of our study support the argument that the way in which the quantity and distribution of adipose tissue changes in healthy aging may exert upon the brain a protective effect, and that loss of adiposity predisposes the brain to degenerative processes (Harvey et al., Reference Harvey, Shanley, O'Malley and Irving2005). If this were the case, one would expect to see a lower hazard of dementia for overweight men who lost body mass (i.e. by virtue of their higher adiposity, they have more of a protective effect to lose). This is inferred from Figure 3C, in which cumulative hazard of dementia in the obese category was largest for those with decreasing body mass, relative to those who remained stable or increased body mass. In contrast, as seen in Figure 3A, men with a BMI of <25 whose body mass decreased had only marginally higher hazard of dementia than those who remained stable or gained body mass (i.e. by virtue of their low body mass, they have less of a protective effect to lose).
An alternative explanation for our findings is that, rather than being a specific risk factor for incident dementia, decreasing or changing body mass is a marker of frailty in old age, and is related to poor health outcomes in general (Buchman et al., Reference Buchman, Boyle, Wilson, Tang and Bennett2007; Reference Buchman, Wilson, Bienias and Bennett2009). These may involve subclinical pathologies, the cumulative effect of which predispose the individual to progressive cognitive impairment. A similar J-shaped association has been reported for changing adiposity markers and mortality in men in later life regardless of BMI category, with the nadir of risk at stable body mass (Harris et al., Reference Harris, Cook, Garrison, Higgins, Kannel and Goldman1988; Deeg et al., Reference Deeg, Miles, van Zonneveld and Curb1990; Lee and Paffenbarger, Reference Lee and Paffenbarger1992; Reference Lee and Paffenbarger1996). Further studies will be required not only to clarify the association between changing body mass in the elderly and dementia risk, but also to investigate the potential mechanisms by which changing body mass in later life may lead to poor health outcomes, such as dementia.
It is acknowledged that BMI alone might not be a good representation of body composition in later life, and changes may not reflect abdominal fat because of a concurrent decrease in muscle mass; hence, additional anthropometric measures would have been useful in this study. As such, alternative explanations for our findings should also be considered, such as inflammatory abnormalities that are common to both dementia and sarcopenia (Weaver et al., Reference Weaver2002; Krabbe et al., Reference Krabbe, Kanaya and Bruunsgaard2004; Yaffe et al., Reference Yaffe2004).
In conclusion, men who maintained a stable body mass had the lowest incidence of dementia. Further studies are needed to clarify causality and assess feasibility of interventional studies to preserve body mass in aging men.
Conflict of interest
None.
Description of authors’ roles
B. D. Power developed and designed the study concept, analyzed and interpreted the data, and drafted the paper; H. Alfonso analyzed and interpreted the data; L. Flicker and G. J. Hankey were responsible for acquisition of the data; B. B. Yeap along with all other authors provided advice in relation to the analyses of the data and interpretation of the results; and O. P. Almeida developed and designed the study concept, acquired the data, and drafted the paper. Almeida had full access to all the data in the study and takes responsibility for the integrity of the data and the accuracy of the data analysis. All authors critically revised the paper for important intellectual content.
Acknowledgments
The study was funded by the National Health and Medical Research Council of Australia (NHMRC) project grant numbers 279408, 379600, and 403963 to Hankey, Flicker, and Almeida, and project grant number DS 080608 from the MBF Foundation of Australia to Almeida. The investigators thank HIMS participants and research staff for their contribution.
Supplementary material
Supplementary material includes Table S1 showing demographic data of 4,181 participants in 1996 who had available data on follow-up BMI, compared to 4,376 participants who did not have available follow-up data.