Introduction
The period between 4200 and 3700 BP was a time of transition in Chinese prehistory. Archaeological research has established a long-term trend during these centuries towards agricultural diversification and intensification of the extant pig-, dog- and millet-based subsistence systems through the introduction of such West Asian elements as wheat, cattle, sheep and goat. These subsistence regimes were thus transformed, laying the foundations for later developments in north Chinese agriculture. An extensive corpus of secondary literature also points, however, towards climatic deterioration in different parts of China during this same period (4200–3700 BP). Interpretations of the proxies relating to this climatic event and the links to human responses remain controversial. It is nonetheless apparent that many Late Neolithic or Chalcolithic material culture traditions across China had declined by the end of this period, while in the Central Plains region, an increasingly complex and diversified agricultural economy provided the basis for the emergence of China's first Bronze Age dynasties. As part of the Chinese government-sponsored ‘Origins of Chinese Civilization’ project, zooarchaeological, archaeobotanical and isotopic analyses were performed at five large sites in the Central Plains, spanning the period from 5500–3500 BP, to investigate the organisation and transformation of subsistence systems across the Neolithic to Bronze Age transition.
Background: the Neolithic to Bronze Age transition
The period from 5500–3500 BP can be divided into three parts: the time before the Neolithic to Bronze Age transition (5500–4200 BP), the period of transition (c. 4200–3800 BP) and the period following (3800–3500 BP). Prior to the transition period, the fifth millennium BP was characterised by increasing socio-political complexity in many regions of China. During the transition period, many of those regional traditions underwent profound changes. In the lower Yangzi River area, for example, the Liangzhu Culture appears to have ended at around 4000 BP, along with the walled 290ha Mojiaoshan site cluster with its elite cemeteries, jade workshops, platforms and surrounding 34km2 settlement system (Liu et al. Reference Liu, Wang, Chen, Wu, Mo, Liu, Xu and Zhuang2018). The broadly contemporaneous middle Yangzi Shijiahe Culture (4600–4000 BP) suffered population decline, and the subsequent abandonment of its main centre, the 8km2 Shijiahe site cluster (Zhang Reference Zhang and Underhill2013). At the lower reaches of the Yellow River and along China's east coast, the Shandong Longshan Culture was replaced with the much less ubiquitous (in terms of population density and area of coverage) Yueshi Culture at around 3900 BP, with major Longshan centres of the Rizhao survey area, such as Liangchengzhen (270ha) and Yaowangcheng (365ha) going into terminal decline (Underhill et al. Reference Underhill, Feinman, Nicholas, Fang, Luan, Yu and Cai2008). The recently discovered 400ha stone-walled site of Shimao, located in the bend of the Yellow River on the edge of the Ordos Desert, dates to 4300–3800 BP, almost precisely spanning the transition period (Sun et al. Reference Sun, Shao, Liu, Cui, Bonomo, Guo, Wu and Wang2017). The 300ha centre of Taosi, in the Fen River Valley of Shanxi Province, dates to 4300–3900 BP—declining just a century earlier than Shimao (He Reference He and Underhill2013).
Some scholars have attempted to attribute these cultural collapses to the deteriorating climatic conditions during the 4.2/4.0k BP event (e.g. Liu & Feng Reference Liu and Feng2012; Wagner et al. Reference Wagner, Tarasov, Hosner, Fleck, Ehrich, Chen and Leipe2013; Wang et al. Reference Wang, Sun, Chen, Xu, Wang and Wang2016). The diverse chronologies, uneven archaeological research and differing outcomes in each region, however, suggest a far more complex scenario. Nevertheless, prior to 4200 BP, China was home to a number of flourishing regional traditions, central places and stratified societies. By 3500 BP, a very different picture had emerged, with only a few major Bronze Age traditions remaining. Of these, the Central Plains Metropolitan Tradition (Campbell Reference Campbell2014) was by far the most expansive, and, as the source of China's first historical dynasties, its influence the most enduring.
To whatever complex interrelation of factors the developments in the various regions of China between 4200 and 3700 BP can be attributed, two are of key importance for our study of Central Plains agricultural systems. The first is the 4.2/4.0k BP event that has been implicated in the decline and collapse of complex societies in China (e.g. An et al. Reference An, Tang, Barton and Chen2005; Liu & Feng Reference Liu and Feng2012; Wang et al. Reference Wang, Sun, Chen, Xu, Wang and Wang2016) and, indeed, in other regions of the world (e.g. Dalfes et al. Reference Dalfes, Kukla and Weiss1997). Although lacking in reliable, high-resolution local climate proxies for the Central Plains, the 4.2/4.0k BP event is believed to have initiated a period of climatic instability and a general cooling, drying trend (e.g. Rousseau et al. Reference Rousseau, Zanchetta, Weiss, Bini and Bradley2019). While it is currently unclear what role climate change may have played in the adoption of new domesticates, or the degree to which agricultural diversification might have ameliorated those effects, for the Central Plains, the Neolithic to Bronze Age transition was a period of development rather than decline.
The second key issue of the transition period is the intensified interaction with a wider Eurasian exchange and several important introductions comprising wheat, barley, domestic sheep, goat, cattle and bronze metallurgy (Yuan & Campbell Reference Yuan and Campbell2009; Li Reference Li2015). These domesticates and technologies had profound impacts on the development of Bronze Age political economies in China. Despite its fundamental importance, however, the story of food production and its development in different regions of China is only beginning to be told. As both the economic foundation of complex societies and a crucial link between climate change and human response, agricultural systems and their changes are key to understanding Chinese prehistory. More specifically, while the impact of bronze on agriculture is unclear and possibly slight (Trigger Reference Trigger2003), the same cannot be said of the other West Asian introductions. Although barley did not play an important role in the Central Plains, and wheat was rare during the transition period and Early Bronze Age (Long et al. Reference Long, Leipe, Jin, Wagner, Guo, Schroder and Tarasov2018), the latter went on to become a key crop in north Chinese multi-cropping systems by the end of the first millennium BC (Bray Reference Bray1984). The introduction of cattle, sheep and goat had a more immediate impact. More than just an additional source of meat, these animals also provided secondary products, such as wool, milk and traction. They complemented, rather than competed with, pigs and dogs for feed and forage, and, as wealth on the hoof, afforded new opportunities for the mobilisation and concentration of resources. In addition, the integration of grass-eating cattle, sheep and goats into mixed farming systems potentially affected field rotation, while broadening the agricultural catchment to include more marginal lands and hillsides (Flannery Reference Flannery1965). Rice, introduced from the Yangzi area, and soy, were also incorporated into Central Plains agricultural regimes during the transition period. While rice could complement millet farming in that it is better suited to wet soils, soy could both serve as a nitrogen fixer and a source of protein. These domesticates and their incorporation into increasingly complex and diversified agricultural systems provided the economic basis of China's historical dynasties, and remained largely unchanged until the Columbian exchange introduced New World crops in the sixteenth century AD (Bray Reference Bray1984).
Methodology
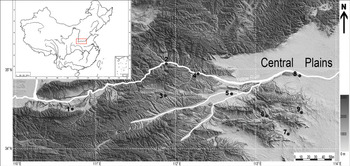
The sites presented here are Xipo, Wadian, Wangchenggang, Xinzhai and Erlitou. Located in a core area (in terms of later political development) of the Central Plains (Figure 1), they date to between 5500 and 3500 BP. The research formed part of the ongoing, and geographically much broader, Chinese government initiative the ‘Origins of Chinese Civilization’ project, phase two of which focused on the technological and economic development of Chinese civilisation (Kejibu Shehui Fazhan Kejisi & Zhongguo Wenwuju Bowuguan yu Shehui Wenwusi Reference She and wen wu ju2009).
Major sites featured in this study: 1) Xipo; 2) Bancun; 3) Duzhong; 4) Zhouli; 5) Erlitou; 6) Wangchenggang; 7) Wadian; 8) Xishan; 9) Xinzhai (figure by Y. Jing & R. Campbell).

The sites were all large (40–300 ha), excavated by different teams following a variety of sampling strategies and analysed by different specialists. This presents challenges for comparison of the results, and the small-scale and preliminary analyses undertaken at each site afford only initial impressions. Furthermore, the hand-recovery of zooarchaeological assemblages from these sites under-represents fish, bird and small mammal remains. Nevertheless, comparison of the initial results from these five sites allows us to observe some trends and pose new questions. The combination of zooarchaeological, archaeobotanical and isotopic analyses, moreover, provides a perspective greater than the sum of its parts.
Agricultural systems before the transition (5500–4200 BP)
Xipo
Xipo was a 40ha regional centre in western Henan (Figure 1) dating to the Miaodigou phase of the Yangshao period (6000–5500 BP). An associated cemetery was dated to c. 5300–4900 BP and represents a continuation of the same cultural traditions found at the site. Xipo was built around large central buildings and featured residences and sub-surface graves of different sizes (Zhongguo Shehuikexueyuan Kaogu Yanjiusuo & Henan Sheng Wenwu Kaogu Yanjiusuo 2010). Xipo is considered to represent the beginnings of social complexity and hierarchy and/or, economic individualisation, stratification and integration (Liu & Chen Reference Liu and Chen2012: 193; Peterson & Shelach Reference Peterson and Shelach2012).
Zooarchaeology
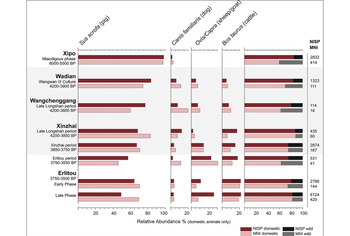
Excavated over six seasons between 2000 and 2006, Xipo has yielded 15 452 animal bone fragments from three houses, 51 ashy deposits and two ponds. Only 2832 fragments (70 per cent of the assemblage by weight) could be identified to species or genera. Over 85 per cent of the mammalian assemblage was domestic based on number of identified specimens (NISP), and over 60 per cent based on minimum number of individuals (MNI) (see Figure 2 and the online supplementary material (OSM) Table S1). Of the wild taxa, less than three per cent by NISP were large mammals, indicating that the Xipo inhabitants predominantly raised pigs (Sus scrofa) and dogs (Canis familiaris), and supplemented this diet through limited hunting of deer (Cervus nippon, Elaphurus davidianus, Hydropotes inermis) and other small game.
Summary of the zooarchaeological data: relative abundances of domestic animals are calculated on the basis of the minimum number of identified species (NISP) and the minimum number of individuals (MNI). The sum indicates the total NISP and MNI, including domesticated and non-domesticated animals (for details, see Table S1 in the online supplementary material (figure by L. Castellano).

Archaeobotany
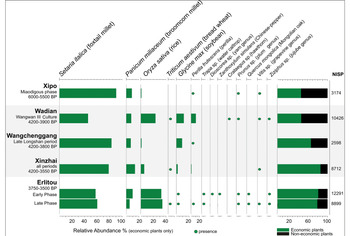
A total of 48 soil samples were taken at Xipo and 239 litres were floated, averaging around five litres per soil sample. Flotation yielded more than 3000 carbonised seeds (Lee et al. Reference Lee, Crawford, Liu and Chen2007). Of these, 1485 seeds (46.2 per cent) were domesticates, including millets and rice (see Figure 3 & Table S2). Millets (Setaria italica, Panicum miliaceum) comprised 99.4 per cent of the crop species, while the non-domesticates were dominated by C4 weeds and grasses associated with farming, such as crabgrass (Digitaria sanguinalis) (Lee et al. Reference Lee, Crawford, Liu and Chen2007).
Summary of the archaeobotanical data: only economic plants and their relative abundances (%) are reported. The sum indicates the total number of specimens analysed, including economic and non-economic seeds (for details, see Table S2 in the online supplementary material (figure by L. Castellano).

Isotope analyses
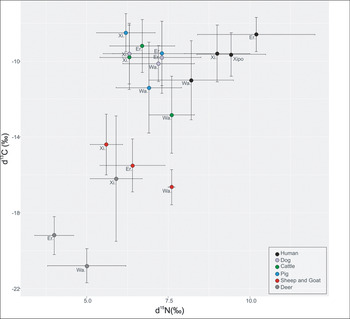
Carbon stable isotope analysis was undertaken on samples taken from pigs, dogs and humans, while nitrogen stable isotope analysis was only performed on human samples (Figure 4 & Table S3) (Zhang et al. Reference Zhang, Qiu, Zhong, Zhao, Sun, Cheng, Guo, Li and Ma2010). Analyses of human samples indicate that local diet consisted largely of C4 plants, such as millets and animals that ate C4 plants. Nitrogen isotope data also suggest that the humans had omnivorous diets. As the pig and dog δ13C ratios were similar to those of the humans, we hypothesise that these animals ate the by-products of millet processing, along with kitchen scraps and waste (Pechenkina et al. Reference Pechenkina, Ambrose, Ma and Benfer2005).
Synthetic plot of the carbon (δ13C) and nitrogen (δ15N) isotope data from Xipo, Wadian (Wa.), Xinzhai (Xi.) and Erlitou (Er.); mean values and standard deviations are reported (for details, see Table S3 in the online supplementary material) (figure by L. Castellano).

Summary
Xipo is characterised by a classic north China Neolithic pig, dog and millet agricultural system, supplemented with some hunting. The Miaodigou II (c. 4900–4400 BP) site of Bancun in Mianchi also shows evidence of this agricultural regime, with 95 per cent of the domestic animals being pigs (and 69 per cent of the zooarchaeological assemblage domestic) (Kong et al. Reference Kong, Liu and Zhang1999; Yuan Reference Yuan1999). These patterns are also seen at sites such as Zhouli in Luoyang (c. 5000 BP), Duzhong in Mianchi (c. 5000 BP) and Xishan III in Zhengzhou (c. 5000–4800 BP) (Yuan Reference Yuan2015: 137–42).
The transition period (4200–3800 BP)
Wadian
The Wangwan III Culture (c. 4200–3900 BP) site of Wadian is located in Yu Xian, Henan Province. A regional centre 100ha in area, Wadian was the largest site in the southern Central Plains during this period (Peking University school of Archaeology and Museology & Henan Institute of Cultural Relics and Archaeology 2007) (Figure 1).
Zooarchaeology
The zooarchaeological remains from Wadian were fragmentary and less than 45 per cent of the total of 4829 bone fragments can be identified to taxon. Almost 84 per cent of the identified mammalian bone fragments were domestic animals (NISP; over 70 per cent by MNI) (Figure 2 & Table S1). Pigs dominate this assemblage, although cattle and sheep are also represented. As at Xipo, the inhabitants also hunted deer and small game.
Archaeobotany
A total of 149 soil samples were collected and 3715 litres floated, averaging 25 litres per sample. The 139 Wangwan III period samples were taken from the moat (39), foundations (8), stratigraphic layers (15), ash pits (70), a hearth (1), house floors (2) and ash trenches (4). Remarkably, only 37.8 per cent of the recovered carbonised seeds are domesticates; most of the non-crop seeds being weed species associated with soils disturbed by past human subsistence practices (Table S2). The hearth sample yielded little charcoal, but a large quantity of charred seeds, suggesting the use of weeds (Liu & Fang Reference Liu and Fang2010) or sheep and cattle dung as fuel (Miller Reference Miller1984; Crawford et al. Reference Crawford, Underhill, Zhao, Lee, Feinman, Nicholas, Luan, Yu, Fang and Cai2005; Lee et al. Reference Lee, Crawford, Liu and Chen2007). Most of these weeds are also C4 plants. While foxtail millet (Setaria italica) was still the predominant crop at Wadian, rice (Oryza sativa), soybeans (Glycine max) and perilla (Perilla frutescens) were all components of a diverse assemblage (Figure 3).
Isotope analyses
Carbon and nitrogen isotope analyses were performed on samples obtained from human and domestic and wild animal remains (Figure 4 & Table S3). As at Xipo, the mean carbon isotope values for the humans, pigs and dogs cluster together, suggesting a predominantly C4 diet, along with some C3 intake. The latter is unsurprising, given the quantities of charred rice remains (C3) recovered, especially if, as is assumed, dogs and pigs ate food scraps and refuse. The relatively large standard deviation for both the humans and pigs, however, suggests a degree of dietary variability, with some individuals eating more C3 foods, such as rice or wild game. Deer browsing on wild—mostly C3—vegetation have the lowest average δ13C values; cattle resemble the mostly C4-eating human/pig/dog cluster. Although only a small sample, the sheep ate both C4 and C3 plants, demonstrating that the Wadian ovi-caprid diet differed from that of the cattle.
Wangchenggang
As with Wadian, Wangchenggang (Figure 1) was a regional centre occupied between c. 4200 and 3800 BP, with a 35–40ha walled enclosure and evidence for craft production and elite material culture (Peking University school of Archaeology and Museology & Henan Institute of Cultural Relics and Archaeology 2007). Some scholars argue that Wadian and Wangchenggang were competing centres (Liu & Chen Reference Liu and Chen2012: 222), while others interpret both sites as potentially relating to the early history of the Xia Dynasty (Fang & Han Reference Fang and Han2001; Peking University school of Archaeology and Museology & Henan Institute of Cultural Relics and Archaeology 2007). Wangchenggang has yielded material cultural remains from the Erlitou (c. 3800–3500 BP), as well as later periods.
Zooarchaeology
The Wangchenggang faunal assemblage consists of 7428 fragments, 1461 of which are too fragmentary to identify to species or even genera. Only 114 mammal bone fragments are dated to the Late Longshan (4200–3800 BP), while 17 relate to the Erlitou; the remainder date to later periods. The Longshan-period assemblage demonstrates that ovi-caprids and cattle were being raised at the site (Figure 2 & Table S1).
Archaeobotany
A total of 168 ten-litre soil samples were taken at Wangchenggang, with samples yielding 7616 carbonised seeds, averaging 45 seeds per sample. Fifty-nine samples relate to Late Longshan-period layers, and come from the moat (38), the wall (3), stratigraphic layers (7) and ashy deposits (11). These produced 0.026g of charcoal per litre. Compared with Wadian, a much higher percentage (67 per cent) of the carbonised seeds derive from crops. The non-crops are predominantly C4 weeds associated with millet farming. The difference between the Wangchenggang and Wadian crop-to-weed ratios may simply relate to ‘ad hoc’ sampling (Crawford et al. Reference Crawford, Underhill, Zhao, Lee, Feinman, Nicholas, Luan, Yu, Fang and Cai2005). With this caveat in mind, the Late Longshan crop assemblage from Wangchenggang appears to be dominated by foxtail millet, with some broomcorn and soy, almost no rice, and no wheat (Figure 3 & Table S2). Although isotopic research at Wangchenggang is ongoing, preliminary results suggest similar isotopic patterns to those of the pigs and cattle at Wadian.
Xinzhai
The site of Xinzhai was an important (100ha) regional centre at its zenith during the Xinzhai phase (3850–3750 BP), but had Late Longshan (c. 4200–3850 BP) and Erlitou (c. 3750–3550 BP) occupations (Beijing Daxue Zhendan Gudai Wenming Yanjiu Zhongxin 2008)—the latter spanning the Neolithic to Bronze Age transition. A 70ha rammed-earth wall surrounded the central part of the site, while the presence of large structures and copper and jade artefacts all attest to the extraordinary nature of the Xinzhai settlement.
Zooarchaeology
Identifiable faunal remains dating from the Late Longshan through Erlitou periods include 3840 mammalian bone fragments. Two trends can be observed on Figure 2 (Table S1). The first is the relative decrease in domestic animals: 88 per cent by NISP in phase I, 76 per cent by NISP in phase II, and 76 per cent by NISP in phase III. The second is the increase in sheep and decrease in pigs. The rise in wild animals is due to an increase in deer remains between the Late Longshan and Xinzhai periods. This may relate to the changing status of the site and is perhaps an early manifestation of the hunting practices characteristic of later Central Plains elites (Fiskesjö Reference Fiskesjö2001; Campbell Reference Campbell2018). The increase in sheep at the expense of pigs, however, indicates the diversification of animal economies including, perhaps, the exploitation of secondary products (Dai et al. Reference Dai, Li, Hu, Zhao and Wang2014, Reference Dai, Li, Zhao, Yuan, Hou, Wang, Fuller and Hu2016).
Archaeobotany
A total of 109 soil samples were taken and 1197 litres floated, averaging 10 litres per sample. One-hundred and eight of the samples were taken from ashy deposits, and one was taken from a kiln. A large proportion (85.3 per cent) of the Xinzhai carbonised seeds were from domestic crops, with relatively few field weeds present in comparison to Wadian or even Wangchenggang, despite the amount of charcoal at Xinzhai being similar to those latter sites (Figure 3 & Table S2). This may be related to the different sampling strategies at each site. Foxtail millet dominates the crop assemblage, with smaller quantities of broomcorn millet, rice, soy and perilla, and single seeds of wheat and grape.
Isotope analyses
Carbon and nitrogen isotope analyses were performed on samples taken from eight humans, eleven pigs, three dogs, eleven cattle, eight sheep and four deer (Figure 4 & Table S3). As with the other sites, human, pig and dog carbon isotopes cluster together, suggesting that their diets were primarily C4-based. While it is surprising that herbivorous cattle also cluster with pigs and dogs, this does reinforce the pattern seen at the other sites. The deer provide a baseline for wild plant browsing (mostly C3), while the sheep show evidence for both C3 and C4 foods. The nitrogen isotopes show that the dogs ate a predominantly vegetarian diet, while the humans ate both plant and animal foods.
Post-transition/Early Bronze Age (c. 3800–3500 BP)
Erlitou
Over the course of its occupation, the site of Erlitou (c. 3750–3500 BP) grew to 300ha. Erlitou was situated at the heart of a regional settlement system and had a sphere of influence of unprecedented extent (Xu Reference Xu and Underhill2013; Campbell Reference Campbell2014). It was also the fountainhead of the Chinese Bronze Age or, more precisely, the Central Plains Metropolitan Tradition (Campbell Reference Campbell2014)—the period and place in which the first of the ritual bronze vessels that would characterise north Chinese elite culture for over a millennium were cast. Most Chinese archaeologists also consider Erlitou to have been a capital of China's first dynasty, the Xia. The analyses below all relate to materials recovered during the 1999–2006 excavations, which focused on elite areas of the site (Zhongguo Shehuikexueyuan Kaogu Yanjiusuo 2014).
Zooarchaeology
In total, 39 429 fragments were recovered from excavations at Erlitou. 17 313 were identified to genera or species, of which 8890 were mammal bone fragments dating to the Erlitou period. While the mammalian assemblage is overwhelmingly domestic—averaging 82 per cent over the Erlitou period—the presence of large, dangerous game, such as tigers, rhinoceros and water buffalo suggests the practice of elite hunting known from later Central Plains Bronze Age sites (Figure 2 & Table S1). That the assemblage was recovered from elite contexts also means that it is not necessarily representative of Erlitou as a whole. Nevertheless, in terms of overall patterns, the same relative decline in the importance of pigs as seen at Xinzhai can be also seen at Erlitou, although in the case of these elite Erlitou contexts, it is cattle, rather than sheep, that increase steadily (at least by NISP). Mortality profiles constructed for the Erlitou sheep suggest a component of wool production (Li et al. Reference Li, Campbell, Brunson, Yang, Tao and Greenfield2014), while the presence of cart tracks indicates the use of animals for traction.
Archaeobotany
A total of 157 samples were taken—137 from Erlitou-period deposits, of which 2272.5 litres were floated, averaging 14 litres per sample. The samples can be divided into those taken from early (I–II) and late (III–IV) phase contexts. The early samples were taken from stratigraphic layers (7), ash pits (41), ash trenches (10), building foundations (1), tombs (3) and other contexts (1). The late phase contexts were stratigraphic layers (14), ash pits (49), ash trenches (1), building foundations (1), tombs (1) and other types (7) (Zhao Reference Zhao and Kaoguo Yanjiusuo2014). The Erlitou samples averaged 0.031g/L of charcoal over all periods. The charred seed assemblage is dominated by economic plants (Figure 3), the non-domestic seed remains being mostly grasses. Foxtail millet is the most abundant crop type, followed by rice, broomcorn millet, small quantities of soy and a few wheat seeds, in addition to a variety of fruits and nuts (Figure 3 & Table S2).
Isotope analyses
Carbon and nitrogen stable isotope analyses were performed on samples taken from 20 humans, 19 pigs, 5 dogs, 15 cattle, 17 sheep and 13 deer (Figure 4 & Table S3). As at Xinzhai, the isotope values of the Erlitou pigs, dogs and cattle cluster together. Surprisingly, given the large quantities of carbonised rice seeds and wild game bone recovered, the humans had the strongest C4 signatures, while also having the most nitrogen-enriched diets, reflecting meat consumption. The cattle diet was C4 plant based, while the sheep ate a much larger component of C3 plants. The deer ate mostly wild plants, showing an even stronger C3 signature and lower nitrogen values. The relatively elevated nitrogen isotope levels shown by domestic herbivores at Erlitou possibly relate to manuring, which can add raise the nitrogen values of crops (Szpak Reference Szpak2014).
Discussion
Between 4300 and 3800 BP, the previous north China Neolithic pig- and millet-based subsistence model underwent change in the Central Plains. At the sites of Wadian, Wangchenggang and Xinzhai, ovi-caprines and cattle were introduced (Figure 2). Carbonised seed assemblages also demonstrate the diversification of crops, with soy and rice becoming significant dietary staples (Figure 3). While the isotopic results show dogs and pigs clustering with cattle as mainly C4-eaters, a comparison of sheep and cattle isotopes demonstrates different husbandry practices (Figure 4). Although the sheep clearly grazed on C3 plants, their δ13C values are higher than deer, suggesting that they were either also grazing on the abundant C4 weeds in fallow fields or they were additionally foddered with C4 plants, such as millet hay and collected weeds. The predominantly C4 plant diet of the cattle suggests that they may have been integrated into a field-rotation system, within which they grazed on C4 weeds in fallow fields and were foddered on millet hay. This is significant because while pig- and millet-based systems would have been able to use fallow fields for pig foraging and fuel collection, cattle and sheep are able to more efficiently turn field weeds and wild grasses into primary (e.g. meat and hides) and secondary (e.g. wool, milk, traction, fertilizer and dung-fuel) products.
At Erlitou (c. 3750–3500 BP), the agricultural regimes first evidenced at the beginning of the Neolithic to Bronze Age transition were further developed. Thus, sheep and cattle accounted for over a quarter of the zooarchaeological assemblage (by NISP) in the early phases of the site, rising to over 42 per cent by phase IV, collectively surpassing pigs. This is a trend that continued throughout the Central Plains Bronze Age, with cattle surpassing pigs by NISP at some Yinxu-period (3250–3050 BP) sites (Li et al. Reference Li, Campbell, Brunson, Yang, Tao and Greenfield2014). There is also evidence for secondary products at Erlitou, for example wool production, and the presence of wheel ruts suggesting the use of animals for traction (Xu Reference Xu and Underhill2013; Li et al. Reference Li, Campbell, Brunson, Yang, Tao and Greenfield2014). The archaeobotanical trend towards increased crop diversification can also be seen at Erlitou, with rice, soy and wheat all present in addition to the millets. Isotopic analysis shows that the trend towards a clear separation in sheep and cattle husbandry became even more marked at Erlitou, with cattle clustering with pigs and dogs by δ13C ratios, but with sheep in terms of δ15N ratios.
Beyond simply providing diversified sources of protein, the addition of sheep and cattle in the Central Plains would have affected the entire agricultural regime—possibly in revolutionary ways. Although it has been claimed that traditional Chinese agriculture, unlike in Europe, did not have an animal-based crop-rotation system (Bray Reference Bray1984), the situation prior to the Han Dynasty (208 BC–AD 220) is far from clear. It may well be that as well as transforming the ritual system (Yuan & Flad Reference Yuan and Flad2005), opening up new resources for exploitation and providing novel secondary products, the addition of sheep and cattle increased the productivity of north Chinese agriculture through a new system of land-use and field rotation.
The introduction of new crops diversified agricultural practices and resources, as well as the opportunities for field rotation between foxtail millet, broomcorn millet, wheat, soy and rice. This potentially increased yields while diversifying risk. The different soil and water requirements of the various crops also meant that more habitats could be exploited more effectively. Although the multi-cropping potential of winter wheat followed by a millet crop was not fully realised in north China until, perhaps, as late as the Han Dynasty (Bray Reference Bray1984), the five staple crops of traditional Chinese agriculture were all being grown in the Central Plains at the outset of the Neolithic to Bronze Age transition.
Taken together, the trend in the Central Plains, from before to after the transition, was towards increasing environmental exploitation, and agricultural diversification and intensification. Although further work is required to gain a more detailed understanding of the development of agricultural practices, such as field-rotation systems, manuring, and grain-processing, it is clear that the climatic perturbations around 4200/4000 BP did not cause the societies of the Central Plains to collapse. Instead, continued agricultural development and diversification laid the foundations for the great polities of the Central Plains Bronze Age.
If productive and stable agricultural systems are a necessary condition for early complex polities, then scholars seeking to link past climate change to population declines or the collapse of civilisations would be well advised to study more closely the archaeology of food production. While efforts are underway to study human diet in regions beyond the Central Plains, much work remains to be done in investigating agriculture systematically, and combining the results of archaeometric approaches synthetically. Incorporating starch (Qin et al. Reference Qin, Storozum, Zhao, Liu, Fu and Kidder2019) and phytolith (Song et al. Reference Song, Wang and Fuller2017) analyses into a holistic archaeobotanical reconstruction, for example, would provide a more complete picture of plant-derived food processing and use, while systematic sampling strategies are necessary for a more nuanced picture of plant- and animal-use practices (Crawford et al. Reference Crawford, Underhill, Zhao, Lee, Feinman, Nicholas, Luan, Yu, Fang and Cai2005). Analysis of soil formation could yield information about field preparation and manuring, as well as flooding events or environmental degradation (Zhuang & Kidder Reference Zhuang and Kidder2014). The systematic incorporation of charcoal analysis would allow for a better understanding of fuel sources and the local environmental context. These are just a few of the possible approaches that should be incorporated into a holistic study of ancient Chinese agricultural economies. It is only through considering plants, animals, humans and environment as intertwined components of agricultural systems that we will understand the capacities and vulnerabilities of those systems.
Supplementary material
To view supplementary material for this article, please visit https://doi.org/10.15184/aqy.2020.80.