INTRODUCTION
The development of sources of renewable energy to replace fossil fuels and thus reduce emissions of greenhouse gases is highly desirable (Smeets et al. Reference Smeets, Faaij, Lewandowski and Turkenburg2007). Jerusalem artichoke (Helianthus tuberosus L.) is an important bioenergy crop (Tian et al. Reference Tian, Zhao, Meng, Sun and Yan2009; Berndes et al. Reference Berndes, Hansson, Egeskog and Johnsson2010; Li et al. Reference Li, Hou, Su, Yang, Shen, Jiang, Qi, Chen and Liu2010), firstly because it produces large quantities of biomass. The average fresh tuber biomass is estimated to be 45–90 t/ha (Zhuang et al. Reference Zhuang, Jiang, Liu and Huang2011), which compares favourably with most major crops (Kays & Nottingham Reference Kays and Nottingham2008). Secondly, tubers can be converted easily into biofuels (Chekroun et al. Reference Chekroun, Amzile, el Yachioui, el Haloui and Prevost1994; Molis et al. Reference Molis, Flourié, Ouarne, Gailing, Lartigue, Guibert, Bornet and Galmiche1996; Li & Catherine Reference Li and Catherine2009), and both the costs and carbon footprint associated with production of biofuels from this plant are much lower than those of other plant species (Bartolelli et al. Reference Bartolelli, Mutinati, Pisani, Grassi, Collins and Zibetta1991; Szambelan et al. Reference Szambelan, Nowak and Chrapkowska2004; Hill et al. Reference Hill, Nelson, Tilman, Polasky and Tiffany2006). Thirdly, this plant is capable of growing on low-quality land with relatively limited water and fertilizer inputs (Zhuang et al. Reference Zhuang, Jiang, Liu and Huang2011), thus reducing competition with food crops for land and irrigation resources. In addition, the species can be used as a food crop and is grown as a vegetable providing a source of protein (Rakhimov et al. Reference Rakhimov, Arifkhodzhaev, Mezhlumyan, Yuldashev, Rozikova, Aikhodzhaeva and Vakil2003), vitamins (Rashchenko Reference Rashchenko1959), fructo-oligosaccharides (Malmberg & Theander Reference Malmberg and Theander1986; Slimestad et al. Reference Slimestad, Seljaasen, Meijer and Skar2010) and minerals (Rashchenko Reference Rashchenko1959; Hay & Offer Reference Hay and Offer1992).
Despite its importance in bioenergy production, the breeding germplasms of H. tuberosus and their genetic diversity and differentiation have received little attention. Traditional cultivation relies mainly on planting the tubers, which can be planted directly after harvesting. Because of long-term clonal cultivation, sexual reproduction and hybrid breeding are rare for H. tuberosus L., which is a hexaploid species (2n=102) (Kostoff Reference Kostoff1939). Therefore, the primary breeding method has been restricted to selection of natural variants with high yield and high quality (van Soest et al. Reference Van Soest, Mastebroek and De Meijer1992; de Mastro et al. Reference De Mastro, Manolio and Marzi2004). For disease and pest resistance, the species has shown excellent performance (Cassells & Walsh Reference Cassells and Walsh1995; van Damme et al. Reference Van Damme, Barre, Mazard, Verhaert, Horman, Debray, Rouge and Peumans1999), especially with respect to breeding of the cultivated sunflower (Helianthus annuus L.) (Atlagić et al. Reference Atlagić, Dozet and Škorić1993; Encheva et al. Reference Encheva, Christov and Ivanov2003).
Helianthus tuberosus originated in North America and was domesticated around 400 years ago (Heiser Reference Heiser and Carter1978; Schilling & Heiser Reference Schilling and Heiser1981). However, cultivation on a large scale in North America has been sparse until now; however, interest in the crop as a feedstock for bioethanol has been promoted recently. It has been more widely grown in Europe, particularly during the food shortages during and after World War II, and was introduced subsequently into Asia and cultivated as a vegetable. To date, more than 20 cultivars have been produced through artificial selection of cultivated mutations in Europe and Asia (Kays & Nottingham Reference Kays and Nottingham2008). These cultivars vary greatly in their tuber colour and size, flowering stage and plant height (Pas'ko Reference Pas'ko1973). The available accessions have been collected as most cultivated germplasm is located in Europe and East Asia. However, the ways in which these lines/cultivars differ from each other and whether there are differences between those collected or cultivated in Europe and those from East Asia remain unknown. Many studies regarding genetic diversity have been based mainly on phenotypic traits of the accessions of H. tuberosus L., which are cultivated in Europe and North America (Diederichsen Reference Diederichsen2010; Serieys et al. Reference Serieys, Souyris, Gil, Poinso and Bervillé2010; Slimestad et al. Reference Slimestad, Seljaasen, Meijer and Skar2010; Puttha et al. Reference Puttha, Jogloy, Suriharn, Wangsomnuk, Kesmala and Patanothai2013). Only a handful of studies on this topic have been based on molecular markers, such as random amplified polymorphism DNA (RAPD), inter-simple sequence repeats (ISSR) and sequence-related amplified polymorphisms (SRAP) (Wangsomnuk et al. Reference Wangsomnuk, Khampa, Jogloy, Srivong, Patanothai and Fu2011a, Reference Wangsomnuk, Khampa, Wangsomnuk, Jogloy, Mornkham, Ruttawat, Patanothai and Fub). The present study was conducted to assess the germplasm diversity of H. tuberosus L. and the regional differentiation between European and East Asian accessions with respect to phenotypic traits, chemical constitution and genetic variation. Of particular interest was whether the genetic groups identified by amplified fragment length polymorphisms (AFLPs) also differ with respect to morphology and chemistry. These results will provide evidence upon which to base germplasm management and breeding programmes in the future.
MATERIALS AND METHODS
Plant material and experimental design
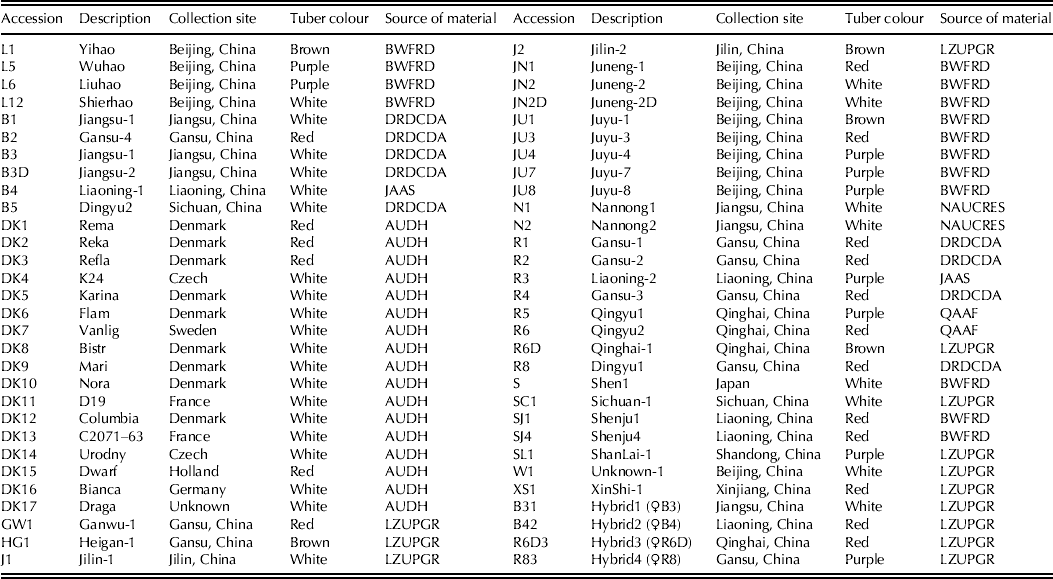
A total of 60 accessions of H. tuberosus L. were used in the present study (Table 1): 17 accessions were obtained from Europe and 43 (including four recent hybrid cultivars) from East Asia. These accessions represent the most cultivated varieties in Europe and East Asia. Tuber colour for all accessions could be classified into four types: white, red, purple and brown. All accessions were planted in a ‘common garden’, with a single habitat and loess soil, on Plant Germplasm Repository, Lanzhou University, Gansu, China (35°56′N, 104°09′E, 1746 m a.s.l.) in 2011. Sixty accessions were tested in a randomized complete block design with three replications. The plot size was 1·6×2·4 m, with four rows and five plants per row. Land was prepared by deep ploughing and harrowing. Seed tubers within the weight range of 30–35 g were selected and sown at a depth of 10–15 cm on 20 March 2011. Guard rows were planted with the same crop surrounding the experimental field to prevent damage. Annual rainfall, temperature, frost-free and solar duration time at the research station were 300 mm, 6·7 °C, 130 days and 2665·9 h, respectively. Supplementary water was provided by sprinkler irrigation five times between April and September.
Geographical sources and tuber colour of H. tuberosus L. accessions used in this study

DRDCDA, Dingxi Research and Distribution Center of Dryland Agriculture (Dingxi, China); AUDH, Department of Horticulture, Aarhus University (Aarhus, Denmark); LZUPGR, Plant Germplasm Repository, Lanzhou University (Lanzhou, China); QAAF, Qinghai Academy of Agricultural and Forestry (Qinghai, China); JAAS, Jilin Academy of Agricultural Sciences (Changchun, China); NAUCRES, College of Resources and Environmental Science, Nanjing Agricultural University (Nanjing, China); BWFRD, Beijing Wanfuchun Forest Resources Development Co., LTD (Beijing, China).
Amplified fragment length polymorphism diversity
Genomic DNA was extracted from c. 20 mg silica gel dried leaf material using the cetyltrimethyl ammonium bromide (CTAB) method (Doyle & Doyle Reference Doyle and Doyle1987). Five individuals were selected randomly from each accession for AFLP analyses.
The AFLP analysis was performed using a slightly modified version of the protocol described by Vos et al. (Reference Vos, Hogers, Bleeker, Reijans, Van De Lee, Hornes, Frijters, Pot, Peleman, Kuiper and Zabeau1995). A total of 250 ng genomic DNA was digested with the restriction endonuclease enzymes EcoRI and MseI (New England Biolabs, Ipswich, MA, USA) in a total volume of 20 μl for 5 h at 37 °C. The DNA fragments were ligated to EcoRI and MseI adaptors at 4 °C overnight. The reaction mix contained 5 pM of EcoRI adaptor, 50 pM of MseI adaptor, 10×T4 DNA ligase buffer and T4 DNA ligase (Promega) in a total volume of 10 μl. The adaptor-ligated product was pre-amplified at 94 °C for 2 min, then 30 cycles of 94 °C for 30 s, 56 °C for 30 s and 72 °C for 80 s, followed by 72 °C for 5 min and ending with 4 °C for 1 h. The reaction primer pair EcoRI-A/MseI-C was used. The pre-amplified product was diluted to 1/50 and used as a template for a further selective amplification reaction using an EcoRI-primer tagged with a 6-FAM dye and MseI-primer (EcoRI-ACG/MseI-CAA, EcoRI-AGG/MseI-CAG, EcoRI-ACG/MseI-CTA, EcoRI-AGC/MseI-CTA, EcoRI-AGG/MseI-CTA). Selective amplification was carried out for 30 s at 94 °C, 30 s at 65–55 °C (a decrease of 0·7 °C per cycle), and 80 s at 72 °C for 12 cycles, followed by 23 cycles of 30 s at 94 °C, 30 s at 55 °C and 80 s at 72 °C. The amplified fragments were separated and detected using an ABI PRISM 377 automated sequencer (Applied Biosystems, Foster City, California, USA), and AFLP-GeneScan files were then scored with Genotyper 3.7 (Applied Biosystems). The AFLP band data were collected using GeneScan 2.1 (Applied Biosystems). Multi-locus profiles were scored for the presence (1) or absence (0) of fragments between 50 and 500 bp.
Morphological traits and chemical composition
Five plants in each plot were randomly selected for measurement, and ten morphological characters were assessed (Kays & Kultur Reference Kays and Kultur2005; Kays & Nottingham Reference Kays and Nottingham2008): (1) plant height (cm); (2) stem diameter (mm); (3) branches per plant; (4) days from sowing to flowering; (5) days from first to last flowering; (6) inflorescences per plant; (7) seeds per inflorescence (%); (8) rhizome length (cm); (9) tubers per plant; and (10) tuber yield per plant (kg).
After the harvest, three different tubers in each plot were randomly selected to determine the fresh weight, sliced into thin pieces and dried at 60 °C for 72 h. The weight difference was calculated and expressed as dry weight (%). Based on the dry weight, six tuber quality traits were measured for the three replicates of each accession by the Analytical and Testing Center, Gansu Academy of Agricultural Science, Gansu. The content of crude fat (g/kg), ash (g/kg), crude protein (g/kg), crude fibre (g/kg), total sugar (g/kg) and reducing sugar (g/kg) were estimated following the Chinese protocols GB/T 5009.6-2003, GB/T 5505-2008, GB/T 5009.5-2003, ISO 5498-1981, GB/T 5009.9-2003 and GNJ/JZX 068-2004, respectively (available online from the Standardization Administration of the People's Republic of China at http://www.sac.gov.cn/ (in Chinese)).
Statistical analysis
For the AFLP data, polymorphisms were scored as 0 or 1 and GenAlEx 6·2 to conduct principal coordinate analyses (PCA) (Peakall & Smouse Reference Peakall and Smouse2006). Cluster analysis was performed using the unweighted pair-group method with arithmetic averages (UPGMA) in NTSYS-pc version 2.10 and was based on the Simple Matching coefficient (Rohlf Reference Rohlf2000). The total number of bands (TNB), number of polymorphic loci (NPL), Nei's gene diversity (H), percentage of polymorphic loci (PPL) and Shannon's information index (I) were calculated using POPGENE version 1.31 (Yeh et al. Reference Yeh, Yang and Boyle1999). Analysis of molecular variance (AMOVA) was used to detect genetic variation between and within European and East Asian accessions.
The morphological and chemical traits were subjected to descriptive statistics. The significant differences for each character were performed according to experimental design using analysis of variance (ANOVA) at P<0·05. To minimize the scale effects, the morphological and chemical traits were standardized and on the basis of the standardized trait values, Euclidian distances between the accessions were calculated. Cluster analysis was performed on the matrix of Euclidian distances using UPGMA. The standardized data were subjected to PCA, and the mean, range, coefficient of variation (CV) and variance were calculated for various morphological and chemical traits using SPSS 17·0. Morphological and chemical variations between European and East Asian accessions were detected using AMOVA.
RESULTS
Amplified fragment length polymorphisms genetic diversity
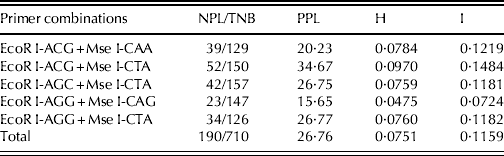
Five pairs of AFLP primers were selected for genetic diversity analysis (Table 2). No differences were found in the genetic patterns associated with each pair of primers between the five individuals representing each accession. This may be because the cultivated tubers of each accession originated from a single clonal parent. Therefore, only one individual was used to represent each accession. The values of PPL, H and I varied for five primer combinations, ranging from 15·65 to 34·67, 0·0475 to 0·0970 and 0·0724 to 0·1484, respectively, with the highest value for EcoRI-ACG/MseI-CTA and the lowest for EcoRI-AGG/MseI-CAG. For all 60 accessions, a total of 710 reproducible bands were produced by the five pairs of primers combined; of these, 190 were polymorphic bands, and the PPL, H and I values were 26·76, 0·0751 and 0·1159, respectively (Table 2). All accessions can be identified from the combination of these polymorphisms.
The five primer combinations and levels of polymorphism comprising the amplified fragment length polymorphism (AFLP) data
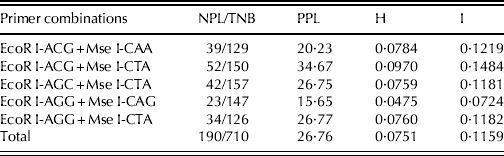
NPL, Number of polymorphic loci; TNB, Total number of bands; PPL, Percentage of polymorphic loci; H, Nei's gene diversity; I, Shannon's information index.
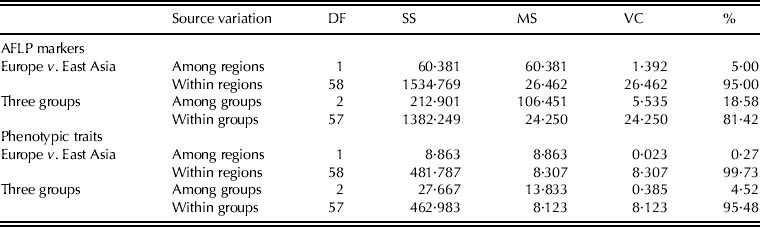
Principal coordinates analysis based on AFLP data demonstrated a high correlation between the 60 accessions and four tuber colour groups (Fig. 1). The dendrogram constructed from the AFLP data using UPGMA is shown in Fig. 2a. The accessions from Europe and East Asia did not form separate clusters. All accessions were clustered into three major groups with a similarity coefficient of 0·925. Group I could be further divided into two subgroups with a similarity coefficient of 0·926: subgroup I-1 comprising eight accessions with purple tubers and subgroup I-2 containing five accessions with brown tubers. Group II comprised seven accessions including four recent hybrids, whereas Group III included 27 accessions with white tubers and 13 accessions with red tubers. The whole clustering pattern was not consistent with groupings based on phenotypic traits (Fig. 2). The AMOVA suggested that there is a very small amount of variation between the European and East Asian accessions: only 5% of the variation occurred between regions and 95% within regions. However, genetic differentiation was relatively high between the three groups identified, with 18·58% divergence (Table 3).
Principal coordinates analysis for the 60 accessions of H. tuberosus L. Green, red, blue and purple dots indicate accessions with white, red, brown and purple tubers, respectively. Grey dots indicate hybrids. The triangles and circles represent the accessions from Europe and East Asia, respectively (colour version available online).
Dendrograms for the 60 accessions of H. tuberosus L. based on (a) AFLP data and (b) phenotype data. Green, red, blue and purple lines indicate accessions with white, red, brown and purple tubers, respectively. Grey lines indicate hybrids. Pictures A, B, C and D show the four typical tuber colours. The triangles and circles represent the accessions from Europe and Asia, respectively (colour version available online).
Analysis of molecular variance (AMOVA) for 60 individuals of H. tuberosus L. using amplified fragment length polymorphism (AFLP) markers and phenotypic traits
The total data set contains accessions from two regions (Europe and East Asia) and three groups identified by AFLP markers. d.f., degrees of freedom; SS, sum of squares; MS, mean squares; VC, variance component; %, percentage of variability.
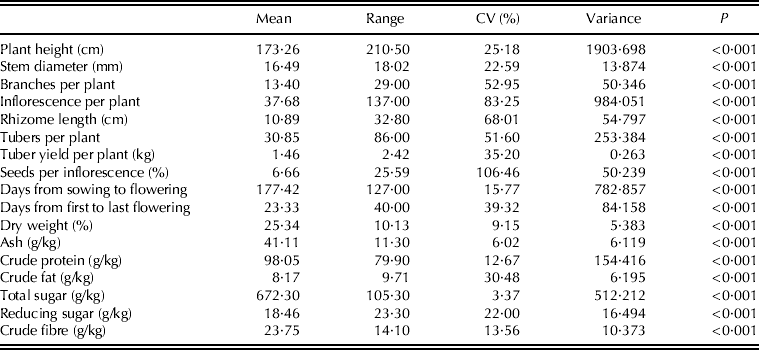
Morphological traits and chemical composition
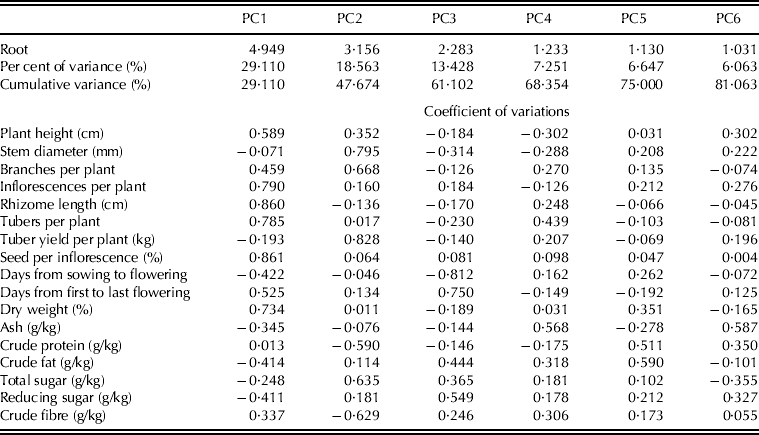
The ANOVA results showed highly significant differences for each morphological and chemical character among the germplasm (P<0·001) (Table 4), phenotypic traits, i.e. plant height, inflorescence per plant, tubers per plant and days from sowing to flowering varied greatly between accessions, whereas the figures for crude protein content and total sugar content varied slightly between accessions. A high CV (%) was recorded for the characters branches per plant, inflorescences per plant, rhizome length, tubers per plant, tuber yield per plant, seeds per inflorescence, days from first to last flowering and crude fat content (Table 4). In the multivariate PCA analysis, the first six principal components (PCS) accounted for 81·31% of the variability present among the 60 accessions for a total of 17 morphological and chemical traits (Table 5). The plot of the first two PCs indicated a close relationship between the 60 accessions and their tuber colours (Fig. 3). For example, purple and brown tuber accessions were closely related, while close relationships were found between white and red accessions. However, it was found that European and East Asian accessions were not separated into distinct clusters. Cluster analysis of the 60 accessions based on ten morphological and seven chemical traits was performed using the UPGMA method (Fig. 2b). Five groups were distinguished, with a similarity coefficient of 6·00. These groups also exhibited a moderate correlation with tuber colour. The phenotypes of accessions from East Asia and Europe were not differentiated (Fig. 2b). The variation between the two regions accounted for only 0·27% of all the differences, compared with within-region variation, which amounted to 99·73% of the total (Table 3).
Plot of first- and second-component scores for the 60 accessions of H. tuberosus L. Green, red, blue and purple dots indicate accessions with white, red, brown and purple tubers, respectively. Grey dots indicate hybrids. The triangles and circles represent the accessions from Europe and East Asia, respectively (colour version available online).
Descriptive statistics and analysis of variance (ANOVA) for various morphological and chemical traits
CV, Coefficient of variation.
Eigenvalues and contribution of phenotypic traits for the first six principal components (PCs)
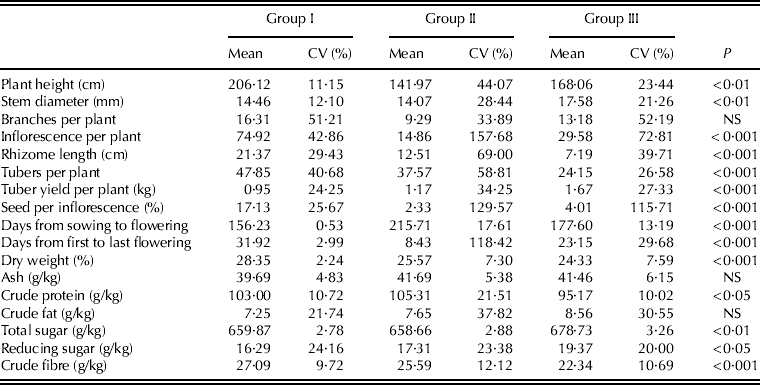
Within the three genetic groups, significant differences existed for each morphological and chemical character beside the branches per plant and the content of ash and crude fat (P<0·05), and high CV were found with respect to: branches per plant, inflorescence per plant, rhizome length, tubers per plant, tuber yield per plant and seeds per inflorescence (Table 6). In Groups II and III, plant height, stem diameter and days from the first to the last flowering varied greatly. With respect to chemical composition, the high variations were attributable to the content of: crude protein, crude fat, reducing sugar and crude fibre. Groups I and II had higher values than Group III for dry weight, crude protein content and crude fibre content. In contrast, accessions in Group III contained more crude fat, total sugar and reducing sugar (Table 6).
Variation in morphological and chemical traits of the three groups identified by amplified fragment length polymorphism (AFLP) markers
CV, coefficient of variation; P, the significant differences between the three groups determined by ANOVA.
DISCUSSION
The aim of the present study was to determine the genetic diversity and differentiation of H. tuberosus L. germplasms. The statistical analyses of 17 phenotypic traits for the 60 accessions suggested considerable morphological variation, and both genetic and phenotypic variation were found to have a moderate correlation with tuber colour. In particular, the purple and brown accessions each formed an obvious clade in the cluster analysis. Therefore, tuber colour can be used as an important criterion when managing H. tuberosus germplasm as also suggested by Pas'ko (Reference Pas'ko1973). Five pairs of AFLP primers also contained a moderate percentage (26·76%) of polymorphic bands, and the recovered polymorphisms are enough to determine inter-accession relationships. All accessions could be differentiated by the combinations of the different AFLP polymorphisms. As found for sugarcane (Perera et al. Reference Perera, Arias, Costilla, Luque, García, Díaz Romero, Racedo, Ostengo, Filippone, Cuenya and Castagnaro2012), durum wheat (Annicchiarico et al. Reference Annicchiarico, Royo, Bellah and Moragues2009) and other plants (Waycott & Fort Reference Waycott and Fort1994), a combination of phenotypic and molecular data may provide more critical discrimination. Therefore, both datasets obtained in the present study provide a solid basis for the identification of germplasm of H. tuberosus L.
It was found that the inter-accession relationships based on phenotypic traits differed from those based on AFLP polymorphisms. The only congruence was found in the purple and brown tuber accessions, which grouped into a cluster and appeared in the basal positions of both phenotypic and AFLP trees. These two groups may have a high correlation, together differing distinctly from the accessions with white or red tubers. A disagreement between phenotypic and molecular clusters has been found in numerous species such as strawberry varieties (García et al. Reference García, Ontivero, Diaz Ricci and Castagnaro2002), Cucurbita maxima (Ferriol et al. Reference Ferriol, Picó and Nuez2003), Pisum sativum (Tar'an et al. Reference Tar'an, Zhang, Warkentin, Tullu and Vandenberg2005) and Almagro eggplant (Muñoz-Falcón et al. Reference Muñoz-Falcón, Prohens, Vilanova, Ribas, Castro and Nuez2009). This is mainly due to the fact that phenotypic and AFLP approaches examine different diversity levels. Amplified fragment length polymorphism is a nearly-neutral DNA fingerprinting technique that uses the ideal marker for recovered genetic polymorphisms at the genome level (Muller & Wolfenbarger Reference Muller and Wolfenbarger1999). However, phenotypic diversity is based on traits that derive from the final interactions between genes and the environment.
There was no regional differentiation with respect to the genetic and phenotypic traits examined, with only 5·00 and 0·27%, respectively, of the total variation attributed to regional differences. This may be due to the fact that this plant has a very short cultivation history (Heiser Reference Heiser and Carter1978) and its cultivars have been frequently exchanged between Europe and Asia (Kays & Nottingham Reference Kays and Nottingham2008).
Among the three genetic groups, Group III has a higher tuber yield per plant than Group I or II (1·67 v. 1·17 and 0·95). All accessions from this group will be important for future breeding programmes since high tuber yield is the most immediate goal. In addition, within each genetic group, it was found that all morphological traits and chemical composition varied greatly despite their very similar genetic backgrounds. Overall, the genetic and phenotypic characters found within both the European and East Asian germplasm accessions could provide a strong basis for future breeding programmes.
Gitte Kjeldsen Bjørn (Department of Horticulture, Aarhus University, Denmark) is gratefully acknowledged for providing 17 accessions of Helianthus tuberosus L. from Europe. This project was funded by the Natural Science Foundation of China (grant numbers 30725004; 31170571), the International Collaboration 111 Projects of China, and the 985 and 211 Projects of Lanzhou University.