Introduction
Neopterygian fishes (teleosts and holosteans) are the dominant living group of aquatic backboned animals. They represent approximately half of all vertebrate species (~32,000 species; Nelson et al. Reference Nelson, Grande and Wilson2016), assume a bewildering array of morphologies, and have come to occupy nearly every aquatic environment imaginable. However, the pattern by which crown neopterygians accumulated their spectacular anatomical variety from their first appearance in the Early Triassic (Grande and Bemis Reference Grande and Bemis1998; Benton et al. Reference Benton, Donoghue, Asher, Friedman, Near and Vinther2015) to the modern day is poorly constrained.
A better understanding of paleontological patterns of diversification is key to unraveling the contrasting evolutionary outcomes displayed by the two extant neopterygian lineages. The species-rich teleosts are often presented as an adaptive radiation catalyzed by key innovations in genomic architecture, feeding, and reproduction (e.g., Callazo et al. Reference Callazo, Bolker and Keller1994; Pough et al. Reference Pough, Heiser and McFarland1996; Hoegg et al. Reference Hoegg, Brinkmann, Taylor and Meyer2004; Meyer and Van de Peer Reference Meyer and Van de Peer2005). By contrast, the eight species of extant holosteans (bowfin and gars) are viewed as “living fossils” that have diversified little (Darwin Reference Darwin1859; Schultze and Wiley Reference Schultze and Wiley1984; Wiley and Schultze Reference Wiley and Schultze1984; Alfaro et al. Reference Alfaro, Santini, Brock, Alamillo, Dornburg, Rabosky, Carnevale and Harmon2009). While examination of extant species alone might suggest that holosteans have always been in the shadow of an exceptional teleost radiation, the fossil record provides clear evidence of an anatomically diverse holostean radiation during the Mesozoic (Romer Reference Romer1966; Colbert Reference Colbert1969; Frickhinger Reference Frickhinger1995; Senn Reference Senn1996; Benton Reference Benton2015; Clarke et al. Reference Clarke, Lloyd and Friedman2016). Although this morphological variety has been examined in various ways for specific clades and environments through time (e.g., Bellwood Reference Bellwood2003; Bellwood and Hoey Reference Bellwood and Hoey2004; Goatley et al. Reference Goatley, Bellwood and Bellwood2010; Clarke et al. Reference Clarke, Lloyd and Friedman2016; Marrama et al. Reference Marrama, Villier, Dalla Vecchia and Carnevale2016), a detailed comparison of holostean and teleost disparity that considers persistent phylogenetic uncertainty regarding the earliest diverging members of both clades has not been made. This limits our ability to evaluate what remain largely qualitative assertions about the nature of holostean and teleost morphological diversity over time (Romer Reference Romer1966; Colbert Reference Colbert1969; Carroll Reference Carroll1988; Senn Reference Senn1996; Benton Reference Benton2015; Poyato-Ariza and Martín-Abad Reference Poyato-Ariza and Martín-Abad2016). Thus, the primary goal of our contribution is to establish the pattern of holostean and teleost morphospace occupation and disparity throughout the first 150 million years of their evolutionary history, representing more than half of their combined paleontological records.
Here we use a geometric morphometric data set of 423 articulated fossil species (and up to 519 species when incomplete taxa are assigned analogues) to quantify shape disparity in Triassic‒Early Cretaceous neopterygians. This pattern informs our understanding in three main areas. First, we test whether there is a phenotypically “dominant” holostean phase in the Mesozoic. Inspiration for this question derives from textbook accounts of a three-phase model of actinopterygian evolution, in which a holostean fauna was dominant for roughly 100–150 million years, bookended by a Paleozoic radiation of “chondrosteans” (sensu Schaeffer Reference Schaeffer1973; differing from the more precise current application of the term [e.g., Grande and Bemis Reference Grande and Bemis1996]), and a late Mesozoic and Cenozoic radiation of teleosts (Romer Reference Romer1966; Colbert Reference Colbert1969; Senn Reference Senn1996; Benton Reference Benton2015). Several studies show greater taxonomic diversity in holosteans than teleosts early in the Mesozoic, but differ in their estimates of when teleost richness eclipses that of holosteans (Late Cretaceous: Thomson Reference Thomson1977; Early Jurassic: McCune and Schaeffer Reference McCune and Schaeffer1986; Late Triassic: Romano et al. Reference Romano, Koot, Kogan, Brayard, Minikh, Brinkmann, Bucher and Kriwet2016). These taxic patterns are accompanied by arguments for an analogous phase of greater holostean morphological diversity relative to teleosts throughout the Triassic and Jurassic (Romer Reference Romer1966; Colbert Reference Colbert1969; Senn Reference Senn1996; Poyato-Ariza and Martín-Abad Reference Poyato-Ariza and Martín-Abad2016), although patterns in the Cretaceous are less clearly defined. Despite these broadly consistent interpretations of a phase of holostean phenotypic “dominance,” ambiguities persist for a variety of reasons: older accounts are anecdotal and draw on outdated systematic frameworks; quantitative approaches are restricted to Lagerstätten; application of different taxonomic concepts (e.g., apomorphy-based and total-group concepts of Teleostei) make results noncomparable; and persistent uncertainty in the phylogenetic affinities of some anatomically distinctive neopterygian radiations. Given these challenges, an evaluation of a “dominant” holostean phase (and our second and third aims in the following paragraphs) warrants quantification of holostean and teleost variety under contemporary classification, using a total-group definition, which can also demonstrate the sensitivity of patterns of disparity to outstanding areas of phylogenetic uncertainty.
Second, we aim to quantify whether the increase in teleost morphological diversity between the Triassic and Early Cretaceous was abrupt, in the sense it was concentrated between two successive geological intervals (cf. Friedman Reference Friedman2010), or gradual, in the sense it was spread over several intervals. Establishment of a “dominant” teleost fauna had almost exclusively been discussed as a sudden event by Darwin (Reference Darwin1859: p. 305) and earlier workers. Although our understanding of the teleost record has changed considerably since (Patterson Reference Patterson1973, Reference Patterson1977; Arratia Reference Arratia1997, 2013, Reference Arratia2017), more recent accounts that explicitly discuss the morphological and ecological variety of teleosts nevertheless echo the notion of a relatively sudden expansion in teleost variety. Specifically, they imply a long “fuse” of phenotypic diversification wherein most apomorphy-defined teleosts (sensu Arratia Reference Arratia1999, Reference Arratia2001, Reference Arratia2013, Reference Arratia2017; the clade defined at the divergence of pholidophoriforms from all other teleosts) are conservative in form and ecology before an abrupt “mid” Cretaceous expansion (Colbert Reference Colbert1969; Carroll Reference Carroll1988; Poyato-Ariza and Martín-Abad Reference Poyato-Ariza and Martín-Abad2016). Therefore, as we quantify teleost phenotypic expansions through time, we can evaluate the contribution of apomorphy-defined taxa to these expansions.
Third, we seek to quantify and compare morphological variation in crown and stem teleosts and measure their relative contributions to overall teleost disparity from the Late Jurassic onward. Palaeontological and biological perspectives yield contrasting expectations for the phenotypic diversification of teleosts, and particularly of crown-group taxa. Neontological accounts predict high phenotypic variety in crown teleosts due to their possession of putative key innovations thought to enhance morphological evolution (e.g., Callazo et al. Reference Callazo, Bolker and Keller1994; Hoegg et al. Reference Hoegg, Brinkmann, Taylor and Meyer2004). By contrast, direct interrogation of the fossil record has suggested that most stem teleosts, along with Late Jurassic and Early Cretaceous crown teleosts, were phenotypically conservative (Colbert Reference Colbert1969; Carroll Reference Carroll1988; Poyato-Ariza and Martín-Abad Reference Poyato-Ariza and Martín-Abad2016). While past work examined rates and modes of evolutionary change in early holosteans and teleosts (Clarke et al. Reference Clarke, Lloyd and Friedman2016), it did not indicate how stem and crown teleosts contributed to overall teleost disparity, and how their contributions changed over time.
Materials and Methods
Phenotypic Data Collection
Taxon Selection
We sampled articulated fossils of crown neopterygians ranging in age from Induan (Early Triassic; ~250 Ma) to Albian (Early Cretaceous; ~100 Ma). As such, it should be indicated that our documentation of neopterygian phenotypic diversity cannot be taken to represent the overall actinopterygian pattern more generally. This is particularly noteworthy given that many actinopterygian clades with comparable body shapes to the crown neopterygians sampled here often appear earlier than their crown neopterygian analogues (e.g., deep-bodied stem-group neopterygian Bobasatrania [Beltan Reference Beltan1996] before pycnodoniformes and dapediiformes; elongate saurichthyforms [Romano et al. Reference Romano, Kogan, Jenks, Jerjen and Brinkmann2012] before aspidorhynchiforms) and the existence of taxa which appear to have no crown neopterygian analogue within our time series (e.g., stem neopterygian “flying fishes” [Xu et al. Reference Xu, Zhao, Gao and Wu2013]).
Shape was assessed (see following section) for 805 specimen images, either from photographs obtained by J.T.C. in museum collections, or those available in the literature. Specimen numbers and/or literature references are provided in Supplementary Information. The data set used here represents an expanded version of that appearing in Clarke et al. (Reference Clarke, Lloyd and Friedman2016). In total, 519 species are considered in this study. This number includes species measured directly plus those taxa that could not be landmarked but for which a landmarked relative with analogous body profile and fin position was identified (these substitute taxa were used in “extended sampling” analyses, outlined in our “Compensating for Missing Data with Extended Sampling” section).
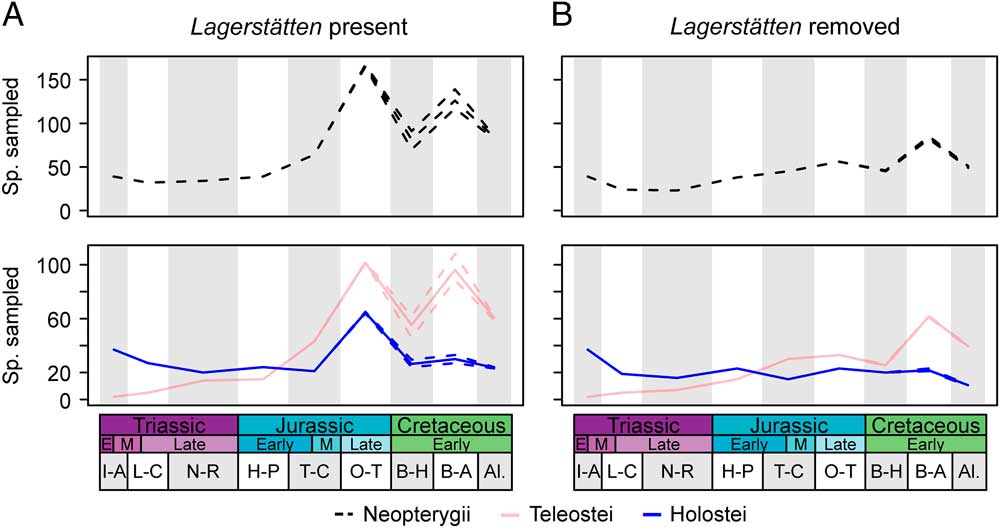
We present our per-bin counts of taxa sampled for one data set version (“extended data set” for scenario 1; see details of these scenarios in the “Accounting for Phylogenetic Uncertainty” section) in Figure 1 and all other data sets in Supplementary Figure S7. These are not intended to be taken as true patterns of richness over time. Rather, we include these for: (1) a summary of sampled diversity suitable for landmarking over our study interval; (2) comparison with patterns of disparity; (3) comparison with previous taxic accounts that also employ within-bin counts (Thomson Reference Thomson1977; McCune and Schaeffer Reference McCune and Schaeffer1986; Romano et al. Reference Romano, Koot, Kogan, Brayard, Minikh, Brinkmann, Bucher and Kriwet2016); and (4) an illustration of the effect of Lagerstätten on sampled diversity of articulated material. Study of neopterygian richness through the Mesozoic is not the focus of this study and is beyond the scope of the analyses conducted here.
Sampling (within-bin species counts) for crown neopterygians (black dashed), holosteans (blue/dark) and teleosts (pink/light) in this study. Curves presented for our extended sampling data set for scenario 1. See Supplementary Fig. S7 for remaining scenarios and the original data set. A, Sampling curves with Lagerstätten retained; B, sampling curves with Lagerstätten removed. Inner lines denote the mean richness over 100 replicates, and outer lines the 95% confidence intervals. Time-bin from oldest to youngest: I–A (Induan‒Anisian); L–C (Ladinian‒Carnian); N–R (Norian‒Rhaetian); H–P (Hettangian‒Pliensbachian); T–C (Toarcian‒Callovian); O–T (Oxfordian‒Tithonian); B–H (Berriasian‒Hauterivian); B–A (Barremian‒Aptian); Al. (Albian).

Geometric Morphometric Procedure
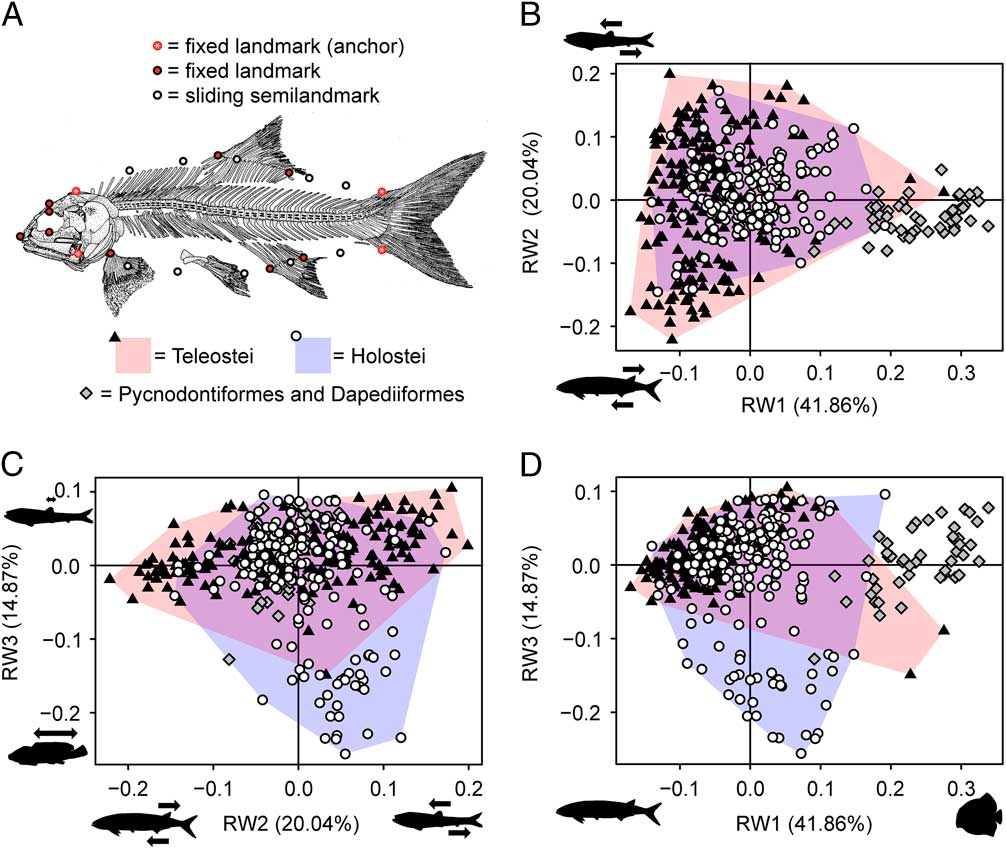
We employed a 2D geometric morphometric approach using a constellation of 23 landmarks to quantify shape variation (Fig. 2A) using the software package tpsDig2 v. 2.17 (Rohlf Reference Rohlf2013). The shape data set consisted of 805 specimen images assigned to 423 species (Figs. 2, 3; see Supplementary Information). Both fixed landmarks and semilandmarks were used to capture overall body shape and fin position, similar to schemes applied previously to living (Kerschbaumer and Sturmbauer Reference Kerschbaumer and Sturmbauer2011) and fossil (Friedman Reference Friedman2010) fishes. We sought to capture large-scale variations in body plan, rather than feeding ecology, which would be better served with a cranial landmark data set (e.g., McCord and Westneat Reference McCord and Westneat2016) or a data set of dental characters and biomechanical jaw structures (e.g., Bellwood Reference Bellwood2003; Bellwood and Hoey Reference Bellwood and Hoey2004). The caudal fins of many fossil taxa were missing, incomplete, or otherwise disrupted. Consequently, we did not place landmarks on the extremities of this structure or the extremities of other fins. Exclusion of the caudal fin and other fin extremities allowed us to substantially increase sample size, expanding our ability to incorporate the full diversity of body shapes and positions of all other fins. Landmarked specimen data were aligned using orthogonal generalized Procrustes superimposition analysis and subject to a relative warp (RW) analysis in tpsRelw v. 1.54 (Rohlf Reference Rohlf2014). Four axes described >5% of the overall variation. The first three (RW1‒3) captured clear biological features (Supplementary Table S1), while the fourth captured subtle curvature along the body axis, a preservational feature brought about by postmortem contortion due to muscle contraction. Care was taken to remove specimens displaying this characteristic opisthotonic distortion from the data set before ordination (cf. Clarke et al. Reference Clarke, Lloyd and Friedman2016). This axis therefore captures the subtle curvature that remained after specimen removal. RW1‒3 summarized 41.86%, 20.04% and 14.87% of overall variation, respectively. Anatomical correlates of these axes are detailed in the results and Supplementary Figure S1.
Landmark scheme and morphospaces for all Triassic, Jurassic, and Early Cretaceous crown neopterygians. A, The scheme of 23 landmarks used to quantify shape diversity. The three axes of morphospace that explain >5% of the variation are plotted as follows: B, RW1 vs. RW2; C, RW2 vs. RW3, and D, RW1 vs. RW3. Fixed landmarks in A, from tip of snout clockwise, document: (1) anterior tip of the upper jaw (premaxilla); (2) the central, ventral surface of the orbit; (3) the central, dorsal surface of the orbit; (4) the dorsal surface of the skull immediately above the eye; (5) postero-dorsal tip of braincase; (6) anterior insertion of dorsal fin; (7) posterior insertion of dorsal fin; (8) dorsal surface representation of the last vertebral centra; (9) ventral surface representation of the last vertebral centra; (10) posterior insertion of anal fin; (11) anterior insertion of anal fin; (12) anterior insertion of the pectoral fin; and (13) lower jaw joint. See Supplementary Fig. S1 for individual clades. Silhouettes indicate extremities of each shape axis.

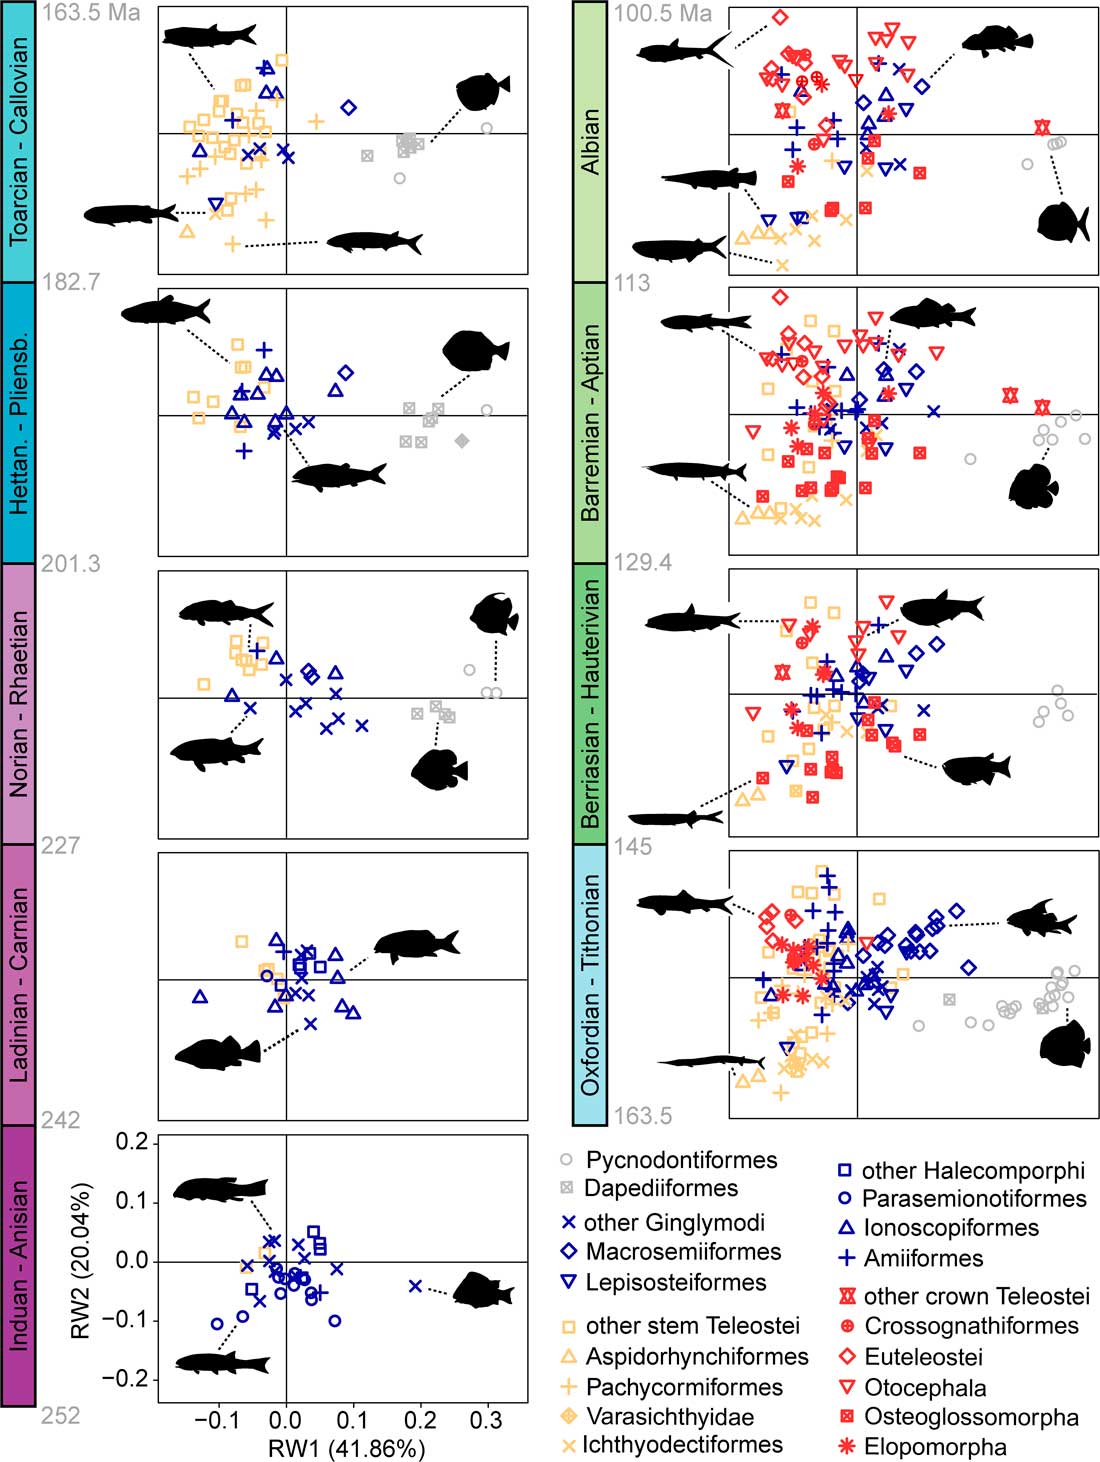
Morphospaces for crown neopterygians across our nine Mesozoic time bins derived from the mean age version of the extended sampling data set with taxa colored according to clade placement: holosteans (blue/darkest), stem teleosts (orange/lightest), crown teleosts (red/intermediate shading), and Neopterygii incertae sedis (Pycnodontiformes and Dapediiformes in gray/same light shading as stem teleosts). Subclades are depicted with symbols. Consult Supplementary Figs. S2‒S5 for occupation patterns under all four scenarios, with and without Lagerstätten, using the original and extended sampling data set. Consult Supplementary Tables S2‒S4 for statistical comparisons of the centroid between successive bins (for holosteans and teleosts individually) and within bins (holosteans vs. teleosts).

Quantification of Disparity
Time-Bin Selection
Instead of calculating disparity for each geological stage, we concatenated stages with the intention of creating time bins of more comparable duration and taxonomic sample size, while preserving major geological boundaries (cf. Friedman Reference Friedman2010; Stubbs and Benton Reference Stubbs and Benton2016). The Triassic, Jurassic, and Early Cretaceous were divided into nine time bins as follows: (1) Induan‒Anisian, (duration: 10.17 Myr); (2) Ladinian‒Carnian (15 Myr); (3) Norian‒Rhaetian (25.7 Myr); (4) Hettangian‒Pliensbachian (18.6 Myr); (5) Toarcian‒Callovian (19.2 Myr); (6) Oxfordian‒Tithonian (18.5 Myr); (7) Berriasian‒Hauterivian (15.6 Myr); (8) Barremian‒Aptian (16.4 Myr); and (9) Albian (12.5 Myr).
Accounting for Phylogenetic Uncertainty
We adopt total-group definitions of Holostei and Teleostei (cf. Patterson Reference Patterson1977; de Pinna Reference de Pinna1996) for disparity calculations. For contrasting views on teleost nomenclature, see Arratia (Reference Arratia1999, Reference Arratia2001, Reference Arratia2013, Reference Arratia2017), who provides an apomorphy-based definition of teleosts (referred to as apomorphy-defined teleosts throughout the article), a more conservative teleost definition devised in response to high historical uncertainty regarding the living sister-group of teleosts. As such, the apomorphy-based definition is reserved for the node at the divergence of pholidophoriforms (Arratia Reference Arratia2017), and so does not recognize the earliest diverging members of the teleost total-group (e.g., pachycormiformes, Prohalcites) as “true” teleosts.
Choice of phylogenetic framework can prove critical to studies of disparity, particularly if clades of uncertain placement are species-rich phenotypic outliers. As such, we sought to evaluate the impact of differing phylogenies on our results. Although placement of most taxa within either the holostean or teleost total-group is uncontroversial, the affinities of a small number of presumed early-diverging individual taxa, and of several neopterygian clades, either remain uncertain or have varied historically. In the face of this uncertainty, our goal is to identify and present the major sources of taxonomic uncertainty likely to meaningfully impact large-scale patterns. As such, rather than devise an exhaustive set of sensitivity analyses varying the placement of each uncertain individual taxon in every possible combination, we instead chose to exclude these few individual taxa (almost entirely Triassic; e.g., Enigmatichthys, Paralegnonotus) and focus our sensitivity analyses upon entire clades. In any case, our results suggest that the assignment of these few taxa to either holosteans or teleosts is unlikely to produce robust disparity values (i.e., associated with small confidence intervals) substantially different to those presented here (see “Results”).
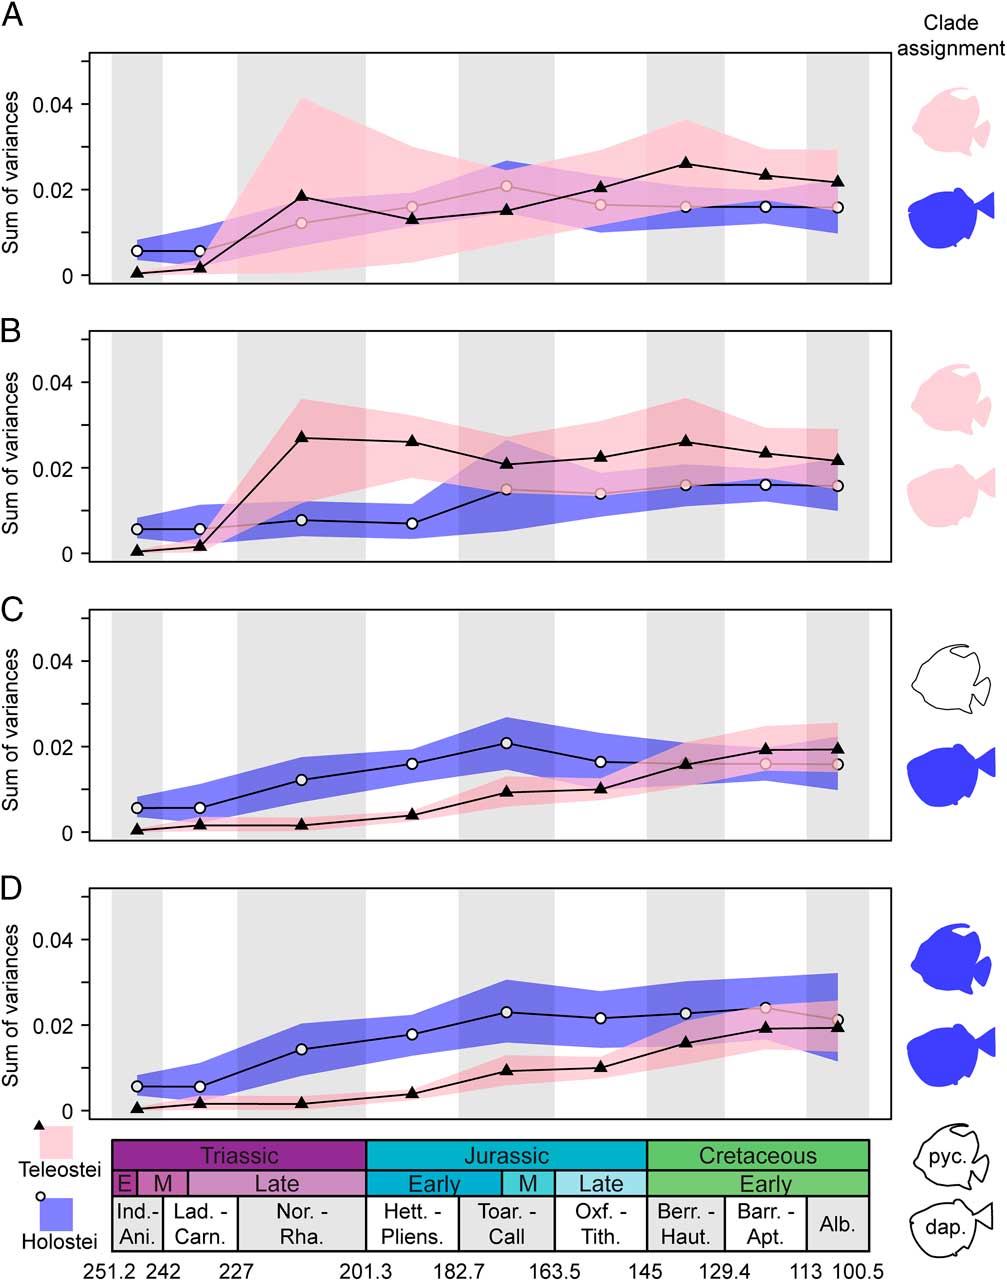
Clades that may introduce substantial variation in patterns of disparity include the aspidorhynchiforms, pachycormiforms, pycnodontiforms, and dapediiforms, all of which were regarded as holosteans sensu lato in precladistic accounts (e.g., Romer Reference Romer1966; Colbert Reference Colbert1969). However, phylogenetic studies have not recovered aspidorhynchiforms, pachycormiforms, or pycnodontiforms as holosteans, with any perceived associations between these clades and holosteans occurring solely as a result of their joint inclusion as outgroup taxa (Arratia Reference Arratia2000b; Arratia and Thies Reference Arratia and Thies2001). For aspidorhynchiforms and pachycormiforms, a degree of consensus has emerged, as successive studies repeatedly resolve them as total-group teleosts (e.g., Patterson Reference Patterson1973; Brito Reference Brito1997; Arratia Reference Arratia1999, Reference Arratia2000a, Reference Arratia2013, Reference Arratia2017; Hurley et al. Reference Hurley, Mueller, Dunn, Schmidt, Friedman, Ho, Prince, Yang, Thomas and Coates2007; Friedman et al. Reference Friedman, Shimada, Martin, Everhart, Liston, Maltese and Triebold2010, Friedman Reference Friedman2012). The placement of dapediiforms and pycnodontiforms is subject to greater uncertainty. To accommodate this ambiguity, we devised four scenarios. Scenario 1 (e.g., Fig. 4A) aligns dapediiforms with holosteans, as supported in most recent studies (Bermudez-Rochas and Poyato-Ariza Reference Bermudez-Rochas and Poyato-Ariza2015; Thies and Waschkewitz Reference Thies and Waschkewitz2015; Gibson Reference Gibson2016; Giles et al. Reference Giles, Rogers and Friedman2016), and pycnodontiforms with teleosts, as most commonly argued (Nursall Reference Nursall1996; Gardiner et al. Reference Gardiner, Maisey and Littlewood1996; Nursall and Capasso Reference Nursall and Capasso2004; Hurley et al. Reference Hurley, Mueller, Dunn, Schmidt, Friedman, Ho, Prince, Yang, Thomas and Coates2007; Wen et al. Reference Wen, Zhang, Hu, Zhou, Xe, Huang, Chen and Benton2012). Scenario 2 (e.g., Fig. 4B) places both dapediiforms and pycnodontiforms as teleosts, by considering those studies that have placed both clades as teleosts (Gardiner et al. Reference Gardiner, Maisey and Littlewood1996; Hurley et al. Reference Hurley, Mueller, Dunn, Schmidt, Friedman, Ho, Prince, Yang, Thomas and Coates2007; Wen et al. Reference Wen, Zhang, Hu, Zhou, Xe, Huang, Chen and Benton2012) with studies that have resolved dapediiforms as teleosts (Olsen Reference Olsen1984; Xu and Gao Reference Xu and Gao2011; Xu and Wu Reference Xu and Wu2012; Xu et al. Reference Xu, Zhao, Gao and Wu2013). Scenario 3 (e.g., Fig. 4C) accepts recent studies assigning dapediiforms to Holostei, and combines this with a recent study that resolved pycnodontiforms as stem neopterygians (Poyato-Ariza Reference Poyato-Ariza2015). Pycnodontiforms are therefore essentially removed from the analysis. Scenario 4 (e.g., Fig. 4D) considers both dapediiforms and pycnodontiforms as holosteans, by accepting the studies above which consider dapediiforms as holosteans and combining this with suggestions of a possible sister-group relationship between dapediiforms and pycnodontiforms (Gardiner et al. Reference Gardiner, Maisey and Littlewood1996; Hurley et al. Reference Hurley, Mueller, Dunn, Schmidt, Friedman, Ho, Prince, Yang, Thomas and Coates2007). No formal cladistic study has found this arrangement to date, but analyses incorporating both dapediiforms and pycnodontiforms as in-group taxa are rare.
Patterns of disparity in holosteans (blue/darkest) and teleosts (pink/lightest) across our four scenarios varying the taxonomic placement of dapediiforms and pycnodontiforms, ranging from most widely considered (A) to least considered (D) (see “Materials and Methods”). The color/shading of pycnodontiform and dapediiform silhouettes defines their systematic placement in each scenario, as either holosteans (blue/darkest) or teleosts (pink/lightest) or absent from the data set altogether (white fill). A, Scenario 1; B, scenario 2; C, scenario 3; and D, scenario 4. Extended sampling data sets with Lagerstätten removed displayed. See Supplementary Fig. S6 for both data sets and all scenarios with and without Lagerstätten. Data points represent mean disparity from 10,000 randomized sampling disparity values derived from the 100 data sets that incorporate stratigraphic uncertainty. Shaded regions are 95% confidence intervals. Consult Supplementary Tables S2‒S4 for statistical comparisons of disparity between successive bins (for holosteans and teleosts individually) and within bins (holosteans vs. teleosts).

Accounting for Fossil Age Uncertainty
The age of many fish-bearing units is well constrained, but considerable uncertainty applies to some localities. This is particularly pronounced for the Early Cretaceous continental deposits sampled here. We adopted a randomization procedure to address this problem. We produced 100 replicate data sets (i.e., 100 potential versions of events), in which we specified the age of each fossil deposit as a random variable drawn from a uniform distribution constrained by minimum and maximum ages based on existing geological constraints. These 100 replicates form the basis of all disparity calculations and statistical analyses and are illustrated in all plots of morphological disparity and taxonomic richness through time (e.g., Figs. 1, 4). Randomization of fossil ages in this way is commonplace in macroevolutionary studies (e.g., Hopkins and Smith Reference Hopkins and Smith2015; Wang and Lloyd Reference Wang and Lloyd2016) and reflects the uncertainty associated with stratigraphic correlation. Plots of morphospaces (e.g., Fig. 3 and Supplementary Figs. S1, S2) require a single version of events. In these instances, we placed fossils based on the midpoint of the possible span of ages.
Compensating for Missing Data with “Extended Sampling.”
In our original data set (see Supplementary Figs. S4, S5, S6, S7, S12–17 for disparity analyses and morphospaces), the only efforts to correct for missing data are to apply sampled species shapes to all known occurrences of these species (even if the occurrence is not articulated) across the time series using records from published databases (Cavin et al. Reference Cavin, Forey and Lecuyer2007; Lloyd and Friedman Reference Lloyd and Friedman2013) supplemented by new occurrences added here (see Supplementary Information). This action increased the number of in-bin shape occurrences across the time series from 414 to a maximum of 446 (a maximum due to the effects of randomization of fossil deposit ages within their spans of uncertainty).
We also conducted parallel analyses with an extended data set that takes additional steps to include missing data. It achieves this in three ways. First, we identified shape analogues for 107 taxa showing varying degrees of articulation, yet too incomplete to be landmarked. We did so by assigning to these species the shape of a close relative from the data set of 423 fully landmarked species, after consideration of aspects such as their taxonomy and/or body profile and/or head features and/or fin position (depending upon which information was available). Second, we incorporated a representative “genus shape” to be included in time bins where a genus is known to be present but for which there is little information for choice of a specific analogue taxon. This includes bins where the genus is either: (1) inferred to be present because the range of the genus passes through the bin; or (2) is known from a fossil occurrence, but can only be identified at the genus level, or is assigned to a species, yet is too incomplete to apply landmarks or be assigned a suitable species analogue. A representative shape for each genus was determined by calculating the mean shape for that genus (from relative warp scores) and then selecting the closest measured species to that hypothetical mean shape as typical for the genus. The latter step avoids designating a point in morphospace not known to be realized by a genus, instead selecting a real taxon closest to the average shape. Third, we incorporated a representative shape for ordinal-level taxa, implementing the same procedure as outlined for genera. This is particularly valuable in instances in which articulated specimens of highly apomorphic orders are absent from large intervals, such as the Early and Middle Jurassic for pycnodontiforms and the entire Early Cretaceous for pachycormiforms. Together, these steps increase the number of species in the extended data set to 519 and the number of individual shape occurrences to a maximum of 670.
Measuring Phenotypic Diversity
We measured disparity as multivariate variance, calculated using ordination axes summarizing more than 5% of overall variance (e.g., Fig. 4). We examined three axes of shape variation (the fourth axis summarizes apparent post-mortem distortion and was excluded; see “Geometric Morphometric Procedure” section and Clarke et al. (Reference Clarke, Lloyd and Friedman2016). Disparity (e.g., Fig. 5C–D) and partial disparity (sensu Foote Reference Foote1993; e.g., Fig. 5E) were also calculated for crown and stem teleosts from the Middle Jurassic onward to reveal their relative contributions to overall teleost disparity. Partial disparities, as for disparity, were calculated over 100 variants of the data set incorporating stratigraphic uncertainty, with 100 bootstrap pseudoreplicates for each. Partial disparity values plotted (e.g., 5E) represent the overall mean.
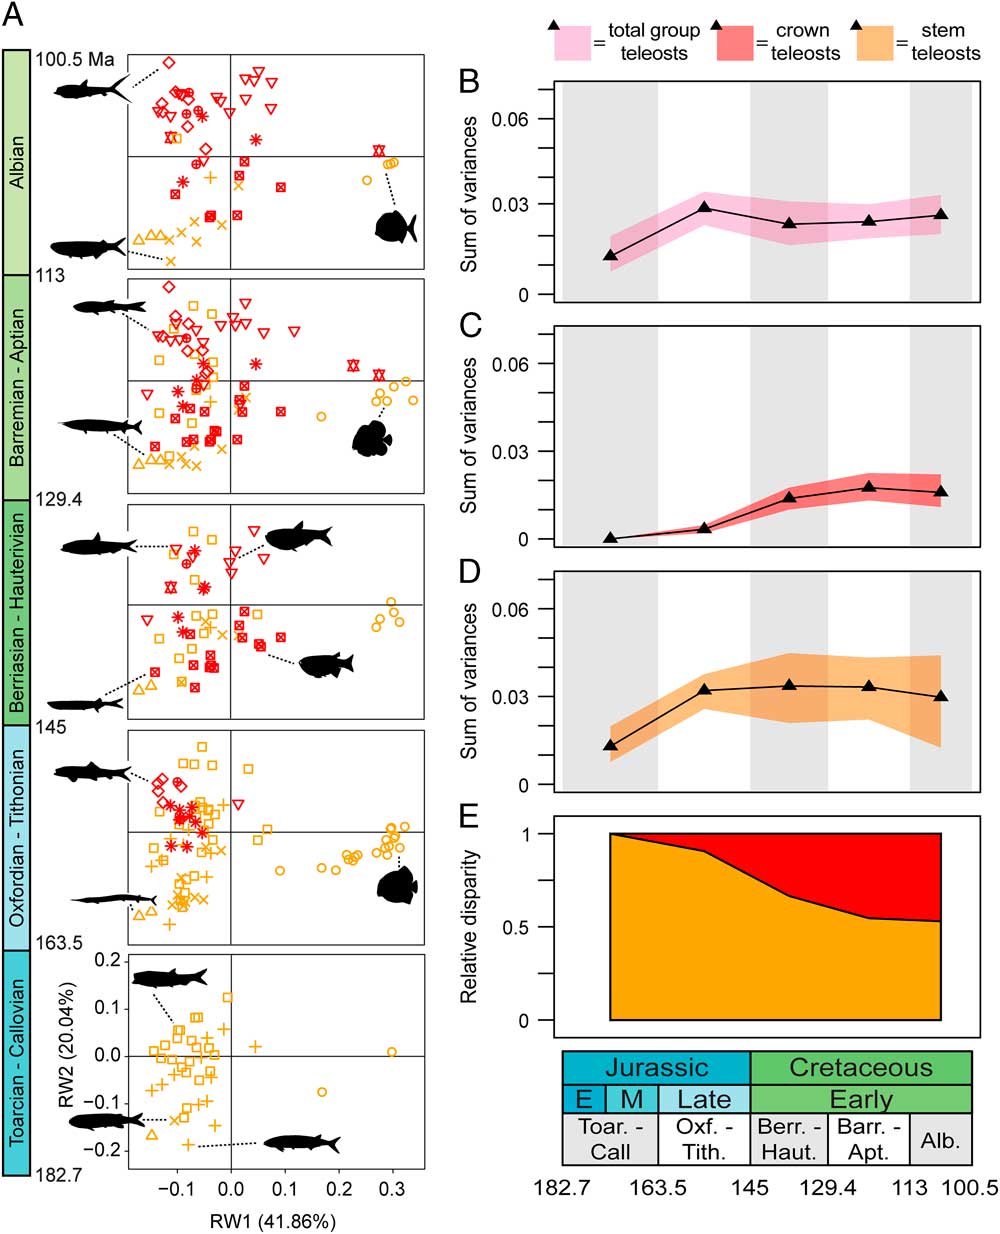
Crown and stem teleost occupancy and patterns of disparity, including their contribution to overall teleost disparity, between the Toarican–Callovian and the Albian according to scenario 1, where pycnodontiforms (but not dapediiforms) are included as stem teleosts. A, Crown teleost (red/darkest) and stem teleost (orange/lightest) morphospace occupation (see Fig. 3 for clade symbols); B, overall teleost disparity; C, crown teleost disparity; D, stem teleost disparity; and E, partial disparity of crown (top segment) and stem (bottom segment) teleosts. Morphospaces derived from the mean age version of our scenario 1 extended sampling data set with Lagerstätten retained, whereas disparity draws upon the 100 replicates of this data set. See Fig. 6 for scenario 3, and Supplementary Figs. S8–S17 for all alternative scenarios with and without Lagerstätten removal, with the original and extended data sets. Consult Supplementary Tables S5‒S7 for statistical comparisons of disparity and centroid between successive bins (for stem and crown teleosts individually) and within bins (stem teleosts vs. crown teleosts).

Statistical Testing
Testing for Variation in Levels of Morphological Disparity
For each of our 100 iterations incorporating stratigraphic uncertainty, we made measurements of overall disparity and associated uncertainty using 100 bootstrap samples taken with replacement. These values were used to derive mean disparities and 95% confidence intervals for each target clade and time period (e.g., Fig. 4) and formed the basis of statistical comparisons. Using the t-test procedure described by Zelditch et al. (Reference Zelditch, Swiderski and Sheets2012), which modifies a traditional t-test for comparisons of a group-level trait that cannot be measured for individuals (e.g., disparity, derived from all members of a group), we tested for changes in holostean and teleost and disparity individually between successive time bins (Supplementary Tables S2, S3) and differences between holostean and teleost disparity within each time bin (Supplementary Table S4). These tests were also conducted for crown and stem teleosts from the Middle Jurassic onward (Supplementary Tables S5‒S7). The t-tests require the number of taxa sampled for a target clade and time bin to be specified. Because this number could vary due our inclusion of fossil age uncertainty, the mean sample size of the target clade across those 100 replicates was used for the test. Because we perform multiple statistical comparisons, we indicate whether results remained significant after applying the Holm-Bonferroni sequential correction (Holm Reference Holm1979) as implemented in the function p.adjust (R base package) (Supplementary Tables S2‒S7).
Testing for Shifts in Patterns of Morphospace Occupancy
Using a PERMANOVA (nonparametric MANOVA) as implemented in the adonis function of the R package ‘vegan’ (Oksanen et al. Reference Oksanen, Guillaume, Friendly, Kindt, Legendre, McGlinn, Minchin, O’Hara, Simpson, Solymos, Stevens, Szoecs and Wagner2016), we tested for changes in holostean and teleost morphospace occupation individually between successive time bins (Supplementary Tables S2, S3) and for differences between holostean and teleost morphospace occupation within each time bin (Supplementary Table S4). These tests were also conducted for crown and stem teleosts from the Middle Jurassic onward (Supplementary Tables S5‒S7). Unlike our t-test, it is not possible to use the mean sample size of the target clade from 100 iterations of our data set that incorporated stratigraphic uncertainty. Instead, the PERMANOVA was applied to every data set, resulting in 100 p-values from which we present mean, minimum, and maximum values (Supplementary Tables S2‒S7). We applied the Holm-Bonferroni sequential correction to our mean p-values for comparison.
Assessing the Impact of Lagerstätten
Exceptional fossil deposits can distort diversity patterns through time. These “Lagerstätten effects” (Raup Reference Raup1972) clearly inflate sampled richness in several fossil groups for specific time intervals (Labandeira Reference Labandeira2005; Butler et al. Reference Butler, Barrett, Nowbath and Upchurch2009). Pertinently, Mesozoic Lagerstätten are widely thought to bias patterns of richness in the Mesozoic record of fishes (Cavin Reference Cavin2010; Cavin and Forey Reference Cavin and Forey2007; Lloyd and Friedman Reference Lloyd and Friedman2013). The effects of such biases on patterns of morphological—rather than taxonomic—diversity remains little explored (but see Friedman Reference Friedman2010; Butler et al. Reference Butler, Brusatte, Andres and Benson2012).
For this analysis, we define a Lagerstätte as any site from which 10 or more fully articulated neopterygian species have been sampled in our phenotypic database. The aim of this strategy is to avoid further degradation of time bins where no particularly diverse sites are known and to allow removal of multiple sites from a single bin, an important consideration given that exceptional fish-bearing localities appear to be concentrated during intervals of sea-level highstand (Cavin and Forey Reference Cavin and Forey2007; Cavin Reference Cavin2010). We applied this approach to all bins with one exception: our earliest Jurassic interval. This bin incorporates the famous deposits of the “Jurassic Coast” of the southern United Kingdom (most notably the Blue Lias Formation), but no other localities of noteworthy diversity. Thus, to ensure this bin contained a sample size comparable to that of surrounding bins, we retained Lyme Regis in our Lagerstätten-removed disparity trajectories.
Results
Summary of Morphological Correlates of Ordination Axes
RW1 (41.86% of variance) describes changes from slender-bodied taxa to deep-bodied taxa (Supplementary Fig. S1). Body elongation as the dominant axis of variation is similarly reflected in other morphometric studies of fishes (Claverie and Wainwright Reference Claverie and Wainwright2014). Strongly negative scores on RW1 reflect slender taxa, best typified by aspidorhynchiforms (Supplementary Fig. S1), while strongly positive scores equate to deep-bodied taxa, such as some pycnodontiforms that appear circular in profile (Supplementary Fig. S1).
RW2 (20.04% of variance) describes the first insertion position of the dorsal fin relative to the first insertion of the anal fin (Supplementary Fig. S1). Taxa with strongly positive scores have dorsal fins that first insert relatively close to the head, far ahead of where the anal fin first inserts. This is exemplified by macrosemiiforms (stem ginglymodians, Supplementary Fig. S1), although many crown teleosts, stem teleosts, and halecomorphs also occupy this region of morphospace (Supplementary Fig. S1). The strongest negative scores reflect taxa whose dorsal fin anterior insertion is positioned posteriorly relative to the anterior insertion of the anal fin, such as in the pachycormid Euthynotus incognitus (Supplementary Fig. S1).
RW3 (14.87% of variance) describes variation in the length of the dorsal fin base (Supplementary Fig. S1). Taxa with a very short dorsal fin base relative to the length of the body possess strongly positive scores, such as the ellimmichthyiforms (Supplementary Fig. S1). Macrosemiiforms possess the largest dorsal fin bases relative to overall body length, and so possess strongly negative (<−0.2) RW3 scores (Supplementary Fig. S1).
Patterns of Morphospace Occupancy in Holosteans and Teleosts
We primarily discuss the pattern from our extended sampling data set (see “Materials and Methods”) with Lagerstätten retained, so that all forms that are known and inferred to exist (from genus and order ranges) can be examined (Fig. 3, Supplementary Fig. S2). See Supplementary Figure S3 for extended data set patterns with Lagerstätten removed and Supplementary Figures S4 and S5 for the original data set with and without Lagerstätten, respectively.
Holosteans
Triassic to Early Cretaceous holosteans show considerable variation in body shape (Fig. 2). Holosteans occupy all four quadrants on the first two axes of the shape space. Extremities of holostean phenotypic space are defined by macrosemiiforms (which combine slender bodies with a long-based dorsal fin; Fig. 3, Supplementary Fig. S1), amiiforms (which combine slender bodies with a long-based dorsal fin; Fig. 3, Supplementary Fig. S1), lepisosteiforms (which combine narrow bodies with short-based, posteriorly positioned dorsal and anal fins; Fig. 3, Supplementary Fig. S1) and potentially (scenarios 1, 3 and 4) dapediiforms or dapediiforms and pycnodontiforms (which combine deep bodies with long-based dorsal fins with an anterior insertion lying in front of that of the anal fin; Fig. 2, Supplementary Figs. S1, S2). Holostean groups closest to the average crown-neopterygian shape include two halecomorph groups: ionoscopiforms and parasemionotiforms (Supplementary Fig. S1). The latter group is noteworthy as the earliest occurring widely recognized crown neopterygians in the fossil record (Patterson Reference Patterson1973; Gardiner et al. Reference Gardiner, Maisey and Littlewood1996; Grande and Bemis Reference Grande and Bemis1998; but see Olsen Reference Olsen1984; Giles et al. Reference Giles, Rogers and Friedman2016).
Despite high taxon counts in the first and second Triassic bins, holosteans cluster closely to the origin of morphospace at this time under all scenarios (Fig. 3, Supplementary Fig. S2). A dense cluster of holosteans around the origin is a consistent feature across all time bins, providing considerable stability to the appearance of holostean morphospace through the Mesozoic. This observation is reflected quantitatively by PERMANOVA between successive time bins, where p-values are typically >0.05 (Supplementary Table S2). We therefore can rarely reject the null that the holostean centroid is comparable between successive intervals. Nevertheless, a significant shift (robust to use of the original or extended data sets both with and without Lagerstätten) is apparent in scenario 4 between the Ladinian‒Carnian and Norian‒Rhaetian bins, due to the appearance of both deep-bodied pycnodontiforms and dapediiforms (Supplementary Fig. S2, Supplementary Table S2). Scenario 1 (and identical 3), where dapediiforms (but not pycnodontiforms) are holosteans, similarly indicates a shift at this time that either nears significance (extended data set) or is significant (original data set; Supplementary Table S2).
Teleosts
Mesozoic teleosts exhibit greater shape variation than Mesozoic holosteans, often occupying more extreme positions in morphospace (Fig. 2, Supplementary Fig. S1). An exception is RW3, where teleosts fail to explore highly negative scores (Fig. 2, Supplementary Fig. S1). Extremes of teleost shape space are defined by piscivorous ichthyodectiforms and aspidorhynchiforms (which combine long bodies with a dorsal fin that first inserts at a similar point to the anal fin, or even further posteriorly; Fig. 3, Supplementary Fig. S1), euteleosts (which combine fusiform bodies with the anterior insertion of the dorsal fin lying far anterior to that of the anal fin; Fig. 3, Supplementary Fig. S1), and the genus Araripichthys (which combines a deep body with long-based dorsal fins that insert far ahead of the anal fin; Fig. 3, Supplementary Fig. S1) in a region of space potentially (scenarios 1, 2, and 4) joined by pycnodontiforms or dapediiforms and pycnodontiforms (Fig. 3, Supplementary Figs. S1, S2). However, the vast majority of teleosts possess negative RW1 scores, with many clades occupying this fusiform and slender-bodied region of shape space (e.g., elopomorphs, pachycormiforms, crossognathiforms; Figs. 2, 3, Supplementary Fig. S1).
Determining reliable patterns of teleost morphospace occupation in the Early and Middle Triassic is difficult given the rarity of well-preserved material. Nevertheless, the few Induan‒Anisian and Ladinian‒Carnian teleosts known cluster close to the origin, in the upper left quadrant (with negative RW1 scores and positive RW2 scores; Fig. 3).
Different scenarios for the placement of pycnodontiforms and dapediiforms offer contrasting patterns of Carnian morphospace occupation. Under scenarios 3 and 4 (identical teleost composition), significant centroid shifts occur between the Norian‒Rhaetian and Hettangian‒Pliensbachian (Supplementary Table S3), with the latter bin showing an expansion in apomorphy-defined teleost morphospace occupation (Fig. 3). Another significant shift occurs between the Hettangian‒Pliensbachian and Toarcian‒Callovian bins (Fig. 3, Supplementary Fig. S2, Supplementary Table S3), driven by a substantial expansion of teleost morphologies with negative scores on RW2 (posteriorly positioned anterior dorsal fin insertion), including pachycormiforms, aspidorhynchiforms, ichthyodectiforms, and various other stem taxa within apomorphy-defined teleosts (Fig. 3, Supplementary Fig. S2).
Post-Callovian, significant shifts in occupancy occur between all remaining time bins, both with and without Lagerstätten (Supplementary Figs. S2, S3, Supplementary Table S3). The first two of these shifts appear to be driven by expansions of teleost morphospace. In the Late Jurassic, this expansion is attributable to the appearance of euteleosts, which occupy a unique region in the upper left quadrant (Fig. 3) and by two clusters of stem teleosts assignable to the apomorphy-defined teleost clade (□ symbols colored orange/with lightest shading; one cluster with highly positive RW2 scores, another with positive RW1 scores between 0 and 0.1). In the Berriasian‒Hauterivian, osteoglossomorphs and otocephalans bring about morphospace expansions in the bottom right and top right quadrants, respectively (Fig. 3). Post-Hautervian shifts in occupancy appear driven by changing numbers of taxa between previously occupied regions rather than by substantial expansions of morphospace. Instead, novel expansions are attributable to single genera from Aptian Lagerstätten: the “salmoniform” Chardonius (possessing the most positive RW2 score of any sampled neopterygian) and the incertae sedis taxon Araripichthys (the first highly deep-bodied crown teleost). Although the exact phylogenetic position of the latter is not clear, placement within the teleost crown seems secure (Silva Santos Reference Silva Santos1985; Patterson Reference Patterson1993a; Cavin Reference Cavin2001; Maisey and Moody Reference Maisey and Moody2001), thus making it the first example of a very deep-bodied member of the modern radiation.
Scenarios 1 and 2, while containing all of the specific features of morphospace occupancy outlined in the paragraphs immediately above, also invoke newly populated regions and alter associated shifts due to the addition of pycnodontiforms or dapediiforms and pycnodontiforms. Both scenarios show the expansion of teleosts into highly positive RW1 scores (deep-bodied forms) in the Norian‒Rhaetian (Fig. 3, Supplementary Fig. S2), bringing about occasionally significant (or near significant) centroid shifts compared with the preceding bin (Supplementary Table S3). These deep-bodied morphologies then persist for the rest of the time series. However, scenarios 1 and 2 differ in terms of significant shifts in morphospace occupancy later in the time series. When only pycnodontiforms are teleosts (scenario 1), pycnodontiform rarity in the Late Triassic and Early‒Middle Jurassic means that the cluster fusiform taxa (negative RW1 scores; Fig. 3) ultimately determine changes in patterns of morphospace occupation. Therefore, significant shifts seen in scenarios where no deep-bodied taxa are teleosts (scenarios 3 and 4), which occur between the Norian‒Rhaetian, Hettangian‒Pliensbachian and Toarcian‒Callovian bins, are maintained (Fig. 3, Supplementary Table S3). However, when both dapediiforms and pycnodontiforms are teleosts (scenario 2), many of these significant between-bin shifts in occupation disappear (Fig. S2, Supplementary Table S3), presumably because the overall teleost centroid for these bins remains consistently positioned between well-established fusiform and deep-bodied clusters.
Comparison of Patterns of Occupancy by Holosteans and Teleosts
Teleosts are commonly represented in the extremities of morphospace (discussed in the previous section). The group is unique relative to holosteans in containing members with elongate bodies whose anterior dorsal fin insertion occurs highly posteriorly, either close to the anterior insertion of the anal fin (this geometry appears only late in holostean history in gars) or inserting substantially before it. These taxa combining highly negative RW1 and RW2 scores include ichthyodectiforms, aspidorhynchiforms, some pachycormiforms, and some additional stem teleosts (within apomorphy-defined teleosts; Figs. 2B, 3, Supplementary Fig. S1). Conversely, holosteans also occupy regions that teleosts failed to populate during our study interval. Macrosemiiforms best represent such morphologies, possessing long dorsal fin bases (reflected in highly negative RW3 scores; Figs. 2D, 3, S1), which result in a dorsal fin that first inserts far anterior to the insertion of the anal fin (reflected in highly positive RW2 scores; Figs. 2B, 3, Supplementary Fig. S1). Analogous long dorsal fin bases are, however, seen in many groups of living teleosts (e.g., gobies, blennies). In addition, holosteans greatly outnumber teleosts in the region surrounding the origin of morphospace, yielding an overall pattern whereby holosteans largely occupy the center of morphospace, while teleosts form an “outer shell” of more extreme phenotypes (Fig. 2B, Supplementary Fig. S1). This general pattern is not merely an artifact of examining all Mesozoic taxa at once; holosteans retain shapes close to the origin of morphospace in every time bin, even in the Early and Middle Triassic, when there is no evidence of this teleost perimeter (Fig. 3). This pattern should be considered during interpretation of PERMANOVA results; even if the distributions of holosteans and teleosts do not overlap, the two groups may still share a similar centroid close to the origin of morphospace. The placement of dapediiforms and pycnodontiforms in either holosteans or teleosts may either strengthen (scenarios 1 and 2), or act as an exception to (scenarios 3 and 4), the phenomenon of a teleost “shell” (Supplementary Fig. S2).
PERMANOVA fails to detect a significant difference in the holostean and teleost centroids during the Induan‒Anisian and Ladinian‒Carnian in all four scenarios (Supplementary Fig. S2. Supplementary Table S4; note the Ladinian‒Carnian nears significance in extended sampling trajectories with Lagerstätten retained). Very little overlap is apparent between holostean and teleost taxa in the Norian‒Rhaetian across all scenarios (Fig. 3, Supplementary Fig. S2), either reflecting the holostean core and teleost shell pattern (scenarios 1 and 2) or teleosts on the edge of holostean morphospace (scenarios 3 and 4). As a result, significant and near-significant differences are recovered (Supplementary Table S4), with the exception of scenario 2, where the holostean core and teleost shell pattern align in such a way that their centroids are similar despite little overlap between the two clades in morphospace. The following six time bins (3 Jurassic, 3 Early Cretaceous) display a broadly common pattern. Aside from the varying placement of deep-bodied pycnodontiforms and dapediiforms across the scenarios, most teleosts possess negative RW1 scores, while holosteans cluster around the origin of morphospace. As a result, most scenarios show significant (or nearly significant) differences in the holostean and teleost centroids across these time bins in our extended data set (Fig. 3, Supplementary Fig. S2, Supplementary Table S4). The exception is scenario 2 in the Jurassic, where the assignment of both dapediiforms and pycnodontiforms to teleosts is sufficient to place the teleost centroid closer to the holostean centroid such that the result of the PERMANOVA is not significant (Supplementary Fig. S2, Supplementary Table S4).
Patterns of Disparity in Holosteans and Teleosts
Here we discuss the pattern from our extended sampling data set (see “Materials and Methods”) with Lagerstätten removed, where sampling is more comparable between time bins (Fig. 4). See Supplementary Figure S6 for all patterns using both the extended and original data set, with and without Lagerstätten.
Holosteans
All scenarios (scenario 3 is identical in holostean composition to 1 and is therefore omitted from this discussion) agree that holosteans display an initial period of low disparity spanning the Induan‒Carnian (Fig. 4), despite the fact that these intervals display the largest sample sizes for the group (with the exception of the Late Jurassic Lagerstätten-driven taxonomic peak; Fig. 1, Supplementary Fig. S7). Only when dapediiforms and pycnodontiforms are not holosteans (scenario 2) do these low levels of disparity extend to the Hettangian‒Pliensbachian (Fig. 4B). All other scenarios depict an approximate doubling in disparity between the Ladinian‒Carnian and Norian‒Rhaetian (Fig. 4A, C, D). This increase is occasionally (with the extended data set only) significant in scenario 1 (driven by appearance of dapediiforms; Supplementary Table S2) and mostly significant in scenario 4 (driven by dapediiforms and pycnodontiforms; Supplementary Table S2). Scenarios 1 and 4, then, display mean disparity increases (nonsignificant; Supplementary Table S2) in the Hettangian‒Pliensbachian and Toarcian‒Callovian, followed by a relatively stable disparity plateau (Fig. 4A, C, D). This Toarcian‒Callovian through Early Cretaceous plateau is also seen in scenario 2, but is instead preceded by a doubling of mean disparity (nonsignificant; Supplementary Table S2) from a Triassic–Pliensbachian plateau (Fig. 4B). Therefore, aside from the taxonomic uncertainty altering both the Carnian–Toarcian interval and the specific disparity maximum reached by holosteans, all scenarios agree that there is an initial Induan‒Ladinian disparity low, followed by some disparity increase between the Carnian to Toarcian‒Callovian and that this Toarcian‒Callovian disparity is largely maintained for the remainder of the time series.
Teleosts
Our analyses suggest three possible patterns of teleost morphological diversity over time (scenarios 3 and 4 have identical teleost composition; we omit reference to scenario 4). Although each has distinctive features, scenarios 1 and 3 both demonstrate a relatively gradual rise in teleost disparity leading to a stable plateau in the Early Cretaceous (Fig. 4A, C). This increase commences in either the Norian‒Rhaetian (scenario 1) or the Hettangian‒Pliensbachian (scenario 3). Whether the Norian‒Rhaetian phase of scenario 1 can be considered gradual is open to question due to large confidence intervals. The presence of two distant clusters of species—one consisting of deep-bodied pycnodontiforms and the other of fusiform “pholodophorids” sensu lato (Fig. 3)—is responsible for producing high mean disparity values with large confidence intervals.
Scenario 2 shows a sudden, dramatic, and significant increase in disparity associated with the first appearance of pycnodontiforms and dapediiforms in the Norian‒Rhaetian to levels that remain comparable for the remainder of the time series (Fig. 4B, Supplementary Table S3, robust to Lagerstätten removal). Although Norian‒Rhaetian holostean disparity displays broad confidence intervals, the separation of clusters in shape space is less dramatic than in scenario 1, because dapediiforms form a third cluster that slightly bridges the gap between pycnodontiforms and the cluster of fusiform teleosts (Supplementary Fig. S2).
Comparisons of Disparity between Holosteans and Teleosts
All scenarios indicate that holosteans possess higher disparity than teleosts in the Induan‒Anisian and Ladinian‒Carnian (Fig. 4), an observation that is robust to Lagerstätten removal (Supplementary Fig. S6). However, this difference is not statistically significant, due to the small numbers of teleost taxa sampled (Induan‒Anisian: 2 taxa; Ladinian‒Carnian: 3 taxa; according to our mean age data set). It is possible that new finds combined with the assignment of known Triassic Neopterygii incertae sedis taxa to teleosts upon future cladistic study may enable a statistical difference to be detected between holostean and teleost disparity. However, we would not expect the assignment of the few known Triassic Neopterygii incertae sedis taxa (excluded from our study, see “Materials and Methods”) to either holosteans or teleosts to produce robust disparity values (i.e., associated with small confidence intervals) substantially different from those presented here (Fig. 4), given the current spread and number of holostean versus teleost phenotypes in our Triassic bins (Fig. 3).
Our taxonomic scenarios differ after the Carnian, indicating sensitivity to the phylogenetic position of some groups. Scenario 1 shows gradual increases in disparity after the Carnian until the Early Cretaceous, where teleosts maintain higher mean disparity than holosteans (Fig. 4A). However, differences in disparity between holosteans and teleosts are not statistically significant during any time interval when using the extended data set with Lagerstätten removed (Fig. 4A, Supplementary Table S4). Nevertheless, teleosts display statistically higher disparity than holosteans in the Late Jurassic if Lagerstätten are retained (Supplementary Fig. S6, Supplementary Table S4). Even in the Early Cretaceous, when teleosts possess higher mean disparity than holosteans, this is not statistically distinguishable, either with or without Lagerstätten (Supplementary Table S4).
Under scenario 2, a sudden Norian‒Rhaetian increase in teleost mean disparity (albeit associated with large confidence intervals) brings about a period of higher disparity in teleosts relative to holosteans from the Late Triassic onward. Teleost disparity is statistically higher than that of holosteans in the Norian‒Rhaetian and Hettangian‒Pliensbachian, a result driven by the inclusion of dapediiforms and pycnodontiforms within teleosts (Fig. 4B; Supplementary Table S4; robust to data set choice and Lagerstätten removal). While teleosts largely maintain Hettangian‒Pliensbachian levels of disparity for the rest of the time series, holostean disparity gradually increases up until the Early Cretaceous (Fig. 4B).
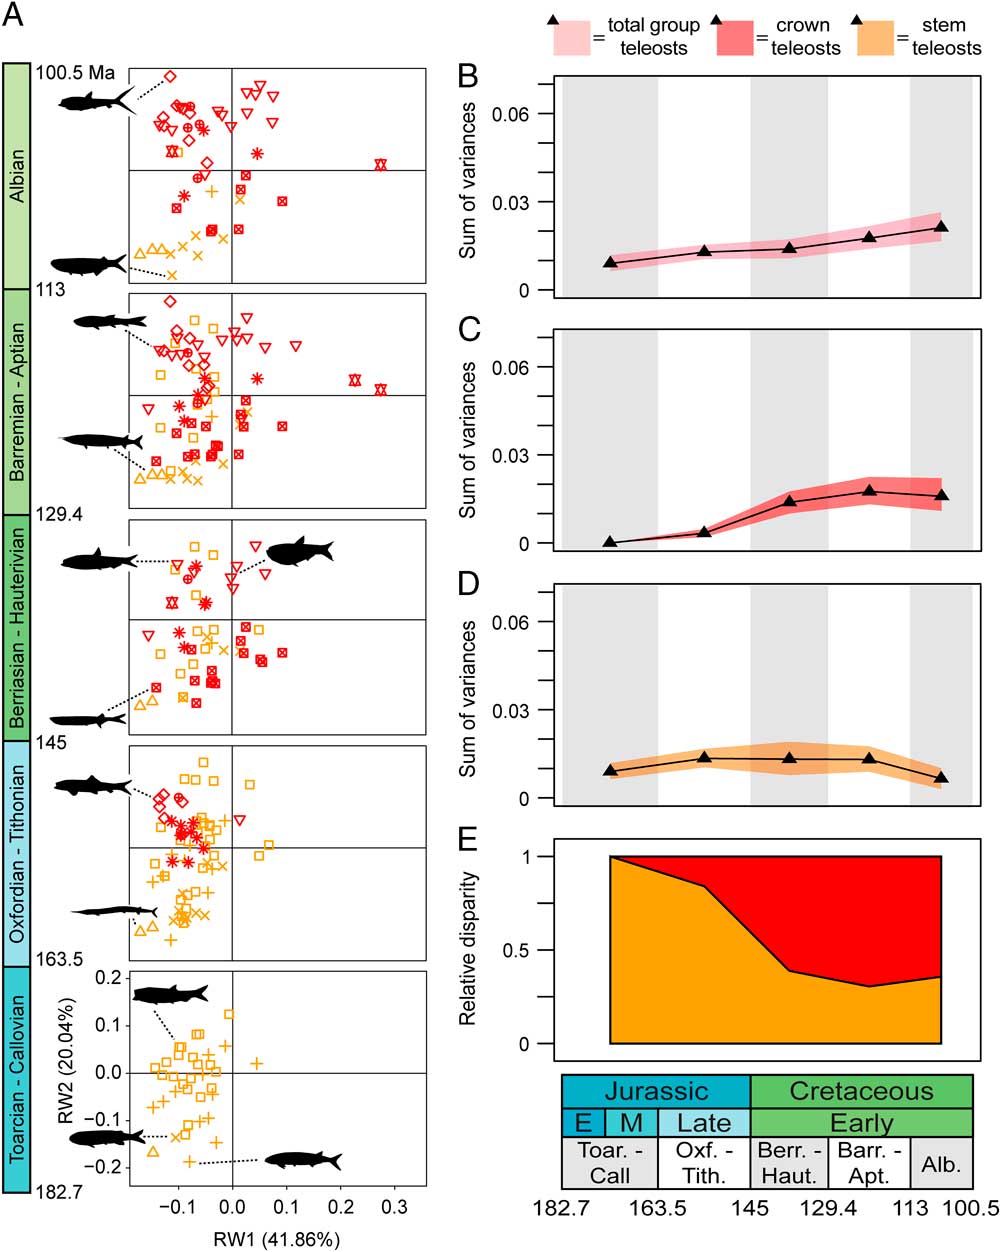
Scenario 3 shows a period of Late Triassic and Jurassic holostean phenotypic “dominance” and a gradual rise in teleost disparity to reach parity with holosteans by the Early Cretaceous. The absence of deep-bodied teleosts ensures holosteans are statistically more disparate than teleosts in the Norian‒Rhaetian and all three Jurassic bins (Fig. 4C, Supplementary Table S4; note the Late Jurassic is only near-significant p=0.052 with Lagerstätten removed). Gradual increases in teleost disparity from the Norian‒Rhaetian onward result in parity with holosteans (i.e., widely overlapping confidence intervals) throughout the entire Early Cretaceous (Fig. 4C).
Scenario 4 shows a period of Late Triassic through Jurassic (and potentially even Aptian) phase of holostean phenotypic “dominance.” Teleosts slowly increase in morphological diversity, achieving parity with holosteans by the end of the Early Cretaceous. With Lagerstätten removed, holosteans attain their highest disparity by the Toarcian‒Callovian and maintain this for the rest of the time series, sustaining higher disparity than teleosts until the end of the Aptian, after which disparity for the two groups is comparable (Fig. 4D). However, holostean disparity is only statistically higher than that of teleosts in the Norian‒Rhaetian and all Jurassic bins (Fig. 4D, Supplementary Table S4). Only with Lagerstätten retained do holosteans continue to increase their disparity beyond the Toarcian‒Callovian. This occurs via two stepwise increases, first between the Toarcian‒Callovian and Late Jurassic, and second between the Berriasian‒Hauterivian and Barremian‒Aptian (extended data set; Supplementary Fig. S6). Under this scenario, holosteans are statistically more disparate than teleosts in two additional bins (although this is not robust to Lagerstätten removal; extended data set, Supplementary Table S4): the Berriasian‒Hauterivian and Barremian‒Aptian.
Comparing Patterns within the Teleost Total-Group from the Late Jurassic Onward
Crown Teleost Morphospace Occupancy and Patterns of Disparity
Our differing scenarios do not alter the composition of the teleost crown; therefore, we present a single summary of disparity and occupancy statistics for the clade (Supplementary Table S5). No crown teleosts are known from the Toarcian‒Callovian. When crown teleosts first appear in the fossil record during the Late Jurassic, they comprise small-bodied and fusiform taxa in the form of elopomorphs, euteleosts, and (possibly) crossognathiforms (but see Arratia and Tischlinger Reference Arratia and Tischlinger2010), all restricted to a relatively small region within the top left quadrant of morphospace (Figs. 3, 5A).
Crown teleost disparity more than doubles between the Late Jurassic and Berriasian‒Hauterivian (Fig. 5C), primarily driven by the appearance of osteoglossomorphs and otocephalans (Fig. 5A), which typically possess posteriorly inserting dorsal fins (negative RW2 scores) and more centrally inserting dorsal fins (positive RW2 scores), respectively (Supplementary Fig. S1). This increase in disparity is statistically significant (Supplementary Table S5), although it is not robust to Lagerstätten removal (Supplementary Table S5), because Late Jurassic crown teleosts are almost exclusively restricted to Lagerstätten (Supplementary Figs. S9A, S15A).
Between the Berriasian‒Hauterivian and Barremian‒Aptian, a slight increase in mean crown teleost disparity is observed (Fig. 5C). This increase is not statistically significant in any data set, but does occasionally coincide with a significant shift in morphospace occupancy (when Lagerstätten are retained, Supplementary Table S5). This is likely due to shifting densities of taxa between previously occupied regions (e.g., additional taxa within the upper left quadrant; Fig. 5A) and the appearance of the deep-bodied Araripichthys.
Removal of Lagerstätten from the Barremian‒Aptian has little effect on most occupied regions, with the exception of lone genera in novel regions (Supplementary Fig. S9A, extended data set; Supplementary Fig. S15A, original data set), suggesting that most of the morphological variation of crown teleosts had become established more broadly at this time.
Our final (Albian) bin shows a small and nonsignificant decline in crown teleost disparity compared with the previous bin (robust to the exclusion of Lagerstätten; Fig. 5C, Supplementary Fig. S9, Supplementary Table S5). This subtle decline coincides with a significant shift in occupation (compared with the Barremian‒Aptian) using the extended and original data set with Lagerstätten retained (Supplementary Table S5). Both patterns appear ultimately driven by a shift to predominantly marine sampling in the Albian. As a consequence, many fewer freshwater osteoglossomorphs (common in the bottom left quadrant of morphospace; Figs. 3, 5A) are sampled, reducing the overall spread of crown teleosts and altering their overall centroid relative to the preceding bin.
Stem Teleost Morphospace Occupancy and Patterns of Disparity
Scenarios 3 and 4 are identical for the composition of the teleost stem; thus, we omit plots and statistics for scenario 4. With Lagerstätten retained, all scenarios show an increase in stem teleost disparity between the Toarcian‒Callovian and Late Jurassic (Figs. 5D, 6D, Supplementary Figs. S8D, S12D‒S14D), yet this is only statistically significant in scenarios 1 and 2 due to the Late Jurassic appearance of many deep-bodied pycnodontiforms in Lagerstätten (Fig. 5A, D, Supplementary Fig. S8A, D, Supplementary Table S6). The magnitude of this increase is greatest in scenario 1 and associated with a significant shift in morphospace occupancy attributable to the rarity of articulated Toarcian‒Callovian pycnodontiforms (Supplementary Table S6). This shift is not apparent in scenario 2, due to the inclusion of Toarcian‒Callovian dapediiforms within teleosts. All scenarios with the extended data set then suggest the first two Early Cretaceous bins contain comparable disparity to that of the Late Jurassic, before undergoing a decline in the Albian (Figs. 5D, 6D, Supplementary Fig. S8D). However, this Albian decrease is only significant, and accompanied by a significant shift in occupation, in scenario 3 (Supplementary Table S6).
Crown and stem teleost occupancy and patterns of disparity, including their contribution to overall teleost disparity, between the Toarcian–Callovian and the Albian according to scenario 3 (identical to scenario 4 with respect to teleosts, as neither dapediiforms or pycnodontiforms are included as stem teleosts), using the extended sampling data set with Lagerstätten retained. See Fig. 5 legend for further details.

Removal of Lagerstätten considerably alters these patterns across all scenarios, most notably by reducing the magnitude of a Late Jurassic increase in disparity and removing statistical support for shifts in disparity or morphospace occupancy between the Callovian and Late Jurassic (Supplementary Figs. S9D‒S11D, S15D‒S17D, Supplementary Table S6). This occurs due to removal of many deep-bodied pycnodontiforms and a cluster of stem teleosts characterized by highly positive RW2 scores (e.g., Lehmanophorus, Siemensichthys) (Supplementary Figs. S9A‒S11A, S15A‒S17A).
The most common pattern shared between analyses is evidence of comparable (or occasionally slightly greater) disparity in our first two Early Cretaceous bins relative to the Late Jurassic, followed by evidence of a decline in the Albian (significant in scenario 3; e.g., Fig. 5D, Supplementary Fig. S9D). This Late Jurassic–Aptian interval is underpinned by the establishment of stem teleosts within three to four broad regions of morphospace (Fig. 5A): (1) aspidorhynchiforms, ichthyodectiforms, and apomorphy-defined teleosts that combine negative scores on RW1 with highly negative scores on RW2; (2) apomorphy-defined teleosts with moderately positive RW2 scores and negative RW1 scores; (3) various apomorphy-defined teleosts surrounding the origin of morphospace; and (4) pycnodontiforms with highly positive RW1 scores (scenarios 1 and 2 only). This pattern is altered in the Albian, driven by the loss of most phenotypes from the upper left quadrant, which may represent an extinction signal for some groups (discussed in the next section) (Fig. 5A). Loss of most stem teleosts from this quadrant represents a novel observation, given the recent reassignment of crossognathiforms from the teleost stem, previously associated with members of Varasichthyidae (Arratia Reference Arratia2008), to the teleost crown (Sferco et al. Reference Sferco, Lopez-Arbarello and Baez2015). This raises the prospect of whether other taxa within upper parts of the teleost stem, such as various “leptolepids,” might similarly be resolved as crown teleosts in future. Although further transfers of taxa from stem to crown could act to alter stem teleost patterns of disparity within pre-Albian Early Cretaceous bins, we suspect most changes would make little difference, because many genera in the top left quadrant of morphospace (e.g., Pholidophorus) likely branch relatively early on the teleost stem, and thus are unlikely to be reassigned to the crown.
Comparison of Stem and Crown Teleost Morphospace Occupancy and Disparity
Late Jurassic and Early Cretaceous crown teleosts largely revisit shapes previously discovered by stem teleosts (Supplementary Fig. S1). However, crown taxa generally fail to occupy the extremity combining highly negative RW1 and RW2 scores, as achieved by stem teleosts. This is best typified by aspidorhynchiforms (e.g., Belonostomus), but also seen in some ichthyodectiforms and pachycormiforms (Fig. 5A, Supplementary Fig. S1). On the contrary, it is possible that stem teleosts fail to obtain deep-bodied forms (highly positive RW1 scores); if neither dapediiforms nor pycnodontiforms are teleosts, the deep body form is unique to crown teleosts in our interval, due to a single genus (Araripichthys; Fig. 5A, Supplementary Fig. S1).
There are also regions where either stem/crown teleosts are common and the other extremely rare. The best example is otocephalans, several of which combine RW1 scores between 0 and 0.2 with positive RW2 scores (indicative of their moderately deep, hatchetfish-shaped body form with a dorsal fin inserting at midlength), while only one stem teleost (Pholidophoristion ovatus) explores this space (Supplementary Fig. S1). Another example might be within deep-bodied taxa, if pycnodontiforms or dapediiforms are stem teleosts (Supplementary Fig. S1), given Araripichthys represents the only deep-bodied crown teleost in our sampling interval.
In the first time bin where crown and stem teleosts coexist (Oxfordian–Tithonian), stem teleosts outnumber crown teleosts by a factor of three, possess significantly higher disparity, and occupy a significantly different region of morphospace than crown teleosts (Fig. 5A, Supplementary Table S7). These Oxfordian–Tithonian significant differences are erased upon Lagerstätten removal, as crown teleosts are reduced to three taxa (e.g., Supplementary Fig. S9, Supplementary Table S7). Scenarios 1 and 2 then indicate that stem teleosts remain significantly (or nearly so; p=0.052 in the Albian) more disparate than crown teleosts for the entire Early Cretaceous (Fig. 5C vs. D), although this is not robust to the removal of Lagerstätten (Supplementary Table S7). In scenario 3, where neither dapediiforms or pycnodontiforms are teleosts, crown teleosts are more disparate than stem teleosts across the Early Cretaceous (significantly in the Albian, a finding robust to Lagerstätten removal; Fig. 6C vs. D, Supplementary Fig. S11, Supplementary Table S7). All scenarios (extended data set) indicate that crown and stem teleosts occupied significantly different regions in the Barremian‒Aptian and Albian (Figs. 5A, 6A, Supplementary Fig. S8A, Supplementary Table S7), and while only the Albian difference is maintained after Lagerstätten removal in scenarios 1 and 2, both are robust in scenario 3 (Supplementary Table S7). The distinct morphospace occupation of crown and stem teleosts in the Albian is driven by the disappearance of particular groups from our sample. First, osteoglossomorphs with highly negative RW2 scores (particularly clear in the original data set; e.g., Supplementary Fig. S12A) are rare from Albian sediments, likely caused by a reduction in freshwater sites during this interval. Second, all but one stem teleost disappear from the upper left quadrant (Fig. 5A), an area previously occupied by “pholidophorids” sensu lato, pleuropholids, and “leptolepids.”Although this region was not heavily populated by stem teleosts in the Early Cretaceous, the Albian absence of Pholiodophoridae sensu lato and clearly identifiable Leptolepidae sensu lato phenotypes is consistent with their documented last appearances (Patterson Reference Patterson1993b) and so might represent a genuine extinction signal. Pleuropholids, however, extend into the Albian (Giordano et al. Reference Giordano, Succar, Codorniú, Cione and Arratia2017).
The Contribution of Crown and Stem Teleosts to Overall Teleost Disparity
Disparity trajectories for the crown and stem, coupled with examination of partial disparity (which considers both of the position of taxa and their relative numbers), illuminate their respective contribution to overall teleost morphological diversity (Fig. 5). The most conspicuous feature of teleost disparity in scenarios 1 and 2 is the significant increase between the Toarcian‒Callovian and Late Jurassic and the associated significant shift in morphospace occupation (Fig. 5B, Supplementary Table S3). Partial disparity reveals that stem teleosts are primarily responsible for the Late Jurassic increase (Fig. 5E), which likely occurs due to the appearance of high numbers of pycnodontiforms. Crown teleosts, however, contribute little to Late Jurassic teleost disparity (Fig. 5E), because they are few in number and positioned close to a region densely populated by stem teleosts (Fig. 5A). However, Cretaceous expansions in crown teleost variety, combined with increases in their numbers to levels comparable with stem teleosts, raise their contribution to overall teleost disparity to ~45% by the Barremian‒Aptian (Fig. 5E). Despite these crown teleost expansions and taxonomic diversification, stem teleosts maintain high mean disparity across the Early Cretaceous (Fig. 5D), albeit with large confidence intervals. With or without Lagerstätten, stem teleosts therefore continue to make a substantial contribution to overall Late Jurassic and Early Cretaceous teleost disparity (e.g., Fig. 5, Supplementary Fig. S9). Critically, mean teleost disparity would not exceed that of holosteans in the Early Cretaceous (Fig. 4A, B) without stem teleosts in general and pycnodontiforms in particular. Thus, in scenarios 1 and 2, stem teleosts are essential for even a modest teleost “dominant” phase to occur in the Early Cretaceous.
In scenarios 3 and 4, where neither dapediiforms nor pycnodontiforms are stem teleosts, absence of these taxa in phenotype and numbers lowers the importance of stem teleosts, and instead crown teleosts contribute a majority of overall teleost disparity from the Berriasian‒Hauterivian onward (Fig. 6E). Nevertheless, stem teleosts still make a substantial contribution (>25%) to overall teleost disparity throughout the Early Cretaceous. This is particularly clear in the Albian, where despite a fall in the disparity and taxonomic diversity of stem teleosts (Fig. 6D), they continue to contribute a comparable proportion of overall teleost disparity compared with previous Early Cretaceous bins (Fig. 6E).
Main Influence of Lagerstätten
Lagerstätten may influence disparity measures in many ways beyond inflation of sample size, making it challenging to account for them. For instance, Lagerstätten may represent environments of elevated biodiversity and may preserve species and ecologies not commonly found elsewhere. We find two main impacts of Lagerstätten in this study, focusing primarily upon our extended sampling data sets.
The most conspicuous instance of Lagerstätten altering our patterns occurs in the Late Jurassic, which includes the famous deposits of Solnhofen and Cerin. Removal of these sites (and others containing more than 10 articulated taxa) radically alter our taxonomic sample, reducing the Late Jurassic peak in sampled richness for both holosteans and teleosts to levels comparable with other bins (Fig. 1). In contrast, removal of Late Jurassic Lagerstätten impacts holostean and teleost disparity differently; teleost disparity is reduced (all scenarios), while holostean disparity is commonly (scenarios 1–3) unaffected (compare Supplementary Fig. S6A with S6B; but note that in scenario 4, when dapediiforms and pycnodontiforms are holosteans, all post–Middle Jurassic holostean disparity values are lowered by Lagerstätten removal). This highlights the potential for different clades, even those that we expect to have similar preservation potentials, to show different responses to the removal or retention of exceptional sites. In our case, this is likely driven by a more cosmopolitan distribution of holostean phenotypes in the Late Jurassic, while teleost phenotypes are more heavily partitioned between particular Lagerstätten and/or depositional environments at this time.
A second notable impact of Lagerstätten removal occurs throughout the Early Cretaceous. Removal of exceptional sites lowers our taxonomic sample of holosteans but especially teleosts across the Early Cretaceous (Fig. 1). Removal most notably alters patterns of disparity by lowering Albian disparity for both holosteans and teleosts, erasing signal of disparity increases during the Albian (Supplementary Fig. S6A, B). Removal achieves this by reducing the density of taxa in extreme regions of morphospace (albeit these regions had already been established before the Albian, e.g., the bottom left quadrant extremity; compare Supplementary Fig. S2 with S3). This illustrates how the effects of Lagerstätten removal may differ between regions of morphospace. Therefore, the Albian reduction of disparity does not occur due to removal of large numbers of completely novel body shapes for holosteans and teleosts (Fig. 3), as might have been expected given the proposed evolution of novel neopterygian ecologies during the Albian (Poyato-Ariza and Martín-Abad Reference Poyato-Ariza and Martín-Abad2016).
Discussion
Uncertainty Regarding Early‒Middle Mesozoic Holostean Phenotypic “Dominance”
Any indication of a phase of holostean phenotypic “dominance” relative to teleosts is highly sensitive to the placement of dapediiforms and pycnodontiforms. For instance, for the most commonly cited phylogenetic scenarios (1 and 2; Fig. 4A, B), there is no statistical evidence for a phenotypically “dominant” holostean phase at any point in the Mesozoic. Low sample sizes for Triassic teleosts mean that higher observed disparity values for holosteans are not statistically distinguishable from those of teleosts. However, higher holostean disparity in the Induan‒Anisian and Ladinian‒Carnian might become significant if new teleost discoveries of this age remain as phenotypically conservative as recent finds (e.g., Tintori et al. Reference Tintori, Sun, Ni, Lombardo, Jiang and Motani2015; Sun et al. Reference Sun, Tintori, Lombardo and Jiang2016). Scenarios 3 and 4 (Fig. 4C, D) show a pattern reminiscent of the perceived Triassic and Jurassic holostean “dominance” of previous accounts (statistically significant between the Norian‒Rhaetian and the Late Jurassic; Supplementary Table S4) in spite of changes in aspects of the taxonomic framework, our use of a total-group definition, and substantial new fossil finds. However, only in scenario 4, and only with Lagerstätten retained, do we find that statistically greater holostean disparity is maintained into the Berrasian‒Aptian period (Fig. 4D, Supplementary Fig. S6, Supplementary Table S4).
Stable Holostean Variety from the Toarcian‒Callovian Onward
All scenarios resemble previous descriptions and depictions of low-variety holostean beginnings before phenotypic expansion in the Late Triassic and Jurassic (Romer Reference Romer1966; Colbert Reference Colbert1969; Carroll Reference Carroll1988), despite taxonomic revisions and new fossils. Low phenotypic variety is seen for holosteans during the Induan–Carnian, because most representatives of all holostean clades (e.g., parasemionotiforms, ionoscopiforms, and other halecomorphs and ginglymodians) surround the origin of morphospace at high density, with only rare outliers, such as the ginglymodian Kyphosichthys (the first deep-bodied crown neopterygian). This relatively low disparity period for holosteans ends either in the Norian‒Rhaetian (if dapediiforms and/or pycnodontiforms are holosteans) or the Toarcian‒Callovian (Fig. 4).
Our study removes some of the ambiguity surrounding patterns of holostean variety in the Early Cretaceous. We find little evidence for substantive holostean losses from particular regions of morphospace through time, and no clear decline in holostean disparity from the Toarcian onward under any scenario (Figs. 3, 4, Supplementary Fig. S6). These data at least offer some quantitative evidence that the attainment of various new teleost phenotypes throughout the Triassic, Jurassic, and Early Cretaceous (e.g., Fig. 3) did not coincide with substantive losses of analogous holostean body shapes, as might be expected under scenarios that discuss the replacement of holosteans by ecologically and phenotypically similar teleosts (Colbert Reference Colbert1969; Senn Reference Senn1996; Poyato-Ariza and Martín-Abad Reference Poyato-Ariza and Martín-Abad2016). One potential exception would be the apparent loss of deep-bodied holosteans at the end of the Jurassic while deep-bodied teleosts persist, if scenario 1 proves to be correct and dapediiforms are holosteans and pycnodontiforms are teleosts (e.g., Supplementary Fig. S2).
Replacing any potential for a holostean phenotypic decline, the most common pattern is maintained variety in holosteans from the Toarcian‒Callovian throughout the Early Cretaceous. Holosteans begin this interval of sustained levels of disparity in Toarican‒Callovian due to: (1) a less dense cluster at the origin; (2) retaining taxa near the extremes of realized holostean shape space (e.g., a macrosemiiform, the ionoscopiform Congophiopsis; and in scenarios 1, 3, and 4, dapediiforms/dapediiforms and pycnodontiforms); and (3) the appearance of new extremities, such as an elongate species of Furo, and the appearance of the lepisosteiform Isanichthys. Few substantive expansions into completely novel regions of morphospace occur after the Toarcian‒Callovian within our time series, with notable exceptions restricted to Lagerstätten. These exceptions include the wide variety of macrosemiiforms (Fig. 3; and potentially pycnodontiforms also if they are holosteans as depicted under scenario 4) in the Late Jurassic deposits of Solnhofen and Cerin, and the slender predator Calamopleurus (combining highly negative and positive scores on RW1 and RW2, respectively) alongside early gars (Obaichthys, Dentilepisosteus) in Albian Lagerstätten (Fig. 3). The rarity of expansions into completely novel shape regions, and the low species diversity of the expansions that do occur, help explain why most scenarios depict relatively stable levels of disparity from the Toarican‒Callovian onward, with any perceived abrupt (scenarios 2 and 4, original data set) or gradual (scenario 4, extended data set) increases in disparity after this time attributable to a failure to include fragmentary specimens and morphologies known to persist based on range data, and by changing densities of taxa between already established morphologies. Nevertheless, the expansion in holostean phenotypes in the Albian Lagerstätten commonly causes an overall increase in disparity (Supplementary Fig. S6A) during a proposed “mid” Cretaceous ecological expansion argued for teleosts (Poyato-Ariza and Martín-Abad Reference Poyato-Ariza and Martín-Abad2016; but see this examined for teleosts in the sections immediately below), opening the possibility that any expansion of shapes and ecologies at this time may have been a more general phenomenon.
The Predominantly Gradual Expansion of Teleost Phenotype and Ecology
Morphologically Conservative Induan‒Carnian Teleosts and Ambiguous Norian‒Rhaetian Patterns
We sought to determine whether the phenotypic variety of teleosts increased in a gradual or punctuated fashion in their early history. Teleosts are morphologically highly conservative in the Induan‒Carnian (Fig. 3), reflected by consistently low disparity values (Fig. 4). Therefore, regardless of new fossil finds (from both Europe and China) and changes to the taxonomy, the first 25 million years of teleost history agree with a low-disparity “teleost fuse” model implied by previous workers (Romer Reference Romer1966; Colbert Reference Colbert1969; Carroll Reference Carroll1988; Poyato-Ariza and Martín-Abad Reference Poyato-Ariza and Martín-Abad2016). Taxonomic uncertainty regarding dapediiforms and pycnodontiforms heavily influences disparity values after the Carnian. Three scenarios show gradual increases in mean disparity throughout the Jurassic until an Early Cretaceous plateau, yet they differ on whether Norian–Rhaetian disparity shows no increase (Fig. 4C, D) or some highly uncertain degree of increase (Fig. 4A). In contrast, scenario 2 depicts a sudden Norian‒Rhaetian rise followed by a relative disparity plateau (Fig. 4B). Therefore, although most phylogenetic scenarios indicate predominantly gradual rises in teleost disparity values, further systematic work will determine whether it is possible to argue for an abrupt increase in teleost disparity early in the Mesozoic. However, it is important to note that any potentially abrupt Norian‒Rhaetian increase is underpinned by a highly disjunct distribution, with deep-bodied taxa highly separated from fusiform taxa, and therefore would represent a different phenomenon to previous conceptualizations of an abrupt rise of teleosts to phenotypic prominence, specifically, a rapid yet much broader filling of morphospace and ecospace in the “mid” to Late Cretaceous (e.g., Poyato-Ariza and Martín-Abad Reference Poyato-Ariza and Martín-Abad2016). Beyond examination of disparity values in isolation, inspection of teleost morphospace highlights a feature shared by all scenarios: bin-by-bin colonization of novel regions of shape space from the Norian‒Rhaetian onward. Furthermore, these novel phenotypic expansions appear to be associated with functional traits suggestive of novel ecologies, and we detail these successive expansions immediately below.
Late Triassic and Early Jurassic Expansions of Teleost Morphospace
The (scenario-dependent) appearance of pycnodontiforms and dapediiforms would represent the first deep-bodied teleost morphology and associated novel ecologies. Pycnodontiforms possess a jaw structure, heterodonty, and molariform dentition (e.g., Brembodus) suggestive of a variety of feeding modes that involve prey manipulation, including the potential for durophagy (Poyato-Ariza Reference Poyato-Ariza2005). Dapediiforms also possess these features, suggestive of some ecological overlap, but differences in paleoenvironmental association also suggest a more generalist mode of life (Smithwick Reference Smithwick2015). Even if neither dapediiforms nor pycnodontiforms are teleosts, Late Triassic expansions in shape variety still occur due to many “pholidophorids” sensu lato in the upper left quadrant of morphospace during the Norian‒Rhaetian, followed by the further spread of these taxa within that same quadrant during the Hettangian‒Pleinsbachian. Both expansions in shape variety result in statistically significant changes (significant shifts in occupation relative to previous bins in both instances, and a significant disparity increase in the latter instance; Supplementary Table S3, scenario 3). Thus, Late Triassic and Early Jurassic changes in teleost morphological diversity are clear despite taxonomic uncertainties.
New teleost shapes and ecologies appear in the form of varied Toarcian pachycormiforms (Fig. 3) with at least two distinct predatory modes. These include taxa with elongated needle-like teeth (e.g., Pachycormus) and Ohmdenia, which combines a large gape with rows of stout, low-crowned teeth, traits comparable to marine taxa with diets of soft-bodied cephalopods (Friedman Reference Friedman2012). These predatory taxa are soon followed by the first suspension-feeding pachycormiform (Bajocian: Friedman et al. [Reference Friedman, Shimada, Martin, Everhart, Liston, Maltese and Triebold2010]; not included within our data set, but consistent with the gradual appearance of new phenotypes and ecologies), fragmentary evidence of elongate predatory aspidorhynchiforms from the Bathonian of England (Woodward Reference Woodward1890), the first articulated ichthyodectiform (Bathonian: Occithrissops wilsoni) with a suspected microphagous diet (Schaeffer and Patterson Reference Schaeffer and Patterson1984), and additional large, suspension-feeding pachycormids (Callovian: Leedsichthys and Martillichthys [Liston Reference Liston2008]).
The first fully articulated aspidorhynchiforms (longirostrine predators Aspidorhynchus and Belonostomus) appear in the Late Jurassic (Fig. 3), with tooth morphology and gut contents revealing piscivorous diets (Maisey Reference Maisey1994; Kogan and Licht Reference Kogan and Licht2013; Ebert et al. Reference Ebert, Kolbl-Ebert and Lane2015). Another Late Jurassic innovation are ichthyodectiforms exhibiting elongate bodies and hypurostegy, the latter suggestive of an open-water sustained-swimming lifestyle (Cavin et al. Reference Cavin, Forey and Giersch2013b). Among these are low-level predators showing evidence of microphagous diets (e.g., Allothrissops) and midlevel predators (e.g., Thrissops) with stomach contents indicating a piscivorous diet (Patterson and Rosen Reference Patterson and Rosen1977; Ebert et al. Reference Ebert, Kolbl-Ebert and Lane2015) more typical of Cretaceous ichthyodectiforms (Cavin et al. Reference Cavin, Forey and Giersch2013b). In addition, four stem teleosts (Lehmanophorus, Siemensichthys, Pholidophoristion and Ankylophorus) appear in a novel region in the upper left quadrant of morphospace (most positive RW2 values of our teleost sample; Fig. 3). Crown teleosts also appear (elopomorphs, crossognathiforms, otocephalans, euteleosts; Fig. 3) and among these, euteleosts and a single crossognathiform discover a never before occupied region of teleost morphospace (Fig. 3).
Earliest Cretaceous Morphospace Expansions Are Not Sustained
Stem teleost morphospace occupancy in the Berriasian‒Hauterivian is comparable to that of the Late Jurassic (Fig. 5A). By contrast, crown teleosts expand upon their Late Jurassic variety, evolving shapes comparable to stem teleosts, but also unlocking novel regions of shape space for the teleost total- group. Osteoglossomorphs represent one such novel expansion, combining slightly deepened bodies with dorsal and anal fins positioned highly posteriorly (e.g., Aokiichthys and Yungkangichthys, bottom right quadrant; Fig. 3). Another addition is the hatchetfish-like body form (upper right quadrant; Fig. 3), represented by ellimmichthyiform cluepeomorphs such as Ezkutuberezi and Diplomystus.
Berriasian–Hauterivian teleost morphospace is little expanded upon for the rest of the Early Cretaceous, as new taxa largely re-explore established regions (Fig. 5A). The subtle expansions that do occur are typically restricted to Lagerstätten sites and led by single genera (see “Results”). Therefore any observed (nonsignificant) disparity increases occasionally seen in the Early Cretaceous (e.g., Supplementary Fig. S6, Supplementary Table S3) are driven by differing numbers of taxa within previously occupied regions (altering the variance statistic), not by substantial expansions. This pattern of maintained occupancy with little subsequent expansion is analogous to that displayed by holosteans, which exhibit mostly stable variety from the Toarcian onward.
Substantial Phenotypic Variation in Apomorphy-defined Teleosts and Their Potential Ecological Variety
Early apomorphy-defined teleosts (Arratia Reference Arratia1999, Reference Arratia2001; the clade currently delimited at the divergence of the first pholidophoriforms from all other teleosts) from the Triassic‒Early Cretaceous, which includes both stem and crown teleosts, have invariably been depicted and discussed as highly phenotypically conservative (e.g., Romer Reference Romer1966; Carroll Reference Carroll1988; Benton Reference Benton2015; Poyato-Ariza and Martín-Abad Reference Poyato-Ariza and Martín-Abad2016); with the potential exception of some Aptian‒Albian taxa, if a proposed ecological expansion proposed in Poyato-Ariza and Martín-Abad (Reference Poyato-Ariza and Martín-Abad2016) translates into shape and fin variation. By contrast, we reveal substantial variety in shape and fin position within Triassic‒Early Cretaceous apomorphy-defined teleosts, given these taxa were widely spread across the full length of RW2 and approximately half the length of RW1 before the Aptian (□ and×symbols colored orange/with lightest shading, and all symbols which appear red/with intermediate shading for crown teleosts, Fig. 3, Supplementary Fig. S1). Much of this range remains intact, even if we consider only pre-Aptian taxa and exclude ichthyodectiforms (× symbols colored orange/with lightest shading, cited as the exception to the conservative rule in Poyato-Ariza and Martín-Abad [Reference Poyato-Ariza and Martín-Abad2016]; Figs. 3, 5). Furthermore, many of the expansions of total-group teleosts into novel regions of morphospace (outlined in the “Discussion” section immediately above) were driven by apomorphy-defined taxa, notably, the appearance of some “pholidophorids” sensu lato in the upper left quadrant (Norian‒Rhaetian); further expansion within that quadrant (Hettangian‒Pleinsbachian); the appearance of taxa in the bottom left quadrant alongside ichthyodectiforms (Toarcian‒Callovian); followed by their unique (within our data set) occupation of the most positive RW2 scores in the Late Jurassic and further expansions into positive RW1 scores by osteoglossomorphs and otocephalans in the Berriasian–Hauterivian (Fig. 3). Thus, we establish that apomorphy-defined teleosts did not experience a prolonged period of consistently low body-shape disparity before the Aptian, as might be expected under some characterizations of a long-fuse model for their phenotypic diversification. Beyond this, we can ask whether the appearances of many completely novel shapes occur in the Aptian‒Albian. Although our Lagerstätten-removed data sets reveal no substantive increases in apomorphy-defined teleost shape disparity (Fig. 4), it is clear that some novel holostean and teleost shapes do appear in the Aptian‒Albian, but that they typically rare and restricted to Lagerstätten (e.g., the first gar-like holosteans, combining highly negative RW1 and RW2 scores; Fig. 3). Although these taxa coincide with successive (nonsignificant, Supplementary Tables S2, S3) increases in disparity during the Berrasian‒Aptian and Albian when Lagerstätten are retained (Supplementary Fig. S6), it is not clear that these rare novel shapes are responsible. For instance, the Albian increase in disparity appears to be primarily driven by the lower density of taxa within central regions of holostean and teleost morphospace in the Albian compared with the Berrasian‒Aptian (compare central regions of respective holostean and teleost convex hulls; Supplementary Fig. S2).
It is useful to compare our findings with those of Poyato-Ariza and Martín-Abad (Reference Poyato-Ariza and Martín-Abad2016), who provided a broad framework for ecological variety in Mesozoic neopterygians. Although there are substantive differences in approach and taxon sampling between our two studies (body morphometry sampling of most articulated neopterygian species vs. assignment of taxa to three broad ecological categories for significant Lagerstätten), both provide complementary perspectives to document the accumulation of teleost ecomorphological variety.
Using an apomorphy-defined Teleostei, Poyato-Ariza and Martín-Abad (Reference Poyato-Ariza and Martín-Abad2016) argued that teleosts (excluding ichthyodectiforms) were likely restricted to planktonic/detritivore suction-feeding primary consumer roles before the Aptian‒Albian, at which time teleosts expanded into higher trophic-level durophagous and piscivorous niches. It almost need not be stated that a total-group teleost definition would revise this narrative, as teleosts (scenario dependent) would have occupied durophagous (pycnodontiforms and/or dapediiforms) and large piscivorous roles (pachycormiforms and aspidorhynchiforms) before the Aptian. Nevertheless, it is still valid to ask whether those apomorphy-defined teleosts, which represent the vast majority of Mesozoic teleost species, were relatively ecologically conservative and/or restricted to lower trophic levels before the Aptian.
Our data capturing overall shape and fin position revealed a low-variety phase in apomorphy-defined teleost body shape (□ and×symbols colored orange/with lightest shading [stem teleosts within apomorphy-defined teleosts] and all symbols that appear red/with intermediate shading [crown teleosts]; Fig. 3) across the Triassic, followed by gradual increases in shape variety thereafter, until the Hauterivian, after which most taxa appear restricted to previously occupied body shapes, with a few key exceptions within Lagerstätten (Fig. 3). Thus, despite global sampling, we do not discover substantial Aptian–Albian expansions in morphospace outside of Lagerstätten that we might expect to accompany a broad ecological expansion. There are three potential reasons for this. First, it could be that novel expansions in ecology do certainly occur, but they are relatively rare and are mostly restricted to Lagerstätten, and so are not indicative of a much broader phenomenon. Our data provide some evidence for this, given rare but novel shapes are preserved within Aptian‒Albian Lagerstätten, such as Chardonius longicaudatus, with the most positive RW2 score in our data set, and Obaichthys decoratus, among the first gar-like morphologies seen in holosteans, combining highly negative RW1 and RW2 scores (Fig. 3). If this phenomenon is apparent in our shape data, it could also be true of other measures of ecology, such as feeding capabilities.
Second, it could be that ecological variety does accumulate more rapidly in the Aptian–Albian, but it is poorly captured by body shape. For instance, expansions into piscivory and durophagy were stated to have occurred within elopomorphs (Poyato-Ariza and Martín-Abad Reference Poyato-Ariza and Martín-Abad2016), but elopomorphs do not show substantial increases in body-shape diversity (Fig. 2; with the exception of Brannerion, possessing the most positive RW1 score of any elopomorph). This observation is not surprising, given that many feeding ecologies, particularly those of lower trophic levels, can show little shape disparity in modern-day systems (e.g., African lake cichlids: Chakrabarty [Reference Chakrabarty2005]).
Third, it could be that greater ecological diversity had already accumulated before the Aptian–Albian, and so these bins only make minor additions. Even assuming a loose relationship between body shape and fin position with locomotor ecology, our data suggest apomorphy-defined taxa would have accumulated many ecologies throughout the Jurassic and Early Cretaceous. Furthermore, the literature suggests these taxa occupied feeding ecologies beyond suction-feeding, primary consumer niches. For instance, Viohl (Reference Viohl1990) examined the mouth and gut contents of Solnhofen fishes and determined that eight apomorphy-defined teleost species showed evidence of piscivory (only four were ichthyodectiforms). In Ettling alone, 11 apomorphy-defined teleost species (excluding ichthyodectiforms) were considered as mid- to low-level predators including some as opportunistic piscivores (Ebert et al. Reference Ebert, Kolbl-Ebert and Lane2015). These authors also noted that Leptolepides, Orthogonikleithrus hoelli, and Tharsis lack the long gill rakers often associated with suspension feeding and favored instead the hypotheses that they were zooplanktivores (and opportunistic piscivores, as seen in Orthogonikleithrus hoelli) that employed vision-driven feeding on single, targeted prey items (Ebert et al. Reference Ebert, Kolbl-Ebert and Lane2015). There is also potential for large but rare apomorphy-defined teleosts before the Aptian, such as Arratiaelops (~1 m standard length) from the Barremian‒Aptian of Bernissart and Tischlingerichthys (~38 cm standard length, BSPG-1977-XIX-30) from the Tithonian of Solnhofen.
Taken together, these past studies and our findings imply that, although apomorphy-defined teleosts appear restricted to the lower and middle trophic levels for much of the Triassic‒Early Cretaceous (with larger taxa appearing at greater frequency throughout the Early Cretaceous), these smaller taxa could have been accumulating considerable ecological variety in locomotor and feeding ecology. It is also possible that our body-shape data underestimate this functional and ecological variety, given that lower trophic levels can show less body-shape disparity than piscivorous niches (Chakrabarty Reference Chakrabarty2005). Furthermore, it can often be difficult to infer diet from morphology in these lower trophic levels, a decoupling which is thought to enhance their potential to accumulate biological diversity (Bellwood et al. Reference Bellwood, Wainwright, Fulton and Hoey2006). We might even expect enhanced diversification of feeding ecologies within niches at this level, owing to the higher productivity and carrying capacity of lower trophic levels in food webs. Potentially, domination of this suite of productive ecological roles by teleosts may provide some explanation toward long-term teleost evolutionary success and continued diversification, while a failure of holosteans to capitalize or remain in these niches (potentially previously occupied by smaller holostean taxa, particularly common in the Early and Middle Triassic) may have undermined their long-term diversification potential.
A way forward to test between the scenarios outlined would be to build on the strengths of both studies and devise a quantitative scheme of traits targeting trophic level and feeding ecology. This could act as a test of our proposal that Triassic, Jurassic, and earliest Cretaceous apomorphy-defined teleosts accumulated ecomorphotypes gradually, and as a test of whether or not the apparent decline in the acquisition of novel body shapes outside of Lagerstätten after the Hauterivian also reflects a decline in the acquisition of novel feeding ecologies at this time.
The Long-Term Significance of Stem Teleosts
Despite the expansion of crown teleost variety between Late Jurassic and Berriasian‒Hauterivian deposits (Figs. 3, 5C), stem teleosts remained important contributors to overall teleost disparity throughout the Early Cretaceous, consistently contributing either 50% or more (with pycnodontiforms) or ~25% or more (without pycnodontiforms) in terms of their share of partial disparity (Figs. 5D, 6D). This pattern is driven by consistent occupation of the bottom left extremity (aspidorhynchiforms and ichthyodectiforms) and (scenario-dependent) highly positive RW1 extremity (pycnodontiforms and/or dapediiforms). These regions remain occupied even upon Lagerstätten removal (Supplementary Fig. S3) and a dramatic shift in sampling regime from a marine-dominated Late Jurassic record to a freshwater-dominated Berrasian‒Aptian record (Cavin et al. Reference Cavin, Forey and Lecuyer2007; Guinot and Cavin Reference Guinot and Cavin2015). The latter is partly explained by the appearance of freshwater taxa within clades that were previously exclusively marine, as evidenced by the chuhsiungichthyid ichthyodectiforms from fresh and brackish waters of eastern Asia (Kim et al. Reference Kim, Chang, Wu and Kim2014) and pycnodontiforms from El Montsec (Kriwet et al. Reference Kriwet, Poyato-Ariza and Wenz1999) and Las Hoyas (Poyato-Ariza and Wenz Reference Poyato-Ariza and Wenz2004).
Critically, it is only with stem teleosts, and only when pycnodontiforms are stem teleosts, that teleost mean disparity exceeds that of holosteans across the Early Cretaceous (Fig. 4A, B; albeit not statistically significant; Supplementary Table S4). This remains true even in the Albian, when pleuropholids and “pholidophorids” sensu lato in the upper left quadrant of morphospace are absent. Nevertheless, we expect any remaining Albian stem teleost clades to contribute substantially to teleost disparity throughout the Late Cretaceous, given these phenotypic outlier clades show remarkable persistence and continue to expand their variety of morphologies (e.g., Marrama et al. Reference Marrama, Villier, Dalla Vecchia and Carnevale2016), with aspidorhynchiforms and ichthyodectiforms ranging to the Cretaceous‒Paleogene boundary (Friedman Reference Friedman2009) and (potentially teleost) pycnodontiforms ranging to the Eocene (Poyato-Ariza and Wenz Reference Poyato-Ariza and Wenz2002).
Potential for Older Appearances of Neopterygian Phenotypes and Ecologies
It is probable that many neopterygian phenotypes and ecologies arose earlier than documented here. Regarding teleosts, some clades recovered from Lagerstätten already appear to have undergone considerable diversification. Notable examples include: (1) the large diversity of pycnodontiforms and ichthyodectiforms, alongside the first appearance of elopomorphs, crossognathiforms, otocephalans, and euteleosts in Late Jurassic Plattenkalks; and (2) the considerable variety in pachycormiform body size and feeding ecology present upon their first appearance in the Toarcian (Friedman Reference Friedman2012). Both examples hint at the earlier origin of many taxa and phenotypes, and should encourage renewed focus on Middle Jurassic and pre-Toarcian deposits.
Nonoverlapping biogeographic sampling in the Jurassic and Cretaceous, particularly for freshwater sites whose diversity we might expect to be more geographically restricted, leave open the possibility that freshwater osteoglossomorph and otocephalan phenotypes might have appeared before the Cretaceous. Exhibiting considerable phenotypic variation in the Berriasian‒Hauterivian (Fig. 5A), these clades derive from freshwater deposits in Israel (Wadi-el-Malih), Japan (Wakino subgroup), Spain (El Montsec), and eastern China (Fenshuiling Formation). By contrast, Late Jurassic freshwater sites well sampled for fishes are located in Brazil (Pastos Bons Formation), Australia (Talbragar), and Kazakhstan (Karatau). Therefore, if these osteoglossomorphs and otocephalan clades were geographically restricted, it may be that the lack of freshwater sites sampled for fishes from comparable regions of the globe either side of the Jurassic/Cretaceous boundary contributes to their apparent absence in the Jurassic. Eastern Thailand offers an exception, where Late Jurassic and Berrasian freshwater deposits have been found (Cavin et al. Reference Cavin, Deesri and Suteethorn2013a; Deesri et al. Reference Deesri, Lauprasert, Suteethorn, Wongko and Cavin2014, Reference Deesri, Jintasakul and Cavin2016). However, these sites are dominated by lepisosteiforms, with no evidence of crown teleosts, despite systematic excavations and sieving. Detailed examination of Jurassic freshwater sites in comparable regions to earliest Cretaceous sampling will help to inform our confidence regarding the origins of these freshwater clades.
Finally, there are instances where ghost ranges permit particularly impactful revisions to the accumulation of teleost phenotypes. The oldest total-group teleost fossils are Ladinian in age (Arratia Reference Arratia2013, Reference Arratia2017), yet aspidorhynchiforms, pachycormiforms, and pycnodontiforms (or a dapediiforms + pycnodontiforms clade) are inferred to have diverged before these Ladinian teleosts (Arratia Reference Arratia2013). This opens up the possibility that the distinctive phenotypes of these clades existed before the Ladinian, potentially invoking a rapid accumulation of extreme phenotypes in the latest Permian to earliest Triassic teleosts. However, it is also possible that Triassic representatives of these lineages were either phenotypically similar to other Triassic teleosts or possessed less extreme transitional morphologies, permitting a more gradual phenotypic expansion. Better resolved phylogenies regarding the interrelationships of these phenotypically divergent clades, combined with additional fossil sampling from a greater variety of Triassic sites, should provide clearer constraints on the early morphological variety of teleosts.
Regarding holosteans, we highlight five areas that hint at the earlier origin of specific phenotypes. The first three pertain to clades that contain high richness within a single stage, which may suggest an earlier appearance of some of their constituent phenotypic variety. Conspicuous examples include parasemionotiforms of the Olenekian, ionoscopiforms of the Ladinian, and macrosemiiforms of the Kimmeridgian. Alternatively, these apparently sudden appearances of diversified clades may prove to be an artifact of inadequate systematic revision (e.g., parasemionotiforms), allowing the erection of dubious species and/or the definition of clades on few characters. Fourth, the Permian (Wuchiapingian) taxon Acentrophorus, a potential candidate for the oldest crown neopterygian, has been aligned with the semionotids sensu lato on overall resemblance (e.g., Gill Reference Gill1923; Rayner Reference Rayner1941; Patterson Reference Patterson1973) but has not been subject to cladistic study or demonstrated to possess specific features that would unambiguously place it within crown Neopterygii, Holostei, or Ginglymodi (Olsen and McCune Reference Olsen and McCune1991; Benton et al. Reference Benton, Donoghue, Asher, Friedman, Near and Vinther2015). If future study resolves Acentrophorus within Holostei, its precise position will determine which lineages, and potentially phenotypes, might extend into the Permian. Fifth, dapediiforms have been placed as the sister to all other Ginglymodi (including Anisian representatives) in recent cladistic analyses (e.g., Bermudez-Rochas and Poyato-Ariza Reference Bermudez-Rochas and Poyato-Ariza2015; Gibson Reference Gibson2016). This ghost range leaves open the possibility that either dapediiform morphologies (and perhaps pycnodontiform morphologies, if sister to dapediiforms; scenario 4) may be Anisian or older (resolution of Acentrophorus as a semionotid would extend this ghost range to the Permian). However, it is also possible that these potential earlier, unknown members of dapediiform or pycnodontiform lineages were similar in body form to other Early Triassic holosteans. Overall, an improved phylogenetic framework for early-diverging holosteans, combined with excavations of late Permian and Early Triassic sites, should better constrain early holostean phenotypic variety.
Conclusions
We examined three central questions. First, we assessed evidence for a phenotypically “dominant” holostean phase, and found that a Norian‒Callovian period of statistically greater disparity in holosteans relative to teleosts only occurs if dapediiforms are holosteans. Further, all taxonomic scenarios show no decline in holostean disparity from the Toarcian‒Callovian onward yet also recover little evidence of substantive phenotypic expansions after this period.
Second, we assessed whether the accumulation of teleost phenotypes was predominantly sudden or gradual and found that after an initial period of low variety (Anisian‒Carnian), teleosts continually discovered (and retained) novel regions of morphospace in a predominantly gradual manner between the Norian and Hauterivian, showing only minor expansions thereafter. We also highlight that novel ecologies accompany these phenotypic expansions. Furthermore, in contrast to depictions in most paleontological accounts, we find considerable variation in body shape and fin position in apomorphy-defined teleosts, even when ichthyodectiforms are excluded.
Third, we captured a substantial expansion in crown teleost phenotypes between the Late Jurassic and earliest Cretaceous, mostly driven by the appearance of freshwater otocephalans and osteoglossomorphs. Despite increases in crown teleost disparity and taxon counts, we demonstrate that stem teleosts remain important contributors to overall teleost disparity throughout the Early Cretaceous.
Our study reveals that the stark phenotypic chasm between holosteans and teleosts seen in the Recent had not emerged with any certainty even after 150 million years (60%) of their joint evolutionary history. Nevertheless, there are differences in their patterns of disparity and morphospace occupation that may provide clues to their differing long-term trajectories. While holostean variety increased little beyond the Early‒Middle Jurassic, teleosts continually expanded their variety until the earliest Cretaceous, but then similarly stalled. However, teleosts appear to dominate lower to middle trophic levels relative to holosteans, trophic levels whose ecological variation may only be partially captured by overall body shape and fin position. Therefore it is possible that teleosts continued to accumulate ecological variety beyond the Hauterivian.
Finally, we consider what might follow if our patterns of disparity were extended to the Recent. We expect further increases in holostean disparity in the Late Cretaceous, as phenotypes surrounding the origin are thinned and new extremities obtained. Extremities include phenotypic analogues to bowfin and gar, alongside highly elongate, eel-like morphologies (Aphanepygus: likely macrosemiiform [Bartram Reference Bartram1977; Murray and Wilson Reference Murray and Wilson2009]), and forms possibly suited to deep-sea environments, with large eyes and fangs (Tomognathus: amiiform [Forey and Patterson Reference Forey and Patterson2006]) or dorsoventrally compressed bodies and elaborate skull ornamentation (Lophiostomus: halecomorph [Ergerton Reference Egerton1852]). Therefore although holostean disparity values would increase under a variance-based metric, this increase would be underpinned by a highly disjunct distribution of phenotypic outliers, as would be expected between the highly contrasting gar and bowfin in the Recent. Teleosts, too, undoubtedly expanded their phenotypic variety further in the Late Cretaceous, with a wide variety of body shapes and feeding ecologies present as early as the Cenomanian (e.g., Forey et al. Reference Forey, Yi, Patterson and Davies2003). This would likely reflect a rather sudden accumulation of new regions of teleost morphospace, although this may or may not coincide with a large increase in overall disparity values, dependent upon the spread of taxa between these morphologies. Combined with evidence of dramatic increases in the morphological variety of the dominant extant teleost clade (Acanthomorpha) in the early Cenozoic (Friedman Reference Friedman2010), this suggests that while the first 150 million years of teleost evolution were characterized by predominantly gradual accumulation of phenotypes, subsequent teleost radiations would have delivered more punctuated increases in disparity to establish the variety of phenotypes teleosts exhibit today.
Acknowledgments
We thank L. Sallan, R. Benson, and R. Sansom for useful discussion, and the collections managers, curators, and research scientists at many institutions for their assistance and access to fossil specimens. Comments from Lionel Cavin and two anonymous reviewers substantially improved an earlier version of this contribution. This work was supported by a Palaeontological Association Whittington Award, a Natural Environment Research Council Cohort grant, and European Regional Development Fund (grant no. MOBJD287) (J.T.C.); a Philip Leverhulme Prize PLP 2012-130, Natural Environment Research Council Award NE∕I005536∕1, and the John Fell Fund (M.F.); and the University of Pennsylvania (Lauren Sallan).
Supplementary material
Data available from the Dryad Digital Repository: https://doi:10.5061/dryad.p58c0