Introduction
The development of blue LEDs and laser diodes has attracted considerable research activities on the growth of GaN based III-V nitrides. The band gap of InGaN can be varied over nearly the whole spectral range from near UV to red, so it is usually used in active regions of these devices.
The growth of InxGa1−xN alloys is extremely difficult mostly due to the trade-off between the epilayer quality and the amount of InN incorporation into the alloy. Growth at the temperatures of approximately 800°C typically results in high crystalline quality but the amount of InN in the solid is limited to low values because of the high volatility of In. Lowering the growth temperature results in an increase in the In content at the cost of reduced crystalline quality. The difference in lattice constant and thermal stability between the two constituents, InN and GaN, also complicates the growth of InxGa1−xN. The lattice mismatch can lead to a miscibility gap[Reference Ho and Stringfellow1], which causes fluctuations of In content across the film. Singh and co-workers [Reference Singh, Doppalapudi, Moustakas and Romano2] provided strong evidence of phase separation in InGaN thick films grown by MBE. El-Masry et al [Reference El-Masry, Piner, Liu and Bedair3]reported phase separation in thick InGaN films grown by MOVPE Tran et al [Reference Tran, Karlicek, Schurman, Merai, Osinsky, Li, Eliashevich, Brown, Nering, DiCarlo, Ferguson and Stall4] showed that when phase-separation occurs, InGaN clusters with different indium compositions can coexist and that the high brightness in blue and green LEDs is due to the radiative recombination in the In-rich InGaN clusters.
The mechanism of phase-separation is still not clear. Wu et al [Reference Wu, Elsass, Abare, Mack, Keller, Petroff, DenBaars, Speck and Rosner Appl5] reported that the V-defects initiate at the threading dislocations in one of the quantum wells in a multiple quantum well (MQW) stack and found that V-defect is correlated with the localized excitonic recombination centers that give rise to a long-wavelength shoulder in photoluminescence (PL) and cathodoluminescence (CL) spectra.
Sugahara and Sakai [Reference Sugahara, Hao, Wang, Nakagawa, Naoi, Nishino and Sakai6] discussed the role of dislocation in InGaN phase separation. They showed that the dislocations in InGaN act as nonradiative recombination centers and confirmed that the phase separation in InGaN is caused by the spiral growth due to mixed dislocations. They demonstrated that dislocations with the screw component favor the formation of In-rich regions. The extra combinations of the dangling bonds in the dislocated areas can prevent the evaporation of InN during the InGaN growth.
Experimental
The four samples (245K1, 245K1A, 245K1B, 245K1C) of InxGa1−xN films were grown by MOVPE (Emcore D125) on (0001) sapphire substrates. MOVPE was conducted using TMGa, TMIn and NH3 as precursors. A 2µm thick undoped bulk GaN was first grown on the 250Å thick GaN buffer layer. The growth temperature was 530°C and 1050°C for the GaN buffer and bulk layer, respectively. After deposition of the GaN bulk layer, the growth temperature was lowered down to about 700°C for the deposition of InGaN. The InGaN layer thickness was about 500Å. There was no cap layer on the top of InGaN. H2 and N2 were used as carrier gases for the growth of GaN and InGaN, respectively. The TMIn/TMGa molar ratios were 0.8789, 0.89, 0.8935, and 0.8935, respectively for the four samples. The samples were analyzed by cathodoluminescence (CL), high–resolution X-ray diffraction (HRXRD) and scanning electron microscopy (SEM) at room temperature (RT). CL measurements were performed with an acceleration voltage of 5 or 15kV using a JOEL 6400 SEM equipped with an Oxford Mono CL2.
Results
Cathodoluminescence Spectra and Mapping
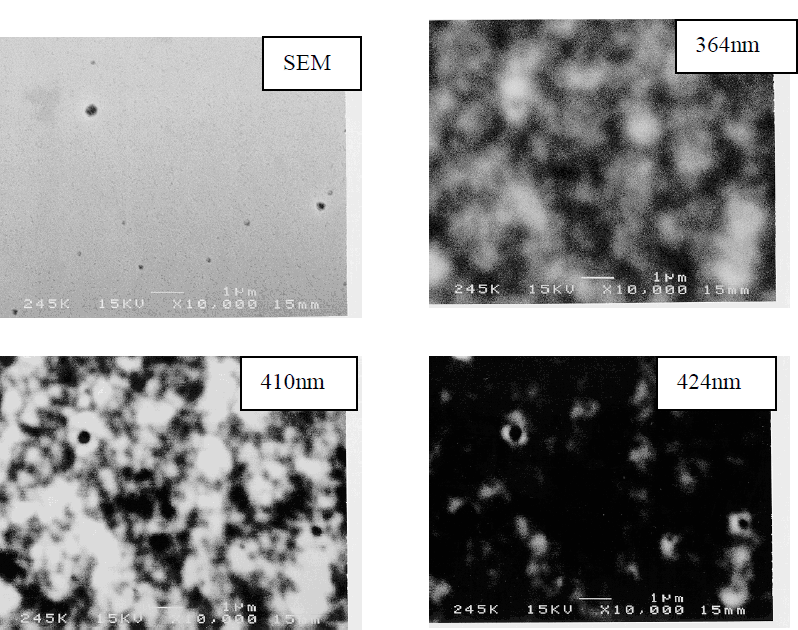
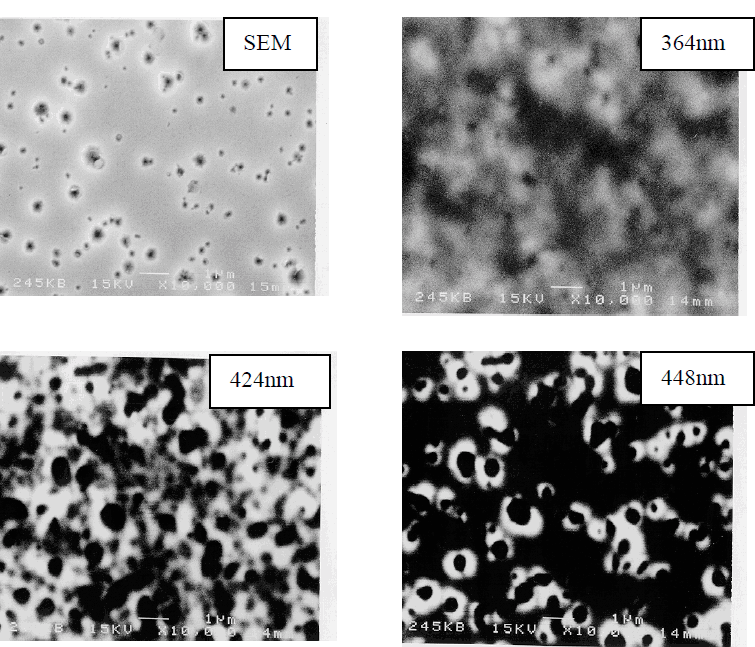
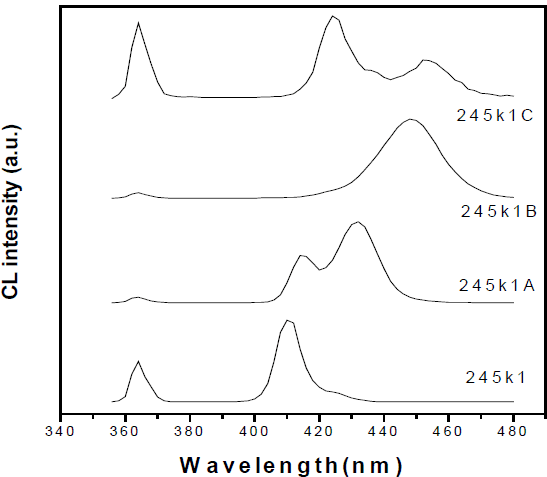
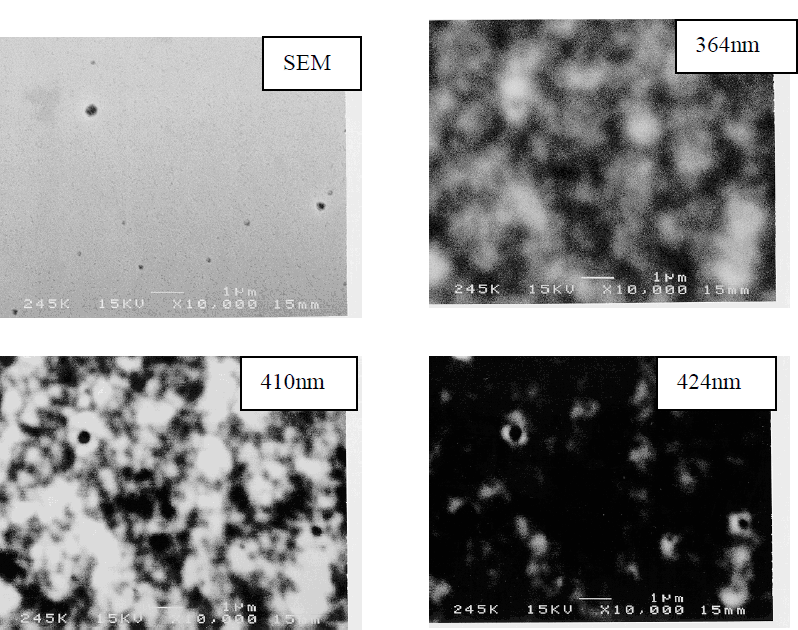
Figure 1 shows the room temperature CL spectra of the four samples (245k1, 245k1A, 245k1B, 245k1C) by scanning the incident electron beam in relatively wide area (10.6×8.1μm2). The CL spectra of sample 245k1A, and 245k1C exhibit two peaks. The peaks with longer wavelengths were attributed to band-edge related transitions in the In-rich regions. The In–contents of the In-poor regions determined by HRXRD are 16.19%, 16.42%, 19.53% and 20.02%, respectively. In addition to the In-poor regions, In-rich regions with In-contents as high as 51.3% have been found for the four samples. Figure 2 shows plan-view SEM and CL images taken at wavelengths corresponding to the GaN band edge (364nm), InGaN In-poor regions (410nm, 414nm, 424nm, and 424nm for sample 245k1, 245k1A, 245k1B, and 245k1C, respectively), and In-rich regions (424nm, 432nm, 448nm, and 454nm for sample 245k1, 245k1A, 245k1B, and 245k1C, respectively).
Cathodoluminescence spectra of the four samples, 245k1,245k1A,245k1B, 245k1C at RT.
Top-view SEM and CL of the sample 245K1
Top-view SEM and CL of the sample 245K1A
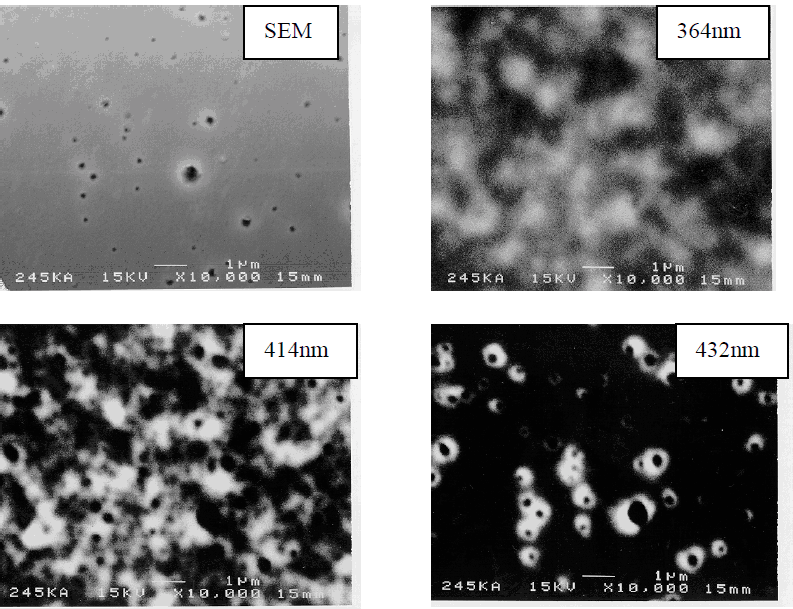
Top-view SEM and CL of the sample 245K1B

Top-view SEM and CL of the sample 245K1C

In the SEM images, all the samples have “inverted hexagonal pits” (IHPs) but with different size and density. Samples grown under higher TMIn/TMGa molar ratios tend to have cathodoluminescence with longer wavelengths and larger IHPs. Sample 245k1C has the largest IHPs with a diameter of approximately 1 μm.
For any one of the four samples, the GaN band-edge CL at 364nm is not uniform. The dark spots correspond to non-radiative recombination centers which were reported to be related with dislocations [Reference Sugahara, Hao, Wang, Nakagawa, Naoi, Nishino and Sakai6]. The CL from the In-poor regions is not uniform either, which demonstrates the non-homogeneous nature of hetero-epitaxially grown InGaN. The CL from In-rich region comes only from the periphery of the IHPs. The situation is most clearly shown in the CL at 454nm for the sample 245k1C where the CL from In-rich regions is associated with the periphery of the two large IHPs.
One may argue that the longer wavelength CL comes from the defects which are captured by dislocations. To further clarify this, we performed temperature-dependent photoluminescence (PL) [Reference Li, Chua, Li, Wang, Wang and Guo7] and excitation-power-dependent PL as well as time-resolved PL (TRPL) [Reference Chua and Li8]. The PL of the four samples have long wavelength peaks or shoulders, the temperature–dependent behavior of the long wavelength peak is S-shaped-like which was reported by Cho et al [Reference Cho, Little, Gainer, Song, Keller, Mishra and Denbaars9]. The TRPL demonstrated nano-second-order lifetime of the long wavelength peak. This fact excludes the possibility of donor-acceptor-pair transition (DAP) which usually has a longer lifetime in the micro-second order [Reference Cho, Little, Gainer, Song, Keller, Mishra and Denbaars9]. Based on the above PL experiments and HRXRD, we can confirm that In-rich regions occur in all of our four samples.
Discussions
The formation of IHPs was investigated theoretically by Northrup [Reference Northup, Romano and Neugebauer10]. A strong preference for In surface segregation and occupation on a specific surface (1011) was demonstrated using first-principle calculations. His calculations indicate that in the absence of In, the equilibrium pit size is on the order of a few nanometers. However, the segregation of In on (1011) surfaces can provide a strong driving force to reduce the surface energy and thereby allow the formation of large IHPs. In fact, In behaves as a differential surfacant, reducing the energy of the (1011) surfact relative to (0001) surface. This effect promotes the formation of larger IHPs. In our samples, these IHPs as large as 1µm in diameter were found. The strong CL with longer wavelengths at room temperature from the regions near IHPs can be attributed to the quantum-confinement enhanced effect in the form of quantum well or quantum dots with high In content near IHPs. The formation of In-rich region near IHPs can be explained by carefully examining the role of dislocation in the growth of InGaN: the extra dangling bonds in dislocated area can prevent the evaporation of InN during the InGaN growth [Reference Li, Chua, Li, Wang, Wang and Guo7]. Therefore, the dislocations can become the triggering centers for In-rich regions.
It is worthwhile to distinguish the phase-separation (bulk diffusion) process with the segregation that may have occurred during the growth. In this paper, the latter: the In segregation on the growing surface and the preference for InN bonds on (1011) can explain the formation of the In-rich regions at the periphery of IHPs.
Conclusions
In conclusions, RT CL at wavelengths corresponding to the GaN near band egde, the Inpoor and In-rich regions were performed on the InGaN samples. It was found that the Inrich regions formed at the periphery of the IHPs. The segregation of In on the (1011) surfaces allows the formation of large IHPs.