Introduction
Retinogeniculate signal transmission can be studied by simultaneous recording of the responses of the lateral geniculate nucleus (LGN) cell and the retinal ganglion cell providing dominant input, the latter derived from direct recordings in the retina (Cleland et al., Reference Cleland, Dubin and Levick1971; Mastronarde, Reference Mastronarde1987a,Reference Mastronardeb) or in the form of prepotentials in the LGN (Lee et al., Reference Lee, Virsu and Creutzfeldt1983a; Kaplan & Shapley, Reference Kaplan and Shapley1984; Sincich et al., Reference Sincich, Adams, Economides and Horton2007). Prepotentials, or S-potentials, were first studied in the cat by Bishop et al. (Reference Bishop, Burke and Davis1958) and later by Hubel and Wiesel (Reference Hubel and Wiesel1961).
Previous studies have shown that the time between two prepotential impulses is usually less than a critical value of about 25–40 ms in order to generate an LGN output pulse (Lee et al., Reference Lee, Virsu and Creutzfeldt1983a; Usrey et al., Reference Usrey, Reppas and Reid1998; Carandini et al., Reference Carandini, Horton and Sincich2007; Sincich et al., Reference Sincich, Adams, Economides and Horton2007). This corresponds to a threshold prepotential firing frequency of about 40–25 imp/s before an LGN cell output is activated. We shall call this the LGN activation threshold (AT). Lee et al. (Reference Lee, Virsu and Elepfandt1983a) found that, above the AT, the transmission efficiency, k = (increment in LGN firing rate)/(increment in prepotential firing rate), is close to constant but less than 1.0. These and other results (Lee et al., Reference Lee, Virsu and Creutzfeldt1983a; Casti et al., Reference Casti, Hayot, Xiao and Kaplan2008) have led to the conclusion that the LGN cell acts as a “leaky” relay of retinal information, that is, that only a percentage of the retinal input signal above the AT is transmitted to the cortex (but see Sincich et al., Reference Sincich, Horton and Sharpee2009; Uglesich et al., Reference Uglesich, Casti, Hayot and Kaplan2009).
We report here data from a study of opponent cells and color coding in the LGN of the macaque monkey (Valberg et al., Reference Valberg, Seim, Lee and Tryti1985a, Reference Valberg, Lee and Tryti1987; Lee et al., Reference Lee, Valberg, Tigwell and Tryti1987), where we occasionally encountered prepotentials. After it became clear that cell behavior was strongly dependent on test field size, we started to reanalyze these data with the purpose of improving the mathematical simulation of the responses of parvocellular (PC) and koniocellular (KC) neurons in the LGN.
A further motivation for this work was to simulate LGN cell responses more accurately in order to bring out more precise neural correlations to color vision. In the course of this work, it became clear that, especially for small test fields, there was a major threshold in the retinal input that had to be overcome before the LGN cell started firing. Here, we show how simulations improved after implementation of this new threshold in the model. We suggest that this is an important step in understanding signal processing in the retinal/LGN/cortical visual pathways.
Modeling cell responses
Although most psychophysical and neurophysiological experiments in vision are concerned with threshold or near-threshold conditions, under photopic conditions vision is a suprathreshold phenomenon. Around a given state of light adaptation, the normal working range of the visual system spans about 5 log units of relative luminance, from about 0.01 to about 1000 times the adaptation luminance (Valberg et al., Reference Valberg, Lee and Tryti1987). This range is handled by two classes of cells, the Increment or ON cells and the Decrement or OFF cells (Hubel & Wiesel, Reference Hubel and Wiesel1961; Jung, Reference Jung and Jung1973; Schiller, Reference Schiller1992; De Valois & De Valois, Reference De Valois and De Valois1993). We shall use the Increment (I-cell) and Decrement (D-cell) notation because it points to the role of both cell types in discriminating graded luminance and chrominance dimensions of light stimuli, as in the split coding approach of von der Twer and MacLeod (Reference von Der Twer and MacLeod2001). Such a large intensity range requires incorporation of the nonlinear behavior of signal transduction into models of suprathreshold perception (Valberg et al., Reference Valberg, Seim, Lee and Tryti1985a; von der Twer & MacLeod, Reference von Der Twer and MacLeod2001). In primate color vision, opponent Increment and Decrement center cells have chromatic flavors, and nonlinear models are required to describe their intensity–response (I–R) behavior (Valberg et al., Reference Valberg, Seim, Lee and Tryti1985a,Reference Valberg, Lee, Tigwell and Creutzfeldtb, Reference Valberg, Lee and Tryti1987). The nonlinear hyperpolarization of the cone receptors to light can be described by the hyperbolic Naka–Rushton function (Naka & Rushton, Reference Naka and Rushton1967; Valeton & van Norren, Reference Valeton and van Norren1983), but further threshold nonlinearities may be required to adequately describe cone-opponent cells’ responses (van Hateren et al., Reference van Hateren, Ruetiger, Sun and Lee2002). In order to analyze the prepotential and LGN responses, we found it convenient to start with a model developed previously (Valberg et al., Reference Valberg, Seim, Lee and Tryti1985a, Reference Valberg, Lee and Tryti1987; see description in Materials and methods).
Materials and methods
Preparation
Macaques (Macaca fascicularis 2–4 kg) were anesthetized with an intramuscular injection of ketamine hydrochloride (10–20 mg/kg), and further anesthesia was maintained by isoforene (0.5–1.5%) in a 70/30% N2O/O2 mixture. EEG and ECG were recorded as a control for depth of anesthesia, body temperature maintained near 37.5ºC, and expired pCO2 kept near 4.5%. After insertion of tracheal and venous cannuli and insertion of the animal into a stereotaxic frame, a craniotomy was performed over the left LGN for insertion of a microelectrode. Eye movements were prevented by infusion of gallamine triethiodide (5 mg/kg with 3–5 ml/kg/h of Ringers solution). Tungsten-in-glass microelectrodes were lowered into the LGN. In these experiments, we report on cell responses from the superficial LGN layers (PC and KC); in some experiments, electrolytic lesions were placed for histological reconstruction of electrode location, following termination of the experiment with an overdose of barbiturate and perfusion. Sustained wavelength-dependent responses characterize cells in the PC and KC layers of the LGN so that entry of the electrode into the nucleus is unmistakable. All procedures were approved by the Animal Experimentation Committee of the Lower Saxony Government.
Pupils were dilated with atropine sulfate (1%), and the pupils protected by oxygen-permeable contact lenses of the appropriate power to focus a tangent screen 57 cm from the animal onto the retina. Artificial pupils (6 mm) were installed. During recordings, occasionally within the cell sample (>100 cells), a distinguishable S-potential or prepotential was observed. As in the original description (Bishop et al., Reference Bishop, Burke and Davis1958), prepotentials were identified as a characteristic inflection prior to the LGN spike. It is thought that they derive largely or entirely from a single ganglion cell (Cleland & Levick, Reference Cleland, Dubin and Levick1971; Kaplan & Shapley, Reference Kaplan and Shapley1984). This and the ensuing LGN relay cell spike were differentially gated based on potential size. After filtering, prepotentials and LGN spikes were discriminated by voltage thresholds. A higher threshold was used to selectively record and count LGN spikes and a lower threshold to trigger prepotential detection. Although triggering was based on analog signal amplitude, digital gating ensured that either LGN spikes or prepotentials were each counted only once. LGN spikes, not generated by prepotentials, were very seldom seen. The absence of nonprepotential-generated LGN spikes indicate that the prepotential was the main drive to the ganglion cell. A total of six pairs are analyzed here in detail. On several occasions (ca. 15), incomplete data sets were obtained or the gating segregation was deemed inadequate. Comparison data from these incomplete recordings appeared similar to those reported here, although this was not pursued quantitatively.
Stimulation and recording
The firing rates of cone-opponent PC and KC cells of the LGN were recorded in response to achromatic and chromatic stimuli of different size, wavelength distribution, relative intensity, and light adaptation. Receptive fields, plotted on the tangent screen, were 2–15 deg in eccentricity. The tangent screen was made of a translucent material for which light transmission was not angularly dependent, and stimuli were back projected upon it.
Stimuli were generated by optical means, thus allowing us to explore a 3–5 log unit range of luminance and chromatic variation. Chromatic stimuli of peak wavelengths between 400 and 700 nm were provided by narrow-band interference filters of 50-nm half-maximum bandwidth (Schott, Mainz, Germany). Luminance was controlled by the use of neutral density filters with a flat spectral transmission (Balzers, Jena, Germany). The test stimulus usually alternated with a white, 110 cd/m2, 4 × 5 deg2 adaptation field. The adaptation stimulus had the CIE (x, y) coordinates (0.404, 0.410). Outside the adapting field, the retina was not illuminated. The test stimuli consisted of seven circular fields of 0.2–3.8 deg diameter, in addition to two square fields of 4 × 5 and 8 × 10 deg2 sizes. Luminance was computed from spectral distributions using the CIE V(λ) spectral luminosity function for a 10-deg field (Lee et al., Reference Lee, Martin and Valberg1988).
To measure I–R curves, the intensity of the test stimulus was increased in 10 steps, covering a 3-log unit range of luminance, so that each luminance increment was approximately 0.3 log units. The total range was sometimes extended to 5 log units by using appropriate neutral density filters. The extended range usually reached from 3 log units darker to 2 log units brighter than the adaptation field.
Before and between each presentation of the test field, the adaptation field (A) was presented for 1200 ms. The maintained firing rate is then N A imp/s. When this adaptation field was replaced by a brighter or darker test stimulus (T) of 300 ms duration, a cell’s firing changed to N T imp/s. Our response measure was the difference response,  , that is, the change in firing rate when the white adaptation field was replaced by the test stimulus. For test spots smaller than the 4 × 5 deg2 background, this means that the test field appeared in a dark surround.
The response magnitude N T for the test field was taken as the mean sustained firing rate within the 240-ms time interval following a 45-ms transient interval after onset of the 300-ms test stimulus. This transient interval was excluded from the analysis (except in a few cases mentioned below). Bin width was 15 ms.
Each I–R recording sequence was repeated 10 times, and the data presented here are the average of these 10 presentations.
Cell classification
An initial classification of cone opponency was made using a 10-step “color wheel” consisting of seven chromatic gelatine filters of similar luminance, with peak wavelengths distributed throughout the spectrum. In addition, black and two achromatic stimuli of high and low intensity characterized their nature as ON or OFF cells. The 4 × 5 deg2 test stimuli alternated with the white adaptation field of the same size, as described above. Further classification was performed by analyzing the I–R curves obtained from spectral and achromatic stimuli of 4 × 5 deg2 size. PC D-cells increased in firing to decremental achromatic test fields. I-cells were classified by their excitatory responses to increments in luminance of achromatic stimuli above that of the adapting field. I-cells had a low maintained firing for low intensity “black” stimuli and an increasing response to excitatory wavelengths. Their I–R curves converged at an excitatory response at high intensity of all stimuli. The I–R curves of PC D-cells showed a relatively high maintained firing for “black” and an increasing response to excitatory wavelengths of moderate intensity. They displayed a relatively high response inhibition as luminance increased further. Generally, I-cells corresponded to ON-center cells identified with spot stimuli (Hubel & Wiesel, Reference Hubel and Wiesel1961) and D- cells with OFF-center cells. For further details, see Valberg et al. (Reference Valberg, Seim, Lee and Tryti1985a) and Valberg (Reference Valberg2005).
Of the 44 cells included in the present analysis, 35 were Increment cells, mainly PC. Both “L–M” and “M–L” cells were included in this group. Two cells had an inhibitory S-cone input (–S) and responded maximally to midwavelength light (yellow) stimuli. Nine cells were typical Decrement cells. Simultaneous recordings of prepotentials and LGN cell responses were made from six cells.
Modeling cell responses
Our previous model consisted of the following steps:
1. For cone absorption spectra, we used the Stockman–Sharpe cone fundamentals L, M, and S (Stockman & Sharpe, Reference Stockmann and Sharpe2000).
2. The receptor hyperpolarization evoked by light can be described by the hyperbolic Naka–Rushton formula. This formula is sometimes called the Michaelis–Menton function but can also be traced back to Hill (Reference Hill1910). The exponent n is often called the Hill coefficient Lee (Reference Lee2005):
(1)for the M-cone and similarly for responses V L and V S of the two other cone types. The exponent n is allowed to vary between 0.7 and 1.0 (Valeton & van Norren, Reference Valeton and van Norren1983). σ is the half-saturation constant with a different value for each cone type. When plotted on a logarithmic luminance x-axis, this equation gives the characteristic sigmoidal I–R curve for the cone response.
3. We use an “L–M” opponent PC cell to illustrate the simulation procedure. To model the firing rate of a retinal ganglion cell N G, we use the equation
(2)where and , and A L and A M are amplitude scalars for the L- and M-cone contributions, respectively.4. The recorded prepotential N P was the difference between the response to the test field N G and the adaptation value N A. The response is then:
(3)where the L and M responses to the adaptation field is included in a single constant N 0.5. In the model (Valberg et al., Reference Valberg, Lee and Tryti1987), we use the general version of the equation above with the following opponent combinations (difference) of cone output signals, V S, V M, and V L:
(4)where A L, A M, and A S are amplitude weighting constants. N 0 was in this equation the anticipated activity of the LGN cell for zero luminance (when the adaptation field is replaced by a black test field). In the work presented here, we show that the general model can be improved (Fig. 7A) by letting N0 represent the prepotential activity for a zero luminance stimulus.6. For each cell, the optimization of the parameters in the equation was achieved by minimizing the root-mean-square differences in firing rates between the measured responses in an I–R series and those predicted by the model.


 and
 , and A L and A M are amplitude scalars for the L- and M-cone contributions, respectively.


In contrast–response plots, when contrast is plotted linearly, contrast gain is defined as to the slope of the curve at a given contrast. Alternatively, when I–R curves are plotted on a logarithmic luminance ratio x-axis, a change in sensitivity shifts the response curve horizontally, while the changes in responsiveness amplify or attenuate the I–R curve. In the simulation, the cell’s sensitivity is represented mathematically by the cone half-saturation constants, while its responsiveness is represented by the amplitudes A.
From the experimental results, we usually observed that when the adaptation state of the cell was changed, the I–R curve was shifted horizontally, without changing its shape. This is consistent with the requirement that the half-saturation constants σ in eqn. (1) change by the same constant factor for both the L- and M-cones. Attenuation of the I–R curve is achieved by reducing the amplitudes A L and A M by a common constant factor, see eqn. (2).
Results
Prepotentials and LGN cell response
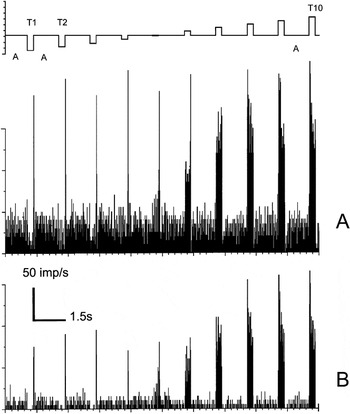
Fig. 1A displays the histogram of the firing frequency of the retinal input (prepotentials) to an “L–M” opponent LGN PC I-cell. The corresponding response histogram of the recipient LGN cell is shown in Fig. 1B. In Fig. 1A, for the three lowest intensities, the test field responses show a suppression of the maintained firing rate. As spot luminance increases, the response increases to a maximum and then decreases. The most obvious difference between Fig. 1A and 1B is the higher firing rates of the prepotentials, both for the test and the white adaptation field.
Histograms of simultaneously recorded prepotential (A) and the firing of an LGN cell (B). Luminance increased in 10 steps (T 1 to T 10) for an achromatic test field of 0.3 deg diameter. The stimulus cycle (top trace) started with a white, 110 cd/m2, 4 × 5 deg2 adaptation field “A” that lasted for 1200 ms, followed by a test stimulus T lasting 300 ms. The luminance range for the test stimulus was from 1 to 580 cd/m2, that is, luminance increases in approximately 0.3 log unit steps from left to right. The histograms are obtained from 10 repetitions. Bin width was 15 ms. Cell E10U01.

Brief prominent transient responses are seen in both histograms at the transition between the presentation of the test and the adaptation field. Similar transient responses have also been reported in cat (Mastronarde, Reference Mastronarde1987a).
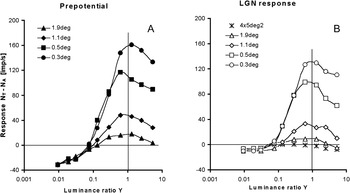
Figs. 2A and 2B shows the nonlinear I–R curves of this cell for different test field sizes. Fig. 2A displays prepotential luminance response curves for different spot sizes, while Fig. 2B displays the corresponding LGN cell firing rates. For each test field size, responses are plotted as a function of the luminance ratio, Y, between the luminance L T of the test stimulus T and the luminance L A of the white adaptation field A ( ). The response (
 ) contains negative response values whenever the response to the test stimulus (N T) was smaller than that of the white adaptation field (N A). Increasing the size of the test field yielded reduced responses. Below Y = 0.1 in Fig. 2B (T 4 in Fig. 1), the LGN cell response is weak (N T ≈ 0), while the prepotential responses still decrease. The maintained firing to the adaptation field, N A, is about 40 imp/s for the prepotential and around 10 imp/s for the LGN cell. In order to activate the LGN cell, the prepotential frequency must be about 30 imp/s for all four test field sizes. This is the AT for this cell.
(A) Prepotential firing rates for the cone-opponent cell of Fig. 1, extracellularly recorded as a function of luminance ratio for four test field sizes. (B) Firing rates as a function of luminance ratio for the targeted LGN cell. Data for the 0.3-deg test field deviate somewhat from those of Fig. 1 because they are the average of two recordings. Achromatic stimuli. Cell E10U01.

Transmission efficiency
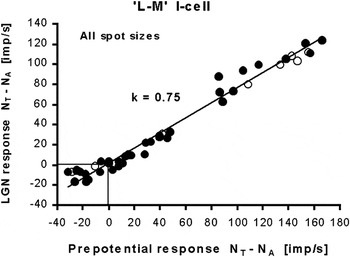
In Fig. 3, we have plotted the relationship between firing rates of the target LGN cell and the prepotentials for all test field sizes and intensities shown in Fig. 2. In addition, data from an I–R series using a chromatic 675-nm test field of 4 × 5 deg2 size are also shown (open circles). The slope of the regression line is k = 0.75. These data resemble those found in the literature (e.g., Lee et al., Reference Lee, Virsu and Creutzfeldt1983a).
The apparent linear relationship between the prepotential firing rate and the LGN response for all data of Fig. 2 (filled circles), and for a 675-nm 4 × 5 deg2 chromatic test field (open circles). The trend line, with slope k = 0.75, passes close to origin (0, 0). Cell E10U01.

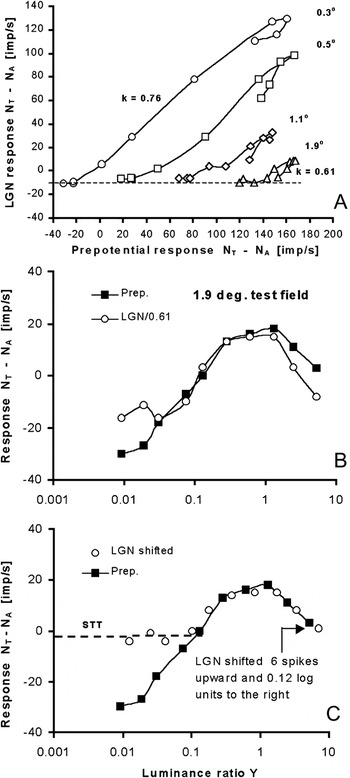
However, when the LGN responses of Fig. 3 are replotted for each spot size separately, the relationship turns out to be more complex. This is shown in Fig. 4A, where data for the four different spot sizes are separated, each (except the 0.3-deg field) displaced 50 imp/s along the x-axis for clarity. Two deviations from the simple relation in Fig. 3 are apparent: First, the slopes of the curves depend on stimulus size and decreases from k = 0.76 to k = 0.61 when spot size increases from 0.3 to 1.9 deg. This indicates that the efficiency of prepotentials in generating LGN cell spikes is less for larger than for smaller stimuli. This result is in agreement with findings of Hubel and Wiesel (Reference Hubel and Wiesel1961) in cat (their Fig. 5). Second, there is an unexpected “loop” at the highest intensities for all curves. After reaching a peak response, both responses decrease at higher luminances, but the LGN cell’s response decreases more than the prepotential firing rate, thus creating a loop.
(A) The data in Fig. 3 are here separated by 50 imp/s for each of the four test field sizes, showing a systematic decrease in transmission efficacy (slope k) as stimuli get larger, and a deviation from linearity at the top of each curve (a loop) for high luminance. (B) Multiplying the LGN data by a factor 1/0.61 (open circles) did not make them coincide with the prepotential data. (C) Shifting the LGN response data upward and to the right on the x-axis made them merge with the prepotential data points, except for the three lowest luminance values. Cell E10U01.

In Fig. 4B, this behavior is illustrated further using the 1.9-deg test field recording that contains the most prominent “loop” and has a slope of k = 0.61. If linearity between prepotential and LGN firing holds, the two responses should superimpose after multiplying the LGN response by 1/0.61. However, the two curves deviate in a systematic way for the higher (and lower) luminances. A better match for the two curves can be obtained by shifting the LGN curve 6 imp/s upward and 0.12 log units to the right, as shown in Fig. 4C, except for the three lowest intensities where the LGN response is nearly zero. The vertical shift of the LGN response curve is a method for establishing the activity level, above which the prepotential is able to transfer the retinal information to the LGN cell. This shift can be explained as a general loss of the LGN response when compared to the prepotential, independent of stimulus intensity. By adding ΔN = 6 imp/s to the AT value of about 30 imp/s, we get a 1:1 relationship between the prepotential- and the (shifted) LGN-curve. For prepotential firing rates above 36 imp/s, indicated by the dashed line in the figure, the prepotential signal will be transferred unaltered to the cortex by the LGN cell. We call this the signal transfer threshold, or STT (equal to AT + ΔN). A firing rate of 36 imp/s corresponds to an average distance between two spikes of 28 ms. For prepotential pulses closer than 28 ms, the response variation of the LGN cell closely follows that of the prepotential.
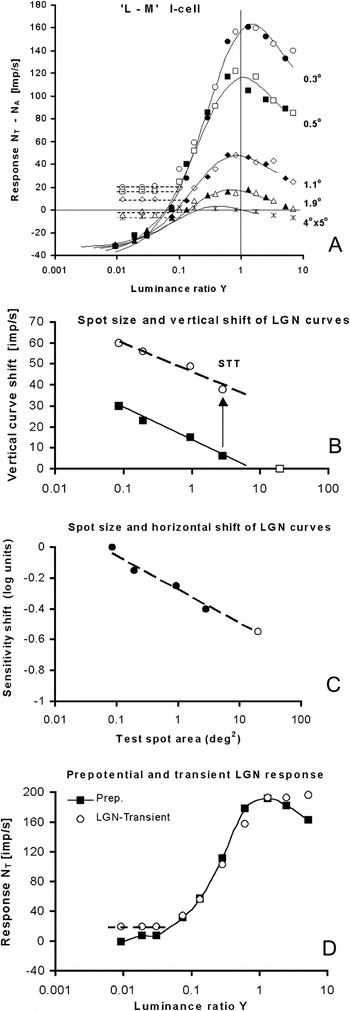
In Fig. 5A, all I–R curves of the LGN cell in Fig. 2B (represented by open symbols) have been shifted 0.12 log units to the right on the x-axis, equivalent to a reduction of sensitivity of this LGN cell by a factor of 0.76. From Fig. 4A, we might have expected that, due to the variation in k-factors for different field sizes, the shift should be dependent on field size. But we found that a common constant shift leads to optimal merging of the curve pairs. Additional vertical shifts ΔN of the LGN curves of Fig. 2B by different amounts (dependent on the stimulus size) were needed to make the LGN and prepotential curves coincide above the STT threshold (see Fig. 5B). The results, shown in Fig. 5A as open (LGN) and filled (prepotential) symbols, demonstrate a high degree of congruence between the two merged data sets. After the shifts, the transmission efficiency is close to 1.0 for all sizes, and the loops shown in Fig. 4A have disappeared.
(A) In order to coincide with the prepotentials (filled symbols), all LGN response curves have been shifted 0.12 log units to the right and upward by different amounts (open symbols). Simulation of prepotential responses are shown as curves. (B) The vertical shift of LGN response curves in (A), when the area of the test field increases (filled squares), is inversely proportional to the logarithm of the area (thin line). The STTs for the different field sizes are also included (open circles) and the trend line (broken line) is inversely proportional to the logarithm of the area. (C) The change in sensitivity when the area of the test field is increased. (D) Comparison of sustained prepotential responses (filled squares) with the transient LGN response (first 45 ms; open circles). The normalized transient LGN response (shifted 20 imp/s upward) closely matches the prepotential response, except for the highest intensities where the transient response saturates and the lowest where the transient response is inhibited (broken line). LGN responses for the 0.3-deg test field is presented. Data deviate somewhat from those of Fig. 1 because they are the average of two recordings. For clarity, the response N T of the test field is plotted, not the difference  . Cell E10U01.

Fig. 5A confirms that both the attenuation of the I–R curves and the sensitivity shifts are found in the input and that the LGN response merely reflects the changes in its afferent. In Fig. 5B, the vertical shifts of the LGN curves are plotted as a function of the test spot area (filled squares). In addition, the corresponding STT values are shown (open circles). The trend line for STT (broken line) is well represented by a logarithmic function. Fig. 5C shows the relationship between the logarithm of the horizontal shift of the LGN curves in Fig. 5A and the area of the test spot.
For each field size, the LGN cell shows no differential response between stimuli with responses lying below the associated dashed horizontal line in Fig. 5A. Above these thresholds, the 1:1 relationship between the afferent signal and the shifted LGN output signal expose a common identity and a continuation of the prepotential activity. For the smallest 0.3-deg test field, the vertical shift ΔN was 30 imp/s, leading to an STT of about 60 imp/s.
The implied change (increase) of sensitivity of the LGN cell leads to an improved match with the prepotential response in Fig. 5A, but this improvement might be coincidental. However, a change of the sensitivity of the LGN cell seems to takes place after the 45-ms transient period after onset of the test stimulus, that is, after the time interval excluded from the analysis of the sustained response. The transient data for this particular LGN cell were not tabulated but obtained from the histograms. The transient LGN response was also obtained in this way for the achromatic 0.3 and 0.5 deg fields, and the 4 × 5 deg2 675 nm test stimuli, that is, the conditions with highest responsiveness. The transient LGN responses were then compared with the (sustained) prepotential responses. For all three conditions, the transient LGN response followed closely that of the prepotential after a vertical shift of the transient curve and normalizing the differences in responsiveness. This is shown in Fig. 5D for the 0.3-deg test field. For clarity, the response N T of the test field is plotted, not the difference  . Here, the responsiveness of the transient LGN response was 67% of the prepotential firing rate. When adjusted for this difference, the transient part of the LGN response closely followed the sustained prepotential response, as shown in Fig. 5D, indicating that the sensitivity of the transient LGN response is 0.12 log units less than that of the sustained response. This shows that no increase in sensitivity was observed for the transient LGN response when compared with the prepotential, while the sustained LGN component showed a 0.12-log unit increase. This temporal behavior, the fact that the LGN follows its input more closely during the transient phase, has also been noted in dual recordings from cat retina and LGN (Cleland & Lee, Reference Cleland and Lee1985).
Modeling prepotential and LGN responses
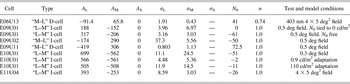
Recordings of spectral responses classified the cell of Figs. 1–5 as a PC “L–M” opponent Increment (ON) cell. We used eqn. (3) to simulate the prepotential I–R curves for the 0.3-deg stimulus. The simulation parameters are given in Table 1. In order to fit the simulation to the data for the larger test field sizes, the amplitude of the simulated response curve for the 0.3-deg field (Fig. 5A) was first attenuated by factors 0.76, 0.41, and 0.26 for the field sizes 0.5, 1.1, and 1.9 deg, respectively. When the area of the test field increased, the sensitivity of the prepotential and LGN cell responses also increased, resulting in a shift of the I–R curves to the left on the x-axis in Fig. 5A. In the model equation (3), this horizontal shift of the model curve to the left implies that both the L- and M-cones are in balance and that their respective half-saturation constants, σ L and σ M, are reduced with a common factor. This common factor depends on test field area and follows a logarithmic function (as does the vertical displacement in Fig. 5B).

The best simulation is displayed as the family of continuous S-shaped I–R curves in Fig. 5A. They agree well with both the LGN and prepotential data points, except for LGN responses below the STT (horizontal dashed line). In Fig. 5A, we have also included the 4 × 5 deg2 test field (crosses), for which we had no prepotential recordings. However, by extrapolating the data in Fig. 5B to this field size (open square), we see that no vertical shift is needed, leading to an STT of about 30 imp/s. The horizontal shift of the prepotential response curve for the 4 × 5 deg2 test field in Fig. 5A was found from extrapolating the straight line in Fig. 5C (open circle). Fig. 5A displays an excellent correspondence for predicted and measured responses also for this large field size.
Other I-cells
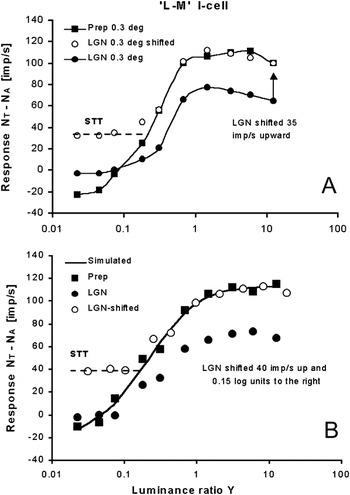
Fig. 6A shows I–R curves for another “L–M” opponent I-cell for which both prepotential and LGN responses were obtained. Prepotential firing (filled squares) and the LGN responses (filled circles) were plotted for a 675-nm test spot with a diameter of 0.3 deg. The open circles show the LGN curve when ΔN = 35 imp/s is added to it. This shifted LGN response curve coincides with the prepotential response curve, like in Fig. 5A, except again for the lower stimulus intensities where the LGN response curve is nearly flat (STT, dashed line). No horizontal shift of the LGN curve was needed in this case since the slope k was already close to 1.0. The STT is about 57 imp/s since the AT is about 22 imp/s for this cell.
(A) The I–R curves for the LGN cell (filled circles) and the prepotential (filled squares) match above the STT when the LGN curve is shifted up 35 imp/s (open circles), except for the four lower luminance values. A 675-nm test stimulus is used. (B) The transmission efficiency k of the LGN cell is reduced to 0.7 when the test field is made four times larger than the adaptation field (8 × 10 deg2). Shifting the LGN curve, as done for the cell in Fig. 5, makes the two curves coincide above the STT (broken line). Cell E11U04.

The test field was then increased to 0.5, 1.1, 1.9, and 3.8 degrees diameter. For all test fields, we obtained congruence between the prepotential and the LGN response curves by shifting the LGN curves vertically, indicating that the k-factor was constant for all test fields smaller than the adapting field. Contrary to the results shown in Fig. 5B, for this particular cell, the STT increased slightly when test field size increased.
However, when the test field was increased to 8 × 10 deg2, a field four times larger than the adaptation field, the transmission efficiency changed from k = 1 to k = 0.7. With this larger test stimulus, the cell in several respects behaved like the cell shown in Figs. 1–5. For that cell, the LGN responses were shifted 0.12 log units horizontally toward higher values in order to match the prepotential curves. The LGN I–R curve of the 8 × 10 deg2 field was shifted 0.15 log units to the right, that is, desensitized by a factor of 0.7 and moved upward by 40 imp/s. As shown in Fig. 6B, the curves now coincide above the STT and the cell’s behavior was indeed similar to that of Fig. 5A.
Modeling without prepotentials
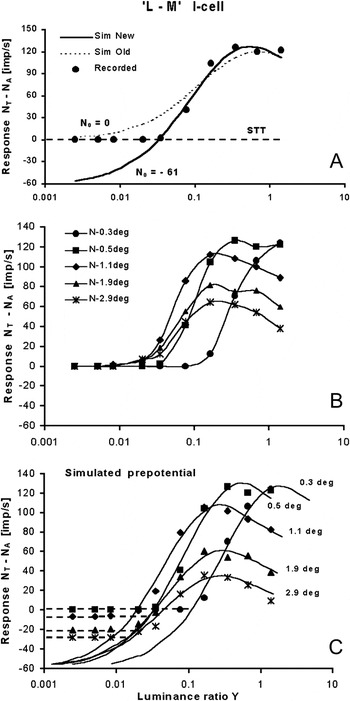
In our previous analysis of recordings from PC cells in the LGN (Valberg et al., Reference Valberg, Seim, Lee and Tryti1985a, Reference Valberg, Lee and Tryti1987), we simulated the LGN PC-cell responses directly by eqns. (3) and (4), without incorporating knowledge of the prepotential and the STT. The simulation was therefore dependent on the LGN cell firing rate N 0 assigned to a black stimulus. To illustrate this, we consider another typical “L–M” I-cell, for which prepotentials were not recorded. As illustrated in Fig. 7A, without the incorporation of an STT, modeling of the responses of LGN PC cells to small test fields leads to less than optimal simulations. The figure shows the I–R curve of the I-cell to a 0.5-deg 699-nm test spot of increasing luminance ratio. The best simulation, using the previous model, is illustrated by the dotted curve, which deviate markedly from the recorded data. The optimal value of n in eqn. (1) was 1.0 in the new simulation. The main goal of the new simulation is to account for the abrupt transition from threshold to firing of the LGN cell, created by the STT. The improved simulation (solid curve) is based on a) defining an STT for the LGN cell, indicated by the horizontal broken line, and b) that the prepotential is able to transfer the retinal output signal to an LGN output above this threshold.
(A) An example of the difference in the simulation of an I–R curve when a) the value of N 0 in eqn. (4) is set equal to the response of the LGN cell to black (Sim Old, dashed curve) and b) when N 0 is allowed to take a value below the LGN cell’s response to black. The latter simulation leads to a much improved fit to the cell’s response (Sim New, thick curve). (B) The I–R curves of an “L–M” I-cell for test field diameters increasing from 0.3 to 2.9 deg. (C) Simulated prepotential responses (solid curves) obtained by attenuating and shifting the model curve for the 0.5-deg test field. Broken lines represent the STT for the different test field sizes. Increasing the field size from 0.3 to 0.5 deg diameter shifts the response curve to the left (area summation). Stimulus peak wavelength: 699 nm. Cell E09U01.

In this case, the slope of the simulated response (solid curve) becomes steeper since N 0 was allowed to be negative (−61 imp/s) to obtain the best curve fit. By placing the start point of the prepotential curve at N 0, the STT becomes −61 imp/s. So, by allowing N 0 to be negative and free floating, we have updated the previous model to predict the prepotential response and its STT level. The previous procedure worked well for the large 4 × 5 deg2 stimuli, but our present analysis demonstrates that, for smaller test stimuli, it represented an oversimplification. The simulation parameters are found in Table 1.
For the same cell, Fig. 7B shows the I–R curves of different stimulus sizes from 0.3 to 2.9 deg. These recordings were used to test if we could model the prepotential and the STT for the cell from the LGN responses, using the revised method. The results obtained by our new modeling approach for the usual case where there were no prepotentials recorded is shown in Fig. 7C. The procedure for obtaining the simulated curves in this figure is described below:
In Fig. 7A, we simulated the prepotential response for the 0.5-deg spot, using eqn. (3). To simulate the response of the 0.3-deg spot, a good match with the recorded response was obtained by shifting the 0.5-deg curve to the right, that is, desensitizing it by a factor of 0.30. To simulate the response for other spot sizes, we assumed that the behavior of the cell was similar to that shown in Fig. 5A. Consequently, the 0.5-deg curve was attenuated by a size-specific factor. Finally, all prepotential starting points were assigned a value of N 0 = −60 imp/s. The solid curves in Fig. 7C represent the simulated prepotential I–R curves for five spot sizes.
The results for this cell thus represent a test of the applicability of our improved model, and Fig. 7C demonstrates how the (shifted) prepotential/LGN cell response relationship can be predicted in the absence of prepotentials. This is particularly important for modeling suprathreshold responses that correlate with color scaling.
The large stimulus intensity range leads to a decrease of response at the highest intensities. This decrease is also seen when the size of the test field is close to equal the receptive field center, that is, for the 0.5-deg diameter test field. Since the simulated I–R curve of the 0.3-deg field is very similar to the shifted 0.5-deg curve, both responses seem to contain an inhibitory component that become active at high stimulus intensities. One reason for this might be that light is scattered from the test field center into the antagonistic surround of the receptive field. However, if this were the case, the shape of the I–R curve would change when the test field is changed from 0.3 to 0.5 deg and only become attenuated when it is made larger than 0.5 deg. From eqn. (3), one would expect that the inhibitory component would increase in strength for increasing test field sizes and change the shape of the I–R curve.
Another explanation of the decrease of the modeled response at the highest intensities for small test fields is that the inhibitory surround is present in the center of the receptive field, as in the “Difference of Gaussian” model. Then, the decrease would take place, even if scattered light was absent or insignificant.
Decrement (OFF-center) cells
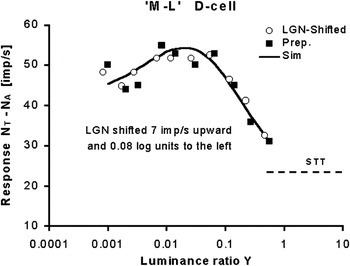
Curve shifts are useful also in analyzing LGN-opponent Decrement cells. In Fig. 8, a 4 × 5 deg2 test field of 403 nm was used as a stimulus. In this figure, the LGN I–R curve is shifted 7 imp/s up and 0.08 log units to the left, leading to an overlap of the LGN and prepotential data. Modeling the cells spectral response with eqn. (4) is shown by the solid curve. Simulation parameters are found in Table 1. The LGN I–R curve for a 500-nm and a 430-nm test stimulus had also to be shifted by 0.08 log units to merge with the prepotential curves.
Decrement cell. The shifted LGN response coincides with the prepotential response for a 403-nm test stimulus. Test field size: 4 × 5 deg2. Cell E06U13.

A D-cell reacts to the decrement of the luminance of the adaptation field and moving the LGN curve to the left means that the decrement steps  had to be made larger to obtain matching curves. As for the LGN I-cell in Fig. 5, the sensitivity of the LGN D-cell had to be reduced by a common factor in order for the I–R curves to match. It thus appears that the argument against a “leaky relay cell” also applies to D-cells and that, consequently, retinal information transfer can be optimal also for these cells.
PC cell behavior
About 85% of the 35 opponent I-cells included in the present analysis responded in a similar way as those presented in Figs. 5A and 7B. The amplitude of the I–R curves fell off for high intensities, and the responsiveness was reduced for large test field sizes. For about 55% of the I-cells, the method of modeling the response by attenuating and shifting a common I–R curve could be used for all test field sizes. For about 35% of the I-cells, this method worked only for the smaller test fields.
Reduced responsiveness for large test spots was also found in cat by Hubel and Wiesel (Reference Hubel and Wiesel1961, see their Figs. 1 and 2) and by Mastronarde (Reference Mastronarde1987a). In the primate, it was noted by Lee et al. (Reference Lee, Virsu and Elepfandt1983b) and modeled by opponent mechanisms with independent saturating nonlinearities, as is also the case for the current results.
Of the nine cells classified as D-cells, the responses to variation in test field size fell into two groups. Four cells showed a high responsiveness and sensitivity to small test fields, while five cells had high responsiveness to large test fields. The cell presented in Fig. 8 belongs to the latter group. For the first group, responsiveness behaved in a way similar to the I-cells in Figs. 5A and 7C. For the D-cells in both groups, it was possible to use a common (shifted and/or attenuated) curve to describe the responses when the test field size varied.
Dividing the cone response range between I- and D-cells
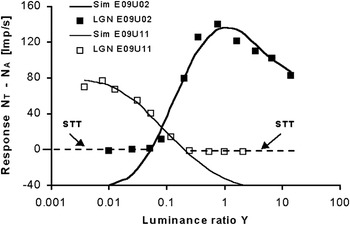
The response ranges of cones are split into two parts by the ON and OFF bipolar and ganglion cells and transmitted to the LGN by separate pathways (Jung, Reference Jung and Jung1973; Schiller, Reference Schiller1992; Valberg & Seim, Reference Valberg and Seim2008). Compared to retinal ganglion cells, the response range of the LGN-opponent PC cells is reduced by the STT. However, the existence of an STT may improve the separation of information between I- and D-cell types in the LGN. Fig. 9 shows how this may be done. Whereas in I-cells, the STT occurs for relatively moderate intensities, for D-cells, it is the differential response to higher intensities that is removed by this threshold. In this way, the overlap of the two LGN response curves is reduced to a minimum, without loss of (relative) intensity and wavelength information.
Responses to a 0.5-deg test field of different luminance ratios are here divided between an Increment (E09U02) and a Decrement cell (E09U11). Both are classified as “M–L” cells. The AT in ON cells occurs for relatively low intensities, but for OFF cells, it is the response to higher intensities that is removed. Consequently, the luminance contrasts in the higher luminance range are discriminated by ON cells, and the lower range is taken care of by OFF cells.

Fig. 9 demonstrates how the retinal cone response range is coded by division between two PC cell types, the I- and D-cells with the same cone opponency (either L–M or M–L). Moreover, as pointed out before (Valberg & Seim, Reference Valberg and Seim2008), the negative response difference of, for instance, an “L–M” I-cell corresponds closely to the excitatory response of an “M–L” D-cell and vice versa. In other words, the “lost” response range due to the STT is rectified and appears as excitation in another “complementary” cell type. This division of labor between I- and D-cells makes accurate representation of brightness and chromaticity possible over a much larger range of relative intensity and thus improves coding efficiency.
About color stability
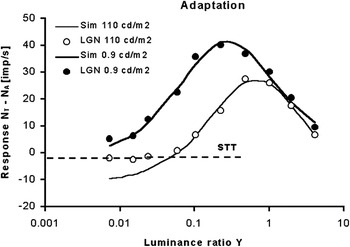
The example illustrated in Fig. 9 of signal division between I- and D-cells seems to apply satisfactorily for light-adapted cells. When the adaptation level was reduced, say from 110 cd/m2 to close to 0 cd/m2, the decremental response of the D-cell disappeared and the I-cell’s “brightness” response took over, as shown in Fig. 10. Likewise, in the light-adapted state (open symbols), the response simulation leads to an elevated STT level (broken line).
Recordings and simulation (solid curves) of I-cell responses when the adaptation luminance of a 1.1-deg test spot is reduced from 110 to 0.9 cd/m2 (about 2 log units). In the light-adapted state (open symbols), the response simulation leads to an elevated STT level (broken line). Reducing the adaptation luminance by 2 log units makes the cell more responsive and shifts the curve about 1 log unit to the left. Wavelength of test stimulus is 571 nm. Cell E10U01.

With a white 110 cd/m2 adaptation field, the sensitivity and the response amplitudes are reduced relative to an adaptation field of lower luminance. Reducing the adaptation luminance by about 2 log units to 0.9 cd/m2 shifts the response curve to the left on the x-axis but does not change its shape. This is seen from the simulation in Fig. 10 of the I–R curves in the two adaptation states. This is in agreement with previous findings (Valberg et al., Reference Valberg, Lee, Tigwell and Creutzfeldt1985b).
From the simulation of the responses with bright and dark adaptation fields, shown in Fig. 10, we derived the values shown in Table 1. The ratios of amplitude and sensitivity parameters for dark to white adaptations were:

Thus, the ratio  is virtually unchanged when the luminance of the adapting field is reduced by more than 2 log units within the photopic range. Note also that since a common curve was used to predict responses to different achromatic (Fig. 5A) and chromatic 699-nm (Fig. 7C) test field sizes, the cone weighting in these simulations does not vary when the test field size varies. This preservation of cone weighting is highly desirable for stable color vision across a broad range of light levels, colors, and adaptation conditions (T. Seim, A. Valberg, and B.B. Lee, in preparation).
Discussion
Our present analysis of signal processing in the LGN of the macaque monkey is mainly based on six LGN cells with associated prepotentials. Although the number of cells is small, the stability and extensive recordings permit detailed analysis. For instance, for the one cell of Figs. 1–5, a total of 30 response series (each with 10 different stimuli intensities varying along different stimulus dimensions) were recorded, including luminance ratios of spectral and achromatic stimuli, test field sizes, and varying adaptation levels. Of these 30 series, 7 included the prepotential. Similarly, extensive data sets were obtained for cells in Figs. 6 and 8. The LGN cells analyzed here behaved in a similar way as more than 100 other cells analyzed previously (Valberg et al., Reference Valberg, Lee and Tryti1987).
LGN cell sensitivity shifts
For both I-cells presented in Figs. 5 and 6, the LGN curve shift was constant (0.12 log units or zero shift) for all test field sizes, as long as the test field was less than or equal to the adapting field size. But it changed when the test field was made larger than the adapting field. For the D-cell in Fig. 8, the LGN curve shift was also constant (−0.08 log units) when the wavelength of the stimulus changed. Fig. 5D supports the assumption that the sensitivity of an LGN cell may increase during the short transient response at the onset of the test stimulus. This change in LGN sensitivity would not have been detected if the range of stimulus intensity had been restricted since the “loops” in Fig. 4A would then have disappeared. In cat, it has been shown repeatedly that filtering of the LGN signal takes place in the transient phase after onset of a stimulus (Cleland & Lee, Reference Cleland and Lee1985; Mastronarde, Reference Mastronarde1987b; Hartveit et al., Reference Hartveit, Ramberg and Heggelund1993; Hartveit & Heggelund, Reference Hartveit and Heggelund1995; Fjeld et al., Reference Fjeld, Ruksenas and Heggelund2002; Ruksenas et al., Reference Ruksenas, Bulatov and Heggelund2007; Augustinaite et al., Reference Augustinaite, Yanagawa and Heggelund2011). Augustinaite and Heggelund (Reference Augustinaite and Heggelund2007) have shown how LGN cell responses can be modulated by the activity of NMDA and AMPA receptors. For instance, the sensitivity of the sustained response is shown to increase, due to cell membrane depolarization attributed to NMDA receptors. The combined effect of the AMPA and NMDA components probably control the cell’s responsiveness.
Apart from a temporal change in sensitivity of the LGN response, another feature is seen in Fig. 4B. After correction for a slope of k = 0.61, the high intensity LGN cell responses deviate from those of the prepotential. We considered why the LGN cell should respond differently from the prepotential for high and low test luminance? Simulation of the prepotential by an L–M combination of cone inputs indicated that the response at low intensity levels was dominated by excitatory L-cones. The peak of the prepotential response and the subsequent reduction in firing for higher luminance are caused by increased M-cone inhibition. The fall off in the response at high luminance was seen for all test field sizes and is thus not due to response saturation after the combination of opponent signals. Opponent coding is generated in the retina, and the LGN cell is unlikely to manipulate the excitatory and inhibitory parts of the prepotential response separately. Note also that a common response curve was used to describe the responses of increasing test field sizes, covering more and more of the inhibitory receptive field surround. The application of a common curve would not have been possible if the balance between the excitatory and inhibitory part of the response had changed with test field size. This similarity between the center-surround receptive field responses of the prepotential and the LGN cell have also been found in the cat (Usrey et al., Reference Usrey, Reppas and Reid1999).
Data for the transient/sustained relationship of the LGN response were available for two other I-cells. For an “M–L” cell, the sustained response had to be shifted up and to the right to match that of the transient component, as done in Fig. 4C to match the prepotential. For an “L–M” I-cell, the sustained part had to be shifted upward to match that of the transient signal, so this cell behaved more like the cell shown in Fig. 5D.
It is interesting to compare the results presented here with those of Kaplan et al. (Reference Kaplan, Purpura and Shapley1987) for monkeys, using gratings of different contrasts displayed on a CRT screen. They found that when the contrast increased the prepotential response increased linearly, while the LGN response first increased and then decreased at still higher contrasts. This is as expected from Fig. 4B where the LGN response starts to decrease at a lower contrast than the prepotential response. The use of gratings and a more restricted intensity (contrast) range may explain why the prepotential response does not also decrease for contrasts above 65% in their Fig. 4C.
There appears to be an analogy to the increased sensitivity of the PC cells in studies of brainstem stimulation in the cat (Hartveit & Heggelund, Reference Hartveit and Heggelund1995). They measured the effect on LGN neurons by stepped incremental stimuli of increasing contrasts. The size of the test spot was small and equal to the size of the receptive field center (similar to the 0.3-deg test field presented in our Fig. 5A). In their Fig. 6, the transient and the sustained component of the nonlagged LGN X-cell response, the brainstem-stimulated LGN response, and the prepotential are plotted as a function of increasing contrasts. When replotting the contrast on a logarithmic x-axis, it becomes clear that brainstem stimulation changes the responsiveness of the transient component but does not change its sensitivity. For the sustained LGN response, the brainstem stimulation leads to both increased responsiveness and an increased sensitivity. It can be shown that, by adjusting the LGN response for increased responsiveness and by increasing the sensitivity 0.18 log units, it merges with the brainstem-stimulated response. When the sustained LGN response was compared with the sustained prepotential response, then the LGN curve had to be shifted 65 imp/s upward to coincide with the prepotential response (i.e., to the STT level) at low contrasts. After an additional shift of 0.18 log units to the left (due to brainstem-increased sensitivity), it closely followed the prepotential response curve. Since this sensitivity increase is equal and opposite of that due to brainstem stimulation of the LGN response, it indicates that the brainstem stimulation permitted the LGN cell to transfer retinal contrast changes reliably above the STT. However, the increase in responsiveness, due to brainstem stimulation, is not observed in Fig. 5A or in the other cells studied here.
STT variations
For the two PC I-cells shown in Figs. 1–5 and Fig. 7C, respectively, the actual level of the STT in Fig. 5A and the anticipated STT in Fig. 7C are both higher for the smaller test spots. This may be due to a size-dependent lateral inhibitory influence on the LGN receptive field, in addition to possible auxiliary retinal inputs (Kaplan & Shapley, Reference Kaplan and Shapley1984; Fjeld et al., Reference Fjeld, Ruksenas and Heggelund2002; Carandini et al., Reference Carandini, Horton and Sincich2007; Babadi et al., Reference Babadi, Castidi, Xiao, Kaplan and Paninski2010). For the nine D-cells in this study, the anticipated STT also varied with test field size.
Information transfer
The large intensity range of the test stimulus exposes the nonlinear nature of retinal response and the stimulus intensity variation will be compressed for high stimulus intensities. However, after the nonlinear transformation (eqn. 1), we have shown that retinal signal information is retained when transmitted to the cortex via the LGN. For the cells presented here, we have demonstrated that it is possible to have a faithful rendering of the changes in retinal signals (due to changes in the test stimulus) by LGN cells, but only above a certain prepotential activity level (STT). The vertical shift ΔN of the LGN curve in Fig. 4C is made a) to show that the two response curves match and b) to establish the prepotential STT value. Without this artificial vertical shift, we see that the LGN response is always less than the prepotential response, but that reliable retinal information transfer (above the STT) is retained.
Other researchers also have questioned the assumption of the LGN cell as a leaky relay cell. Uglesich et al. (Reference Uglesich, Casti, Hayot and Kaplan2009) showed that in cat, LGN cells responded typically to less than 50% of the prepotential pulses, but the transfer of information from the retina was larger than 50%. This was found for small spots that covered the center of the receptive field. When the spot was made larger, then the information transfer decreased. In our experiment, shown in Fig. 5A, the maximum response for the 0.3-deg test field is approximately 160 imp/s, while the STT is about 60 imp/s, leading to a loss of about 40%. For the 1.9-deg test field, the loss is about 70%. Both the STT and the responsiveness are reduced when the test field is increased beyond the receptive field center, leading to a transfer of lower pulse rates to the LGN. If low pulse rates leads to increased variation in the spike pair distance, then we may assume that information transfer is reduced for large test fields due to a more noisy signal, in accord with the results of Uglesich et al. (Reference Uglesich, Casti, Hayot and Kaplan2009). In experiments of Sincich et al. (Reference Sincich, Horton and Sharpee2009), it was established that, even if there is a loss of prepotential spike activation of the LGN cell (as seen in Fig. 1), visual information is often retained and transferred by the LGN to the cortex. Instead of an STT, they introduced neural filters to explain this. In both of these studies, the stimulus intensity was presented in a pseudorandom sequence and analyzed by a method developed by Brenner et al. (Reference Brenner, Strong, Koberle and de Ruyter van Steveninck2000). In the analysis of our experiment, the information transfer is explained in a more explicit way.
Carandini et al. (Reference Carandini, Horton and Sincich2007) have analyzed the ability of the prepotentials to generate LGN outputs as function of the interval between two successive prepotentials. In order to compare our data with theirs, we have computed an average distance dt between successive prepotentials by using the formula:

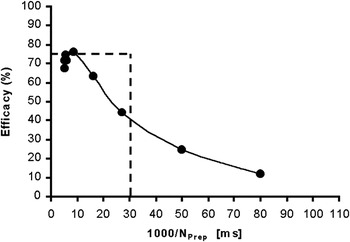
N P is the pulse rate of the prepotential. For fairly constant firing rates over time, the dt (in ms) is a close approximation to the mean interval between two successive prepotential pulses. Fig. 11 is a plot of the efficacy (i.e., the ability of a prepotential pulse to generate an LGN spike in percent) for the data for the 0.3-deg test spot of the cell in Fig. 2. The trend of increased LGN cell output efficacy for shorter prepotential intervals is similar to the data of Carandini et al. (Reference Carandini, Horton and Sincich2007). The main difference from the data of Carandini et al. (Reference Carandini, Horton and Sincich2007) is a decrease from maximum efficacy at intervals shorter than 10 ms. However, if the shifted LGN luminance modulation sensitivity is used (Fig. 5A), then the decrease in efficacy at small intervals disappears and the result become more similar to that of Carandini et al. (Reference Carandini, Horton and Sincich2007). The reason for the different results might depend on the experimental conditions. For instance, in Carandini’s experiments, the duration of the test stimuli was short, only 12 ms, whereas in our experiments, each test lash lasted for 300 ms, where the first 45 ms were excluded from the analysis.
The ability of the prepotential to produce LGN output (efficacy) as a function of average prepotential pulse intervals. Data for 0.3-deg test spot, cell E10U01. Note the reduction of efficacy for short intervals. The broken lines represent a “leaky relay cell” with 75% efficacy and an AT pulse interval of 30 ms.

In Fig. 11, we have included the predicted response for an “ideal” cell that behaves as shown by the trend line in Fig. 3, that is, with a slope k = 0.75 and with an AT of 33 imp/s (broken lines). The deviation from this response pattern for the recorded data points is obvious in this figure, indicating that the assumption of linearity with k = 0.75 in Fig. 3 is an approximation.
I- and D-cell pairs
The information lost below the STT in cone-opponent I-cells can be conveyed by “mirror” D-cells. For instance, “L–M” opponent D-cells respond with excitation to the same wavelengths that are inhibited by “’M–L” opponent Increment-cells, and that the negative response difference of an “L–M” Increment cell corresponds to the excitatory response of an “M–L” Decrement cell. Thus, the “lost” response due to the STT cutoff is rectified and appears as excitation in another cell type (Valberg & Seim, Reference Valberg and Seim2008). Together I- and D-cell pairs are therefore able to transfer the complete response range of cones. Since thresholding occur both in I- and D-cells, it may be used by the visual system to make a “clean” separation of opposite perceptual dimensions. This arrangement can be useful in that it accentuates opposite visual attributes like lightness and blackness by dividing stimulus dimensions of relative intensity between separate cell types (Nakano et al., Reference Nakano, Ikeda and Kaiser1988; Kinoshita & Komatsu, Reference Kinoshita and Komatsu2001; Valberg & Seim, Reference Valberg and Seim2008). This division of labor, along the relative luminance dimension, is not unlike the way information about opposite chromatic dimensions is carried by different cone-opponent cells (Valberg et al., Reference Valberg, Seim, Lee and Tryti1985a).
Fig. 10 demonstrates that the “crossover” between I- and D-cell pairs is influenced by the adaptation light intensity. When the adaptation intensity is reduced to a dark field, then the D-cell is deactivated, while the I-cell response range is shifted towards darker light levels, not unlike the way changing the surround adaptation shifts the chromatic I–R curves along the logarithmic x-axis without changing its shape (Valberg et al., Reference Valberg, Lee, Tigwell and Creutzfeldt1985b). Also, in the dark-adapted eye, the STT is low (equal to the AT). Reduced STT levels imply that the signal transfer become more noisy and that may be the price to pay for an increased sensitivity in darkness. For both I- and D-cells of the geniculate, it was sometimes necessary to reduce the sensitivity to match the prepotential I–R curve.
Conclusion
It has been suggested that the transfer of visual information from the retina to cortex is optimally achieved by an achromatic and two opponent chromatic channels (Buchsbaum & Gottschalk, Reference Buchsbaum and Gottschalk1983; Valberg et al., Reference Valberg, Seim, Lee and Tryti1985a; von der Twer & MacLeod, Reference von Der Twer and MacLeod2001). This was further elaborated with the concept of split coding, by which I- and D-cells and different opponent cone combinations (e.g., M–L and L–M) handle different directions of perturbation away from the mean adaptation level. We have shown that I- and D-cells of a given opponent class optimally transmit chromatic information of stimuli lighter and darker than a mean adaptation level. We conclude that optimal information transfer by opponent LGN cells is possible, but only above a particular prepotential threshold spike rate (STT).
The findings concerning the relationship between prepotentials and LGN-cell firing leads to a substantial improvement of the modeling of LGN PC cell responses. The introduction of the STT leads to steeper I–R curves resulting in a larger Hill coefficient, n, in eqn. (1) (e.g., n = 1.0 as in Table 1). The change of the STT for increasing test spots can be predicted by a logarithmic function. The fact that color perception is stable and largely independent of stimulus size and light adaptation, finds a possible substrate in the finding that the ratios of half-saturation constants ( ) and the opponent response components [
 (eqns. 1–4)] used to simulate the response of a given PC cell are remarkably independent of stimulus size and photopic light level.
Acknowledgments
This work was supported by a grant from the International Neuroinformatics Coordinating Facility to A.V. and NEI EY13112 grant to B.B.L. We thank Paul Heggelund for valuable discussion.