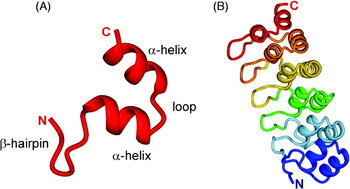
1. Introduction
Proteins that are folded into defined three-dimensional (3D) structures have provided the basis for our present understanding of the means whereby cellular metabolism is conducted in all cells, from bacteria to complex eukaryotes. The paradigm of the transcription of the genetic information encoded in deoxyribonucleotide sequences in DNA to the ribonucleotide sequence of messenger RNA, whence it is translated by ribosomes to a sequence of amino acids in a protein, has been axiomatic in the last 50 years at least. Yet the last step in the process, the folding of the linear amino acid sequence to form a well-structured protein is not completely understood yet, and it appears from recent work in a number of fields that the formation of a stable 3D structure may not be absolutely required in all cases in order for a protein to be functional. Indeed, the absence of stable 3D structure appears in some cases to be required for the correct function of the protein.
Some 15 years ago, two parallel sets of observations made it clear that 3D structure was likely not a prerequisite for the function of some protein systems. On the one hand, the availability of large numbers of gene sequences, culminating in the publication of the complete human genome in 1999, allowed a computational and bioinformatic approach to the analysis of sequence propensities. Sequence analysis is used, for example, as one of the methods to approach the prediction of unknown structure in the Critical Assessment of Techniques for Protein Structure Prediction (CASP) exercises. Following such an analysis, several groups, particularly that of Dunker (then at Washington State University and now at Indiana University) noted that the published genomes contained sequences that would code (if they coded for anything at all) for unstructured proteins (Romero et al. Reference Romero, Obradovic, Kissinger, Villafranca, Garner, Guilliot and Dunker1998). The astonishing statistics were that 6–33% of bacterial proteins, 9–37% of archeal proteins and 35–50% of eukaryotic proteins should contain stretches of 40 or consecutive disordered amino acids (Dunker et al. Reference Dunker, Obradovic, Romero, Garner and Brown2000). At the same time, and quite independently, several experimental labs had noted that some proteins, particularly in the areas of transcriptional and translational control, cell cycle control and signaling (Daughdrill et al. Reference Daughdrill, Hanely and Dahlquist1998; Kriwacki et al. Reference Kriwacki, Hengst, Tennant, Reed and Wright1996) remained without a stable 3D structure even when subjected to all the ingenuity of the experimentalist's repertoire, including optimization of pH, temperature, buffer conditions, salt concentrations and the presence of additives such as chaotropic agents and osmolytes. A pattern began to emerge. These proteins remained unstructured in solution in the absence of their physiological partners, but would fold in the presence of the partner, forming stable complexes that could be purified and characterized (Daughdrill et al. Reference Daughdrill, Chadsey, Karlinsey, Hughes and Dahlquist1997; Kriwacki et al. Reference Kriwacki, Hengst, Tennant, Reed and Wright1996; Radhakrishnan et al. Reference Radhakrishnan, Perez-Alvarado, Parker, Dyson, Montminy and Wright1997). The first compendium of these early experimental results was published in 1999 (Wright & Dyson, Reference Wright and Dyson1999).
Once it had been accepted that proteins could possibly be unfolded yet still functional, an analysis of the sequences of a number of pivotal proteins in the cell revealed that large stretches contained amino acid compositions that were clearly not conducive to the formation of a normal globular protein fold (Garner et al. Reference Garner, Cannon, Romero, Obradovic and Dunker1998; Romero et al. Reference Romero, Obradovic and Dunker1999, Reference Romero, Obradovic, Li, Garner, Brown and Dunker2001; Williams et al. Reference Williams, Obradovic, Mathura, Braun, Garner, Young, Takayama, Brown and Dunker2001). The sequences frequently contained a very high proportion of Ser, Gly, Pro, Asn and Gln, with very low frequency of hydrophobic amino acids that would normally form part of the hydrophobic core of a folded globular protein. Some of the sequences contained multiple tandem repeats of these amino acids, while others were enriched in charged amino acids, Lys, Arg, Glu and Asp. These apparently anomalous sequence compositions prompted the development of several algorithms for prediction of disordered sequences in proteins (Linding et al. Reference Linding, Jensen, Diella, Bork, Gibson and Russell2003a, Reference Linding, Russell, Neduva and Gibsonb; Romero et al. Reference Romero, Obradovic, Kissinger, Villafranca and Dunker1997; Uversky et al. Reference Uversky, Gillespie and Fink2000; Ward et al. Reference Ward, Sodhi, Mcguffin, Buxton and Jones2004; Weathers et al. Reference Weathers, Paulaitis, Woolf and Hoh2004). More recently, a number of refinements and additions to these methods have been developed, including Disprot (Sickmeier et al. Reference Sickmeier, Hamilton, Legall, Vacic, Cortese, Tantos, Szabo, Tompa, Chen, Uversky, Obradovic and Dunker2007), CDF (Xue et al. Reference Xue, Oldfield, Dunker and Uversky2009b), FoldIndex (Prilusky et al. Reference Prilusky, Felder, Zeev-Ben-Mordehai, Rydberg, Man, Beckmann, Silman and Sussman2005), TopIDP (Campen et al. Reference Campen, Williams, Brown, Meng, Uversky and Dunker2008) and contact prediction (Schlessinger et al. Reference Schlessinger, Punta and Rost2007). It is not the purpose of this review to explain in detail these computational and annotational approaches. Each likely has strengths, and the common practice in the field is to apply several of these predictors to a sequence of interest (Lieutaud et al. Reference Lieutaud, Canard and Longhi2008).
More focused prediction methods have been applied specifically to certain systems, such as the prediction of loop structures (Deryusheva et al. Reference Deryusheva, Galzitskaya and Serdyuk2008), amyloid formation (Galzitskaya et al. Reference Galzitskaya, Garbuzynskiy and Lobanov2006), transcription factors (Fukuchi et al. Reference Fukuchi, Homma, Minezaki, Gojobori and Nishikawa2009) and transcriptional activation networks (Singh & Dash, Reference Singh and Dash2007). Differences in compositional biases and hence the predicted proportions of disordered regions were found between water-soluble proteins and the membrane-integral proteins of the helical and β-barrel classes (Xue et al. Reference Xue, Li, Meroueh, Uversky and Dunker2009a), hinting that different prediction methods may be needed for membrane proteins; the authors (Xue et al. Reference Xue, Li, Meroueh, Uversky and Dunker2009a) note that the paucity of structural information for membrane proteins renders these conclusions preliminary. Annotation of published non-human genomes has begun (Forbes et al. Reference Forbes, Flaherty, Ma, Qadota, Benian and Wang2010; Galea et al. Reference Galea, High, Obenauer, Mishra, Park, Punta, Schlessinger, Ma, Rost, Slaughter and Kriwacki2009; Mohan et al. Reference Mohan, Sullivan, Radivojac, Dunker and Uversky2008; Tompa et al. Reference Tompa, Dosztanyi and Simon2006; Xue et al. Reference Xue, Williams, Oldfield, Dunker and Uversky2010a) and libraries (Lobanov et al. Reference Lobanov, Furletova, Bogatyreva, Roytberg and Galzitskaya2010a) and databases (Chen et al. Reference Chen, Romero, Uversky and Dunker2006a, Reference Chen, Romero, Uversky and Dunkerb; Goh et al. Reference Goh, Dunker and Uversky2008; Lobanov et al. Reference Lobanov, Shoemaker, Garbuzynskiy, Fong, Panchenko and Galzitskaya2010b; Peng et al. Reference Peng, Radivojac, Vucetic, Dunker and Obradovic2006) of disordered proteins have been compiled. Methods have been developed for calculation of likely binding sites and solvent accessibilities (Bernado et al. Reference Bernado, Blackledge and Sancho2006; Estrada et al. Reference Estrada, Bernado, Blackledge and Sancho2009) in unfolded ensembles. Proteomic approaches have been applied not only to disordered proteins themselves (Csizmok et al. Reference Csizmok, Dosztanyi, Simon and Tompa2007) but also to their interaction partners (the so-called interactome) (Fong et al. Reference Fong, Shoemaker, Garbuzynskiy, Lobanov, Galzitskaya and Panchenko2009; Haynes et al. Reference Haynes, Oldfield, Ji, Klitgord, Cusick, Radivojac, Uversky, Vidal and Iakoucheva2006; Lobanov et al. Reference Lobanov, Shoemaker, Garbuzynskiy, Fong, Panchenko and Galzitskaya2010b). Interestingly, it appears that the abundance of expressed proteins is directly correlated with their predicted level of disorder (Paliy et al. Reference Paliy, Gargac, Cheng, Uversky and Dunker2008), and the lifetimes of disordered proteins and their mRNAs are tightly regulated (Gsponer et al. Reference Gsponer, Futschik, Teichmann and Babu2008; Ma & Nussinov, Reference Ma and Nussinov2009) and variable (Edwards et al. Reference Edwards, Lobley, Pentony and Jones2009). A power law distribution of disordered sequences within the human proteome has been used to infer the functional importance of disordered sequences (Tompa & Kalmar, Reference Tompa and Kalmar2010).
As the number of examples of intrinsically disordered proteins (IDPs) began to grow, those interested in this newly discovered quirk of protein chemistry began to form theories as to what advantages intrinsic disorder might confer upon a protein. Particularly if the protein formed part of an interaction network, it might, for example, be advantageous for it to interact with a number of partners, and, being disordered, the protein would be capable of using different structures to achieve these interactions. Multiple binding sites or motifs on a single disordered domain might be conducive to the formation of higher-order complexes, where disparate partners were brought into close proximity by independent binding to the same domain. In hindsight, it is easy to see why such mechanisms would be operative in systems such as transcriptional activation or cell cycle control, where the assembly of large multi-protein complexes is necessary for the process to occur.
Although the bioinformatic and in vitro experimental evidence for disorder in functional protein domains were unequivocal, there were doubts expressed that disordered proteins could function in vivo. The well-known protease sensitivity of unfolded proteins was an apparent problem, as well as the crowded nature of the cellular environment, which ought to induce folded states. One of the best explanations of the disorder phenomenon in these terms is given in a 2002 review by Dunker et al. (Reference Brown, Takayama, Campen, Vise, Marshall, Oldfield, Williams and Dunker2002) . Firstly, proteases are compartmentalized and sequestered in the cell (Frankel & Kim, Reference Frankel and Kim1991), and their reactions are highly regulated (Dunker et al. Reference Dunker, Lawson, Brown, Williams, Romero, Oh, Oldfield, Campen, Ratliff, Hipps, Ausio, Nissen, Reeves, Kang, Kissinger, Bailey, Griswold, Chiu, Garner and Obradovic2001; Wright & Dyson, Reference Wright and Dyson1999). Secondly, the disordered regions themselves may be inaccessible or lack protease sensitive sites, and some, particularly those associated with transcriptional regulation, for example, may be present in the free, disordered state only transiently as they pass from one partner to another or are associated with chaperones (Dunker et al. Reference Brown, Takayama, Campen, Vise, Marshall, Oldfield, Williams and Dunker2002). Candidate ‘nanny’ chaperones have recently been identified (Tsvetkov et al. Reference Tsvetkov, Reuven and Shaul2009b), although disordered proteins as a class display no particular preference for chaperone binding in general (Hegyi & Tompa, Reference Hegyi and Tompa2008). Chaperones themselves frequently contain a high proportion of disordered regions: 54% of residues in RNA chaperones were shown to fall in such regions (Tompa & Csermely, Reference Tompa and Csermely2004), which were suggested to function as recognition elements and loosening agents for misfolded regions via an ‘entropy transfer’ mechanism that has also been invoked in other protein–protein interactions (Sue et al. Reference Sue, Cervantes, Komives and Dyson2008). Specific disordered regions of proteins may have essential roles in folding and assembly of molecular complexes. An example of this is the assembly of IgG antibodies, which requires the presence of an unfolded heavy-chain constant domain (CH1 domain) of the heavy chain to interact with the light chain light-chain constant domain (CL domain) to form the intact IgG (Feige et al. Reference Feige, Groscurth, Marcinowski, Shimizu, Kessler, Hendershot and Buchner2009).
Molecular crowding has been found to favor folded states (Iakoucheva & Dunker, Reference Iakoucheva and Dunker2003), but this necessarily applies only to proteins that are capable of folding independently. If the energy landscape of the polypeptide is not compatible with an independently folded state, even a crowded environment cannot induce the formation of such a state (Dunker et al. Reference Brown, Takayama, Campen, Vise, Marshall, Oldfield, Williams and Dunker2002). From a topological point of view, many complexes of disordered domains have structures that can be formed only if one or both the partners are disordered before it is formed, for example, the complexes of the transcriptional adapter zinc-binding (TAZ) domains of CREB binding protein (CBP; see later section).
In this review, I will provide examples for both the types of IDPs and their myriad functional attributes. Clearly this is a field that is far from mature, and numerous examples are even now being studied and will doubtless be published before this article goes to press. I have endeavored to be as comprehensive as possible in at least mentioning seminal studies, but the literature increases every day, and I apologize for any omissions.
2. Physiological roles for IDPs
One of the earliest observations about the occurrence of IDPs was that they were present with highest frequency in certain physiological niches. Thus, IDPs were found to be enriched among cancer related and signaling proteins (Iakoucheva et al. Reference Iakoucheva, Brown, Lawson, Obradovic and Dunker2002). Disordered domains seem to be present in high frequency in regulatory proteins associated with transcription and translation, the cell cycle, signal transduction and protein phosphorylation, all processes that are in some way involved in physiological control. The central role of proteins that contain ID domains (IDDs) in crucial cellular processes argues both for the importance of disordered domains as a general structural type and for the fundamental importance of intrinsic disorder in the metabolism of living cells.
2.1 Association of IDPs with disease
One of the intriguing connections that have been made by a number of groups is that IDPs and IDDs are frequently associated with diseases. From the standpoint of genetic diseases, this is relatively easy to understand. Increases in the numbers of repeat sequences frequently presages susceptibility to hereditary neurodegenerative diseases such as Huntington's and Parkinson's diseases (Midic et al. Reference Midic, Oldfield, Dunker, Obradovic and Uversky2009; recent reviews include Uversky & Eliezer, Reference Uversky and Eliezer2009; Uversky, Reference Uversky2009a). At first sight it may be puzzling that the lesions that precipitate disease in these cases occur in disordered regions with generally low requirements for exact amino acid sequences. Why would the disease-causing mutations not been seen preferentially in the structured regions, where they would presumably have more effect? The answer to this question lies in the likelihood that the effects of deleterious mutations in structured domains of vital proteins (for example, leading to lowered stability or impaired function) would likely be so great as to prove lethal, usually in the embryonic stage. Genetic diseases caused by mutations in disordered regions can thus be regarded as a lesser evil. Mutations in disordered regions can also result in the loss of important post-transcriptional modification sites, leading to disease (Li et al. Reference Li, Iakoucheva, Mooney and Radivojac2010).
IDPs are also prevalent in diseases that are not apparently primarily inherited. The connection between disorder and diseases such as cancer, cardiovascular disease, amyloidoses, neurodegenerative diseases and diabetes has been extensively explored in recent reviews (Midic et al. Reference Midic, Oldfield, Dunker, Obradovic and Uversky2009; Uversky et al. Reference Uversky, Oldfield and Dunker2008). The authors conclude that these diseases, which have in common failures of protein signaling and structure and have been loosely grouped as ‘conformational diseases’, may be characterized not only by protein misfolding but also by failures of post-translational modification and inability to interact correctly with physiological partners (Uversky et al. Reference Uversky, Oldfield and Dunker2008). A possible rationale for the toxicity of amyloid-like aggregates was recently suggested to be the resulting sequestration of important cellular control factors, which frequently include intrinsically disordered regions (Olzscha et al. Reference Olzscha, Schermann, Woerner, Pinkert, Hecht, Tartaglia, Vendruscolo, Hayer-Hartl, Hartl and Vabulas2011). Cancer in particular has come under scrutiny: cancers frequently arise due to chromosomal translocations that result in the formation of fusion proteins, which might be expected to have a high degree of intrinsic disorder. An intriguing hypothesis to explain the uncontrolled growth of cancer cells in these cases is that the disordered segments are qualitatively different from the unfolded forms of globular proteins, thus enabling the fusion proteins to escape the normal surveillance and housekeeping functions of the cell (Hegyi et al. Reference Hegyi, Buday and Tompa2009). Another connection of IDPs to cancers occurs in the human papillomaviruses, where variants with high risk for oncogenic transformation appear to contain a higher proportion of intrinsic disorder (Uversky et al. Reference Uversky, Roman, Oldfield and Dunker2006). Indeed, it appears that more virulent strains of disease-causing viruses may be characterized by their increased levels of intrinsic disorder (Goh et al. Reference Goh, Dunker and Uversky2009), and viruses in general appear to have a high proportion of genes potentially coding for disordered proteins (Xue et al. Reference Xue, Williams, Oldfield, Goh, Dunker and Uversky2010b). Recognition of the crucial role of IDPs in a number of diseases prompts new ways of thinking in the design of drugs (Cheng et al. Reference Cheng, Legall, Oldfield, Mueller, Van, Romero, Cortese, Uversky and Dunker2006).
While the majority of the explicit connections of IDPs with disease states remain a matter of bioinformatic correlations of the occurrence of disorder in disease-related proteins, a considerable amount of basic biophysical and biochemical work has also been done to elucidate the possible molecular basis of IDP interactions. A number of possible answers to the question ‘why would proteins be disordered in order to function?’ have occurred to the community as these studies have proceeded, and these thoughts are summarized in Section 3 of this review. In later sections, I will summarize some of the experimental work that has been done in the last 10 years to elucidate the biochemical and biophysical behavior of IDPs that are known to be important in physiological processes.
3. Why would proteins be disordered?
Both bioinformatic and experimental approaches have identified intrinsic disorder in an unexpectedly large number of proteins. Given the prevalence of this observation, it behooves us to suggest possible reasons why such a repertoire should have evolved, particularly among higher organisms. The present state of the field (reviewed in Dyson & Wright, Reference Dyson and Wright2005; Gsponer & Babu, Reference Gsponer and Babu2009, among many other examples) gives the following possible reasons why a protein or part of a protein might be disordered in order to function. The list is not exhaustive, and will no doubt be expanded as more examples are discovered.
3.1 Promiscuous basal activity
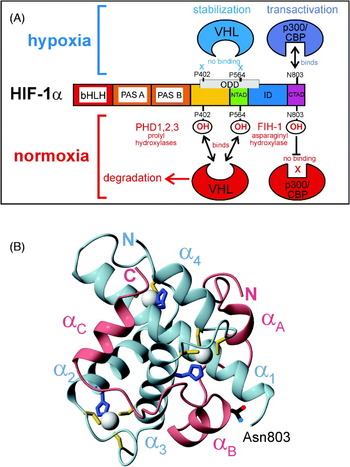
One feature that instantly comes to mind is the possibility that a disordered domain could bind in different conformations to different partners, as must occur, for example, when the cyclin-dependent kinase inhibitor p21 binds to different cyclin–CdK complexes during the cell cycle (Kriwacki et al. Reference Kriwacki, Hengst, Tennant, Reed and Wright1996). This concept was explored many years ago in the context of antibody affinities, when it was noticed that the combining sites of antibodies were frequently highly flexible (Tainer et al. Reference Tainer, Getzoff, Alexander, Houghten, Olson, Lerner and Hendrickson1984). Experimental tests aimed at observing different structures of antibody combining sites in complex with different antigens generally proved inconclusive (Wilson et al. Reference Wilson, Haft, Getzoff, Tainer, Lerner and Brenner1985), as the designs were based on crystallographic structures that showed different (static) structures in the same amino acid sequences when they were present in different proteins. With IDPs, however, the constraints imposed by the presence of ordered structure are no longer operative, and a true conformational ensemble can be explored by the sequence. The result is that a number of examples have now been found of disordered sequences that take up completely different conformations when complexed to different partners. One of the best examples is the carboxyl-terminal activation domain of the hypoxia-inducible factor α domain, Hif-1α. In complex with the TAZ1 domain of the CBP, the Hif-1α C-terminal activation domain (CAD) takes up a largely helical configuration (Dames et al. Reference Dames, Martinez-Yamout, De Guzman, Dyson and Wright2002; Freedman et al. Reference Freedman, Sun, Poy, Kung, Livingston, Wagner and Eck2002), but when bound to the enzyme that catalyzes the oxygen-dependent hydroxylation of Hif-1α, this same sequence is present as an extended structure (Elkins et al. Reference Elkins, Hewitson, Mcneill, Seibel, Schlemminger, Pugh, Ratcliffe and Schofield2003; Lee et al. Reference Lee, Kim, Jeong, Lee and Ryu2003). Other examples include chromatin remodeling proteins, which interact with a wide variety of proteins and nucleic acids (Sandhu, Reference Sandhu2009), and different isoforms of nuclear hormone receptors (Kumar & Thompson, Reference Kumar and Thompson2010; Nocula-Lugowska et al. Reference Nocula-Lugowska, Rymarczyk, Lisowski and Ozyhar2009). An interesting side issue is the appearance of disorder as a result of splice variation. Splice variants that have been structurally characterized generally differ by not more than six amino acids, although variations of much greater lengths are known. It was recently shown that the probability that one or other of the variants would be disordered increased with the size of the amino acid sequence difference between the variants, likely accounting for their absence from structure databases (Hegyi et al. Reference Hegyi, Kalmar, Horvath and Tompa2011). Alternative splicing provides a facile route to the evolution of functional diversity (Romero et al. Reference Romero, Zaidi, Fang, Uversky, Radivojac, Oldfield, Cortese, Sickmeier, Legall, Obradovic and Dunker2006; Tokuriki & Tawfik, Reference Tokuriki and Tawfik2009), pointing toward another, more subtle role for disorder in proteins.
3.2 Enhanced specificity
One of the intriguingly common features of published structures of complexes of proteins or protein domains that are disordered in the free state is the highly complementary nature of the binding to the target. The interactions between the partners are highly complicated, and involve many different surfaces. In many cases, one partner may appear to be ‘wound around’ the other partner, an interaction that simply could not occur unless the amino acid sequence in question was present before complex formation in a state that lacked its own stable 3D folded structure. An early example of such a structure includes the lymphoid enhancer-binding factor 1 high mobility group (LEF1 HMG) domain complex with DNA, where an ~100° bend is induced in the DNA structure by binding of the protein (Love et al. Reference Love, Li, Case, Giese, Grosschedl and Wright1995), which is largely disordered in solution (Love et al. Reference Love, Li, Chung, Dyson and Wright2004). Further examples of such complexes between protein partners are described in detail in Sections 6 and 8 of this review. Another class of interactions where unstructured regions are instrumental in raising the sequence-specific affinity between partners is in the interactions between a number of transcription factors and DNA. Besides the ‘snap-lock’ specificity switch that operates with structured zinc finger domains (Laity et al. Reference Laity, Dyson and Wright2000; Wuttke et al. Reference Wuttke, Foster, Case, Gottesfeld and Wright1997), a number of transcription factors contain unstructured sequences at N- or C-termini that make all-important contributions to increasing the affinity of the interaction (Gearhart et al. Reference Gearhart, Holmbeck, Evans, Dyson and Wright2003; Hill et al. Reference Hill, Roemer, Jones, Churchill and Edwards2009; Holmbeck et al. Reference Holmbeck, Foster, Casimiro, Sem, Dyson and Wright1998). This phenomenon has recently been observed in RNA–protein interactions (Kucera et al. Reference Kucera, Hodsdon and Wolin2011). The end result of the use of disordered segments in such interactions is that highly specific binding can be accomplished at modest affinity. Perhaps even more importantly for complexes that are formed as a result of the reception of discrete signals, the complexes must be capable of dissociation once the signal has been turned off. Ubiquitin-independent degradation of disordered segments (see below, this section) and competition for binding sites (see Section 8) form important components of this ‘off-switch’ mechanism.
3.3 Surface area burial and affinity
One of the most intriguing rationales for the employment of intrinsically disordered domains in interactions involving signal transduction and cellular control is the observation that the complexes formed manifest the burial of anomalously large surface area for the number of amino acids involved (Gunasekaran et al. Reference Gunasekaran, Tsai, Kumar, Zanuy and Nussinov2003). The consequence of this for the cell is that a high degree of specificity (and affinity) can be achieved for relatively little metabolic outlay: to achieve the same surface area burial employing only folded proteins would require the proteins to be much larger, imposing an unacceptable metabolic burden on the cell (Gunasekaran et al. Reference Gunasekaran, Tsai, Kumar, Zanuy and Nussinov2003). A general model has been suggested where catalytic and low-affinity binding proteins might preferentially take up ordered structures, while high-affinity binding proteins could ‘tolerate’ disorder (Liu et al. Reference Liu, Faeder and Camacho2009). These authors suggest that the model explains the role of disorder in tuning binding affinity to maximize specificity, providing a means whereby protein function can be optimized through natural selection mechanisms.
3.4 Complex connections
Many of the central functions of the cell, such as transcription of genes, require the assembly of multi-protein complexes. One of the major roles of a transcriptional coactivator such as CBP is to connect the various members of the multi-protein complex, by interacting with many different proteins at once, perhaps at many different sites on the DNA. Given this role, it seems logical that CBP contains a number of long linker sequences to allow for differences in architecture at these sites. This aspect is described in more detail in Section 5. Another intriguing aspect is the role played by disordered segments in the assembly of multi-subunit signaling complexes (Sigalov, Reference Sigalov2010).
3.5 Facilitate regulation by post-translational modification
So much of metabolism appears to involve the switching on and off of complex pathways that it is no wonder that a majority of these pathways involve chemical switches, some of which are highly ingenious (the direct influence of oxygen chemistry on the regulation of the hypoxia response by the Hif factors is one example). IDPs provide an excellent vehicle for the control of biological switches by post-translational modification. Sites of phosphorylation, methylation, hydroxylation, etc., frequently occur in disordered regions of otherwise highly structured proteins – the Hif-1α system provides one rationale for such an arrangement, where the structural requirements for enzymatic modification and target binding are different, and can be accommodated because the interaction domain containing the hydroxylation site is disordered and thus capable of taking up either conformation. Post-translational modification and its relation to disordered proteins are explored in detail in Section 9.
3.6 Regulation by proteolysis
As mentioned previously, all IDPs are not necessarily particularly susceptible to proteolysis, and, since proteolysis is generally highly regulated in viable cells, IDPs probably have the potential for cellular lifetimes appropriate to their function. Nevertheless, the probability of rapid degradation of a disordered region in the free state has been carefully explored by several groups. The abundance of IDPs in the cell, which may precipitate disease states if perturbed, has been shown to be tightly regulated by several cellular processes, including mRNA transcript clearance, translational rate and proteolytic clearance (Gsponer et al. Reference Gsponer, Futschik, Teichmann and Babu2008). Degradation of several cancer-associated proteins, which are frequently disordered, was shown to be proteasome-mediated, but occur independent of ubiquitination (Jariel-Encontre et al. Reference Jariel-Encontre, Bossis and Piechaczyk2008). Ubiquitin-independent degradation would allow for rapid clearance of potentially harmful proteins, without the necessity for specific intact ubiquitination sites, which could potentially be inactivated by mutation. The involvement of the molten globule-like C-terminal region of free IκBα in its rapid ubiquitin-independent degradation by the 20S proteasome has been recently documented (Mathes et al. Reference Mathes, Wang, Komives and Ghosh2010; O'Dea et al. Reference O'Dea, Barken, Peralta, Tran, Werner, Kearns, Levchenko and Hoffmann2007). The disordered N-terminal transactivation domain (N-TAD) of the tumor suppressor p53 was recently shown to be degraded by a rapid ubiquitin-independent pathway involving the 20S proteasome, as well as a slower ubiquitin-dependent process mediated by the 26S proteasome (Tsvetkov et al. Reference Tsvetkov, Reuven, Prives and Shaul2009a). Interestingly, the rapid process is blocked by proteins such as Hdmx that bind to the p53 N-terminus (Tsvetkov et al. Reference Tsvetkov, Reuven, Prives and Shaul2009a), suggesting that complex formation that sequesters the disordered domain in a stable structure abrogates the ubiquitin-independent degradation process. A more detailed exploration of the p53-Hdm interaction network is presented in Section 8.
3.7 Regulation by competition between IDP ligands
Much thought has been given by a number of groups to the thermodynamic and kinetic consequences of the lack of structure in IDPs, in particular for the energetics of complex formation. These studies are described in Section 8. Why does not the process of coupled folding and binding involve an unacceptable entropy penalty from the folding of the IDP? It has now been demonstrated in a number of experimental systems that the entropy penalty for folding of an IDP is not unacceptably high when there is sufficient enthalpy driving the reaction. Indeed, the enthalpy compensation of, for example phosphorylation, can provide a precise conformational switch, such as occurs in the phosphorylated kinase-interaction domain (pKID)/KIX complex (Radhakrishnan et al. Reference Radhakrishnan, Perez-Alvarado, Parker, Dyson, Montminy and Wright1997). These and other examples are discussed at greater length in Sections 8 and 9. One of the most intellectually satisfying justifications for disorder in domains that compete for the same binding sites or partner molecules is the concept of competition for scarce regulatory molecules by various disordered domains (De Guzman et al. Reference De Guzman, Martinez-Yamout, Dyson, Wright, Iuchi and Kuldell2004b). In some systems, the binding sites for different domains on the same partner differ slightly, so that one could envisage the competition for the binding site at the molecular level as a ‘stripping’ or ‘peeling’ reaction. This concept, and the experimental data that support it, are described in Section 8.
3.8 Higher capture radius for formation of complexes
Originally proposed by the Wolynes group (Bryngelson et al. Reference Bryngelson, Onuchic, Socci and Wolynes1995; Shoemaker et al. Reference Shoemaker, Portman and Wolynes2000), the concept of ‘fly-casting’ suggests that disorder in a polypeptide chain enhances the capture radius of the chain, with consequences for the kinetics of complex formation. This attractive concept has not received unequivocal support from later experiments or simulations, at least in part following the realization that the conformational ensemble of an intrinsically disordered domain would on average have quite a small radius, due to the presence of significant numbers of relatively compact conformers, that is, the probability that a given conformer would be fully extended and therefore have a capture radius greater than average, would be quite low. Nevertheless, one can imagine that at least the possibility of such a conformer exists for the disordered protein, whereas if the polypeptide were present as a globular folded domain, the probability of such conformer would be extremely small.
3.9 Bulk physicochemical effects
Since the solvent-accessible surface of a disordered ensemble is greater than that of a globular folded protein of the same size, it might be expected to have a proportionally greater effect on the bulk physical chemistry of the solution. Such an effect has been demonstrated, for example in the cryoprotective functions of dehydrins (Hughes & Graether, Reference Hughes and Graether2010) and in proteins associated with desiccation tolerance (Chakrabortee et al. Reference Chakrabortee, Meersman, Kaminski Schierle, Bertoncini, Mcgee, Kaminski and Tunnacliffe2010).
3.10 Increased disorder required for function
Although this behavior may ultimately prove to be widespread, there are at present only a few systems known where the unfolded form is the functional one and the folded form is non-functional. Examples include the redox-regulated chaperone Hsp33, which contains a C-terminal zinc-binding site (Graf et al. Reference Graf, Martinez-Yamout, Vanhaerents, Lilie, Dyson and Jakob2004). In the absence of oxidative stress, the reduced form of Hsp33 binds zinc to form a well-structured domain (Won et al. Reference Won, Low, Guzman, Martinez-Yamout, Jakob and Dyson2004). Oxidation of the zinc-binding cysteines causes release of the zinc and loss of structure in the C-terminal domain, leading to dimerization and activation of the chaperone. Such a requirement for conformational freedom is also seen in the nematode anticoagulant NAPc2 (Duggan et al. Reference Duggan, Dyson and Wright1999) and in the IκBα inhibitor of nuclear factor κB (NF-κB), where stabilizing mutations in the poorly ordered parts of the ankyrin repeat (AR) domain result in loss of the stripping function of IκBα (Bergqvist et al. Reference Bergqvist, Alverdi, Mengel, Hoffmann, Ghosh and Komives2009; Ferreiro et al. Reference Ferreiro, Cervantes, Truhlar, Cho, Wolynes and Komives2007).
4. Special new concepts – Molecular Recognition Features (MoRFs), fuzzy complexes, hub proteins
Because the whole idea of the functional disordered protein is new and difficult to describe, this infant field has given rise to a number of new technical terms that should perhaps be introduced and defined early in this review. The first term is one which has a number of synonyms – ‘intrinsically disordered protein’ itself. Because the concept arose in several fields independently at about the same time, the terminology in each field began slightly differently, with ‘intrinsically unstructured’ (Wright & Dyson, Reference Wright and Dyson1999), ‘natively unfolded’ (Weinreb et al. Reference Weinreb, Zhen, Poon, Conway and Lansbury1996), ‘natively or intrinsically disordered’ (Dunker et al. Reference Brown, Takayama, Campen, Vise, Marshall, Oldfield, Williams and Dunker2002) and even ‘rheomorphic’ (Holt & Sawyer, Reference Holt and Sawyer1993). At a recent conference (Barcelona BioMed Conference ‘Intrinsically Disordered Proteins in Biomedicine’, October 2010), a consensus was reached among the participants that the terminology ‘intrinsically disordered’ was the most descriptive and the least open to misinterpretation, and this term is accordingly used throughout the text of this review.
4.1 MoRFs, MoREs and more
The term Molecular Recognition Feature (MoRF) or Molecular Recognition Element (MoRE) was introduced in 2005 to describe a particular type of relatively short, perhaps marginally structured protein region within a longer, largely disordered sequence (Mohan et al. Reference Mohan, Oldfield, Radivojac, Vacic, Cortese, Dunker and Uversky2006; Oldfield et al. Reference Oldfield, Cheng, Cortese, Romero, Uversky and Dunker2005; Vacic et al. Reference Vacic, Oldfield, Mohan, Radivojac, Cortese, Uversky and Dunker2007). The key characteristics of a MoRF are that it is the site of binding of the disordered protein to a partner, and that it undergoes some form of disorder-to-order transition upon binding. MoRFs were classified as α-MoRFs, β-MoRFs and ι(iota)-MoRFs, according to whether α-, β-, or irregular secondary structure type was formed upon binding (it is not clear how to classify a sequence such as Hif-1α, which forms α-structure in one complex (Dames et al. Reference Dames, Martinez-Yamout, De Guzman, Dyson and Wright2002; Freedman et al. Reference Freedman, Sun, Poy, Kung, Livingston, Wagner and Eck2002) and β-structure in another (Elkins et al. Reference Elkins, Hewitson, Mcneill, Seibel, Schlemminger, Pugh, Ratcliffe and Schofield2003; Lee et al. Reference Lee, Kim, Jeong, Lee and Ryu2003)). MoRFs may have a propensity for formation of residual structure in the free state (Kim et al. Reference Kim, Lee, Nam, Chi, Chang and Han2009; Mohan et al. Reference Mohan, Oldfield, Radivojac, Vacic, Cortese, Dunker and Uversky2006), although this may be hard to detect experimentally (Zor et al. Reference Zor, Mayr, Dyson, Montminy and Wright2002). At least in the case of the short linear motifs recognized by SH2, SH3 and Ser/Thr kinase domains, these sequences may be conserved between species (Ren et al. Reference Ren, Uversky, Chen, Dunker and Obradovic2008).
4.2 Fuzzy complexes
The term ‘fuzzy complexes’ was coined to emphasize the fluid nature of protein–protein interactions (Tompa & Fuxreiter, Reference Tompa and Fuxreiter2008), and to point out that this attribute of many, if not all, important protein complexes provides a reminder that high-throughput methods to define the structures of all complexes (the ‘interactome’) may be doomed to frustration, if not to failure. Four modes of structural disorder or fuzziness in complexes were defined, covering the major forms of static and dynamic disorder that might be expected in complexes. A noteworthy dialogue (Chatr-Aryamontri et al. Reference Chatr-Aryamontri, Ceol, Licata and Cesareni2008; Fuxreiter & Tompa, Reference Fuxreiter and Tompa2009; Welch, Reference Welch2009; Wilkins & Kummerfeld, Reference Wilkins and Kummerfeld2008), published over several months has refined and expanded the ‘fuzzy’ concept, with references both to early papers (Alberts, Reference Alberts1998; Srere, Reference Srere2000) and to more recent reviews pointing out the pitfalls of too great a reliance on the results of high-throughput experiments, particularly in the realm of protein–protein interactions (Mackay et al. Reference Mackay, Sunde, Lowry, Crossley and Matthews2007).
4.3 Malleable machines
The important processes in the cell frequently require the assembly and operation of molecular machines. Those machines whose operation is not constant, but which must be turned on in response to signals or other metabolic requirements of a given cell, frequently contain components that are less than fully structured, and sometimes completely disordered, within a matrix of other, more or less rigid components. Such a ‘malleable machine’ (Fuxreiter et al. Reference Fuxreiter, Tompa, Simon, Uversky, Hansen and Asturias2008) would presumably be better capable than an entirely rigid entity of responding to different conditions, recognizing multiple targets that may have different structures, and allowing or facilitating conformational rearrangements.
4.4 Hub proteins
The full inventory of all the interactions in a given cell is termed the interactome (Sanchez et al. Reference Sanchez, Lachaize, Janody, Bellon, Roder, Euzenat, Rechenmann and Jacq1999). This information can be systematically classified in network diagrams; within such a diagram, the proteins comprise the network nodes, most of which are connected to only a few other proteins. However, some proteins, termed ‘hub proteins’ (Albert et al. Reference Albert, Jeong and Barabasi2000; Han et al. Reference Han, Dupuy, Bertin, Cusick and Vidal2005), are connected to many more partners than the average. Hub proteins determine the organization of the network, since their removal or inactivation would cause severe disruption. Bioinformatic studies have consistently identified a higher-than-average proportion of intrinsic disorder in hub proteins (Dosztanyi et al. Reference Dosztanyi, Chen, Dunker, Simon and Tompa2006; Dunker et al. Reference Dunker, Cortese, Romero, Iakoucheva and Uversky2005; Haynes et al. Reference Haynes, Oldfield, Ji, Klitgord, Cusick, Radivojac, Uversky, Vidal and Iakoucheva2006; Kim et al. Reference Kim, Sboner, Xia and Gerstein2008), particularly when the proteins are not correlated in their mRNA expression (Singh et al. Reference Singh, Ganapathi and Dash2007). Several recent review articles provide an interesting analysis of the actual nature of hub proteins, distinct from their positions in interactome maps (Stein et al. Reference Stein, Pache, Bernado, Pons and Aloy2009; Tsai et al. Reference Tsai, Ma and Nussinov2009b; Tyagi et al. Reference Tyagi, Shoemaker, Bryant and Panchenko2009).
5. Intrinsic disorder as function: linkers and repeats
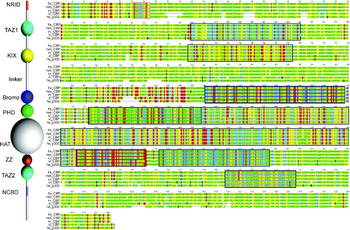
As mentioned in Section 3, one of the major functional roles of intrinsically disordered segments appears to be in the provision of linker sequences between interaction domains that may or may not be well-structured. For example, the CBP protein (Fig. 1) contains well-structured domains such as KIX and the TAZ domains, and unstructured interaction domains such as the nuclear coactivator binding domain (NCBD), and in between these sequences there are frequently lengthy segments that are not conserved in amino acid sequence or even necessarily in length, but are conserved in their amino acid composition (Dyson & Wright, Reference Dyson and Wright2005).
5.1 Linkers
Although the role of linker sequences is likely to be primarily topological, allowing distant parts of the polypeptide chain to interact with diverse partner sequences that might be far apart or close together, linkers and unstructured tail sequences play quite specific roles in a number of systems. The critical role of a linker sequence in the operation of the E2-RING finger switch in the ubiquitylation complex was recently demonstrated by a combination of biophysical measurements (Das, Reference Das2009), and the further role of linker motions in the Cullin-RING E3 ligases was suggested by molecular dynamics calculations (Liu & Nussinov, Reference Liu and Nussinov2010a). Further details on the role of intrinsic disorder in the ubiquitin system are presented in Section 9. Computational examination of the influence of the presence of a flexible linker on the affinity of multi-domain transcription factors for DNA (Vuzman et al. Reference Vuzman, Azia and Levy2010a, Reference Vuzman, Polonsky and Levyb) showed a significant increase in expected affinity, which was ascribed to an enhanced ability to slide along the DNA sequence to find specific binding sites. This sliding from non-specific to specific binding was mediated by NA-binding domains of different affinities and by the presence of unstructured tails on the proteins. The detection of secondary structure preferences in a disordered peptide derived from aggrecan (Jowitt et al. Reference Jowitt, Murdoch, Baldock, Berry, Day and Hardingham2010) and the apparent presence of a semi-ordered structure in this sequence provides another variation on the linker function of disordered domains. In this case, there appears to be a requirement for more rigidity than would be available for a fully disordered chain.
Schematic figure showing (left) the domain structure of CBP and (right) alignment of amino acid sequences of CBP from human (hs), mouse (mm), rat (rn), frog (xl) and its paralog p300 from human (hs). Amino acids are colored according to the classification acidic Glu, Asp (red); basic Lys, Arg, His (blue), hydrophobic Val, Leu, Ile, Phe, Tyr, Met (yellow), rare Cys, Trp (purple) and disorder-promoting Gly, Ala, Ser, Thr, Pro, Asn, Gln (green). Vertical black lines indicate the presence of short insertions relative to the sequence of human CBP. Aligned sequences corresponding to the structured domains denoted by spheres on the left are boxed with the corresponding color.

5.2 Scaffolding proteins
The detection of intrinsic disorder in scaffolding proteins using bioinformatic methods has been extensively reviewed (Cortese et al. Reference Cortese, Uversky and Dunker2008). The role of disorder in scaffold proteins was hypothesized to involve many of the classic rationales, including fly-casting and masking of intramolecular interactions. Experimental verification of the presence of extensive disorder in an important scaffolding protein, Axin, was recently published (Noutsou et al. Reference Noutsou, Duarte, Anvarian, Didenko, Minde, Kuper, De, Oikonomou, Friedler, Boelens, Rudiger and Maurice2011).
5.3 Repeat sequences
Among the most common fully disordered regions in the proteome are those that consist of repeats of short sequence motifs. In addition, however, repeat sequences also comprise a number of structured domains, such as zinc finger repeats, ARs and armadillo repeats. Structured repeat sequences will not be considered further in this review, but are briefly discussed, with extensive references, by Matsushima et al. (Reference Matsushima, Yoshida, Kumaki, Kamiya, Tanaka, Izumi and Kretsinger2008) . This excellent review focuses in detail on the various, largely unstructured, tandem repeat sequences presently available in sequence databases, as well as cataloguing the various conformational preferences that tandem repeat sequences may take up. The reader is referred to the ‘outstanding questions’ and ‘concluding remarks’ sections at the end of this review for a cogent summary of the main issues surrounding disordered repeat sequences.
The connection of repeat sequences, especially when they are expanded beyond normal numbers, to diseases such as Huntington's disease highlights an important characteristic of IDPs – their tendency to form aggregates. Detection of fibrils and plaques are used to diagnose degenerative diseases, although the actual toxic species may rather be a smaller oligomer than a large, presumably inert aggregate (Merlini & Bellotti, Reference Merlini and Bellotti2003). The aggregation mechanism of the expanded polyglutamine repeat sequences that occur in Huntington's disease has been shown to be complex and strongly length dependent (Thakur et al. Reference Thakur, Jayaraman, Mishra, Thakur, Chellgren, Byeon, Anjum, Kodali, Creamer, Conway, Gronenborn and Wetzel2009). Repeat sequences are associated with a disease of a different nature: both the merozoite and sporozoite forms of the malaria parasite Plasmodium falciparum contain highly hydrophilic repeat sequences, which can form both local secondary structures similar to reverse turns (Dyson et al. Reference Dyson, Satterthwait, Lerner and Wright1990) and amyloid-like fibrils (Adda et al. Reference Adda, Murphy, Sunde, Waddington, Schloegel, Talbo, Vingas, Kienzle, Masciantonio, Howlett, Hodder, Foley and Anders2009).
5.3.1 Examples
Long intrinsically disordered regions that most likely function as linkers are no longer being ignored as a nuisance in structure determination of folded domains though they remain an important bar to the crystallization of proteins. Structural characterization of proteins containing disordered regions is more facile using solution methods such as nuclear magnetic resonance (NMR) or computational methods such as molecular dynamics, and a number of systems have recently been reported. These include G protein-coupled receptors, where the disordered regions appear to contain an unusual preponderance of positively charged residues (Lys, Arg and His), thought to be involved either in positioning of the transmembrane helices or in interacting with specific signaling partners (Jaakola et al. Reference Jaakola, Prilusky, Sussman and Goldman2005).
Human replication protein A has been characterized both structurally and dynamically by NMR (Olson et al. Reference Olson, Narayanaswami, Vise, Lowry, Wold and Daughdrill2005). NMR relaxation and relaxation dispersion measurements provide biophysical information on dynamics and segmental motion that is unparalleled (Palmer, Reference Palmer2004). However, the analysis of the data for linkers and other disordered regions attached to more ordered or structured domains has been somewhat problematic: the presence of the disordered chain precludes the employment of a number of simplifying assumptions that are routinely used for analysis of relaxation data for folded proteins. Further details and examples of NMR studies of IDP dynamics are presented in Section 11.
Another example that has received both experimental and computational attention is the interaction between two domains, the PDZ and BAR domains, of PICK1, a conserved membrane protein (He et al. Reference He, Liwo, Weinstein and Scheraga2011; Xu & Xia, Reference Xu and Xia2006). PICK1 is one of the few proteins that contain both a PDZ (known for interacting with membrane proteins) and a BAR (which binds to lipids). The two domains are separated by a linker sequence of some 40 residues. Molecular dynamics simulations suggest that the role of the linker in PICK1 is to facilitate initial weak hydrophobic interactions between the two domains, subsequently allowing sliding and repositioning of the domains for the most favorable interaction (He et al. Reference He, Liwo, Weinstein and Scheraga2011).
5.4 Alternative splicing, evolution and evolvability
An important source of intrinsic disorder in protein variants is the existence of alternative splicing of mRNA, which might be expected to increase the likelihood of disorder in one or more splice variants by the addition or excision of a peptide segment that may disrupt the 3D structure present in the alternative variant (Pentony & Jones, Reference Pentony and Jones2010). Alternative splice sites frequently occur within intrinsically disordered segments, which allows for the requisite diversity of function and interaction without causing major structural disruption (Romero et al. Reference Romero, Zaidi, Fang, Uversky, Radivojac, Oldfield, Cortese, Sickmeier, Legall, Obradovic and Dunker2006). Many of the factors that mediate alternative splicing of mRNA are themselves intrinsically unstructured, which appears to be necessary for spliceosome assembly and for interaction with many partners (Haynes & Iakoucheva, Reference Haynes and Iakoucheva2006; Wang et al. Reference Wang, Zhang, Zhang, Huang, Xu, Wang, Liu, Wu and Shi2010). Alternative splicing confers variability, with possible advantages for evolutionary fitness, but may also be a prelude to disease, as in the case of oncogenic fusion proteins (Hegyi et al. Reference Hegyi, Buday and Tompa2009, Reference Hegyi, Kalmar, Horvath and Tompa2011).
Dual coding in alternate reading frames of the same gene frequently correlates with intrinsic disorder (Kovacs et al. Reference Kovacs, Tompa, Liliom and Kalmar2010), which may provide a mechanism for the generation of novel IDPs. New proteins are also thought to arise through overlapping genes (Rancurel et al. Reference Rancurel, Khosravi, Dunker, Romero and Karlin2009), and the rate of evolution appears to be greater for proteins containing intrinsically disordered or repeat sequences (Alba et al. Reference Alba, Tompa and Veitia2007; Brown et al. Reference Brown, Takayama, Campen, Vise, Marshall, Oldfield, Williams and Dunker2002). Interestingly, the frequency of repeated and intrinsically disordered sequences is much greater in higher organisms than in prokaryotes (Alba et al. Reference Alba, Tompa and Veitia2007); the highest degree of disorder overall appears to reside in the lower eukaryotes (Mohan et al. Reference Mohan, Sullivan, Radivojac, Dunker and Uversky2008) (see, for example the surface proteins of the malaria parasite mentioned above), perhaps as an aid to protein–protein interactions (Mohan et al. Reference Mohan, Sullivan, Radivojac, Dunker and Uversky2008).
6. Intrinsic disorder as part of function: coupled folding and binding
While some proteins are completely disordered in the absence of their physiological partner and fold into globular structures only upon binding, most coupled folding and binding events involve relatively short amphipathic motifs contained within longer disordered sequences (otherwise known as MoRFs or MoREs, see Section 4). The past few years have seen a meteoric increase in the number and richness of the systems where coupled folding and binding are seen. This field has been reviewed several times recently (Dyson and Wright, Reference Dyson and Wright2002, Reference Dyson and Wright2005; Uversky, Reference Uversky2010; Wright & Dyson, Reference Wright and Dyson2009), but the concept is so central to the entire rationale for the existence of IDPs that work on several systems mentioned in these previous reviews will be expanded and updated in the following paragraphs. A recent rather comprehensive compendium of disorder-related complexes can be found in Uversky (Reference Uversky2010).
6.1 Transcriptional activation: partners of the KIX domain of CBP
Among the earliest domains that were identified as disordered in their functional state were many of the interacting partners of the transcriptional coactivator CBP and its paralog p300 (Fig. 1). This molecule, 2441 amino acids in length, serves as a central enabler in the transcription of activated genes, providing a bridge between the upstream activation site and the transcriptional initiation complex. CBP/p300 contains a number of structured domains, linked by disordered regions of varying length. Some of the interacting domains of CBP are themselves intrinsically disordered, and fold upon interaction with their partners in a process that we have termed ‘mutual synergistic folding’ (Demarest et al. Reference Demarest, Martinez-Yamout, Chung, Chen, Xu, Dyson, Evans and Wright2002), which is described more fully in a later paragraph of this section. One of the best-characterized interaction domains of CBP is the KIX domain, spanning residues 587–673. This domain is independently folded in the absence of binding partners, but most of its partners are disordered, and fold upon binding. This was first demonstrated for the pKID of CREB (Radhakrishnan et al. Reference Radhakrishnan, Perez-Alvarado, Parker, Dyson, Montminy and Wright1997), which is disordered in the absence of KIX (Radhakrishnan et al. Reference Radhakrishnan, Perez-Alvarado, Dyson and Wright1998). The unphosphorylated domain has a much lower affinity for KIX; an interaction between unphosphorylated KID and KIX can be detected by NMR (Zor et al. Reference Zor, Mayr, Dyson, Montminy and Wright2002) though previously unseen by less sensitive methods. Importantly, phosphorylation does not affect the conformational equilibrium in free KID (Radhakrishnan et al. Reference Radhakrishnan, Perez-Alvarado, Dyson and Wright1998). The affinity of pKID for KIX is dominated by enthalpy terms related to the charge of the phosphorylated Ser133 of CREB (Zor et al. Reference Zor, Mayr, Dyson, Montminy and Wright2002), and is not significantly affected by the presence or absence of residual secondary structure in the free pKID or KID or an alternative partner c-Myb (Zor et al. Reference Zor, Mayr, Dyson, Montminy and Wright2002). The status of KIX as a multiple-site binding module was established by a comparison of the binding of a third partner, the mixed lineage leukemia (MLL) interaction domain, at a completely independent site on KIX (Goto et al. Reference Goto, Zor, Martinez-Yamout, Dyson and Wright2002). Interactions of two partners with KIX to form ternary complexes (KIX/MLL/c-Myb or KIX/MLL/pKID) showed a 2-fold increase in affinity for pKID or c-Myb in the presence of KIX and MLL, compared with KIX alone (Goto et al. Reference Goto, Zor, Martinez-Yamout, Dyson and Wright2002). The structural basis for this cooperative behavior appears to be the presence of small structural changes and additional ordering of the KIX domain in the ternary complex (De Guzman et al. Reference De Guzman, Goto, Dyson and Wright2006).
An extensive NMR study, employing relaxation dispersion and chemical shift titrations, showed that the mechanism of coupled folding and binding of pKID to KIX employed ‘folding upon binding’ under NMR conditions in preference to the ‘conformational selection’ model (Sugase et al. Reference Sugase, Dyson and Wright2007a). This observation has profound implications for the thermodynamic and kinetic basis for coupled folding and binding, and is discussed, with several other examples showing different behavior, in Section 7.
6.2 Disordered regions of the tumor suppressor p53
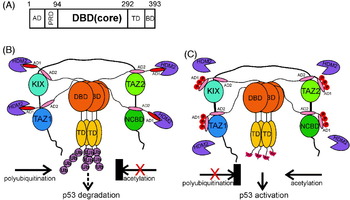
As a central player in the regulation of cell growth and division, as well as the site of many known mutations in transformed cells leading to cancers, the tumor suppressor p53 has received an enormous amount of attention. This molecule contains both ordered and disordered regions (Fig. 2). The ordered DBD binds DNA, while the TD mediates tetramerization of the protein. p53 is comprehensively regulated by post-translational modification, principally phosphorylation and acetylation, which modulate the function and the lifetime of the protein in the cell, in response to external signals. The pre-eminent region that undergoes phosphorylation is the N-terminal TAD, which contains seven major phosphorylation sites. The TAD is disordered in solution, but becomes ordered to various degrees and in various sites when bound to partner molecules such as MDM2 (Kussie et al. Reference Kussie, Gorina, Marechal, Elenbaas, Moreau, Levine and Pavletich1996) and the KIX, TAZ1, TAZ2 and NCBD domains of CBP/p300 (Feng et al. Reference Feng, Jenkins, Durell, Hayashi, Mazur, Cherry, Tropea, Miller, Wlodawer, Appella and Bai2009; Ferreon et al. Reference Ferreon, Lee, Arai, Martinez-Yamout, Dyson and Wright2009b; Lee et al. Reference Lee, Arai, Martinez-Yamout, Dyson and Wright2009, Reference Lee, Martinez-Yamout, Dyson and Wright2010b). Phosphorylation changes the affinity of p53 for partners such as MDM2 and the CBP domains (Ferreon et al. Reference Ferreon, Lee, Arai, Martinez-Yamout, Dyson and Wright2009b), and multiple phosphorylations enhance and modify the interactions (Lee et al. Reference Lee, Ferreon, Ferreon, Arai and Wright2010a). Residual structure in the AD1 and AD2 regions of the p53 TAD has been detected by NMR (Ferreon et al. Reference Ferreon, Lee, Arai, Martinez-Yamout, Dyson and Wright2009b; Lee et al. Reference Lee, Mok, Muhandiram, Park, Suk, Kim, Chang, Sung, Choi and Han2000) and inferred from principal component analysis of the conformational ensemble of the free protein (Lowry et al. Reference Lowry, Hausrath and Daughdrill2008a). The C-terminus of p53, another intrinsically disordered region, adopts multiple structures upon binding different partners (Oldfield et al. Reference Oldfield, Meng, Yang, Yang, Uversky and Dunker2008), apparently mediated both by charge and hydrophobic interactions (Chen, Reference Chen2009).
6.3 Mutual synergistic folding
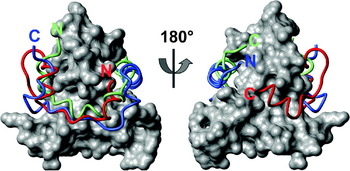
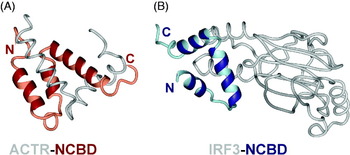
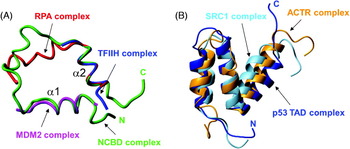
An extreme form of coupled folding and binding occurs when both partners are more or less disordered in their free state, but become well-ordered upon interaction. Such an interaction occurs between the p160 nuclear hormone receptor coactivator and the NCBD of CBP/p300 (Demarest et al. Reference Demarest, Martinez-Yamout, Chung, Chen, Xu, Dyson, Evans and Wright2002). The free form of the p160 interaction domain (termed ACTR) is almost completely disordered in solution, whereas the NCBD of CBP retains some helical structure according to the CD spectrum, but is not apparently cooperatively folded (Demarest et al. Reference Demarest, Martinez-Yamout, Chung, Chen, Xu, Dyson, Evans and Wright2002) and thus may be termed a molten globule-like state (Demarest et al. Reference Demarest, Martinez-Yamout, Chung, Chen, Xu, Dyson, Evans and Wright2002; Kjaergaard et al. Reference Kjaergaard, Teilum and Poulsen2010). The complex is cooperatively folded and highly helical. Other complexes of the NCBD with different partner proteins show differences in the NCBD structure, which is perhaps not surprising, given the malleability of the free state molten globule. The partner proteins take up widely differing positions on the surface of the NCBD. This subject is described more fully in Section 8.
A. Schematic diagram showing domains of the tumor suppressor p53. AD: activation domain; PRD: proline-rich domain; DBD: DNA binding domain; TD: tetramerization domain; BD: C-terminal regulatory domain. B. Schematic figure illustrating the model for the interactions of p53 with CBP and HDM2 (adapted from Ferreon et al. Reference Ferreon, Lee, Arai, Martinez-Yamout, Dyson and Wright2009b).

Another variation on the theme of synergistic folding is provided by the NF-κB–IκBα system. In the absence of extracellular signals, NF-κB is present in the cytoplasm in complex with IκBα. The premier sources of binding energy for this complex are interactions that occur at either end of the IκBα AR domain (Bergqvist et al. Reference Bergqvist, Ghosh and Komives2008), both involving coupled folding and binding. The C-terminal region of IκBα, consisting of ARs 5 and 6 and the proline-glutamic acid-serine-threonine (PEST)-containing sequence, folds upon binding to NF-κB (Sue et al. Reference Sue, Cervantes, Komives and Dyson2008; Truhlar et al. Reference Truhlar, Torpey and Komives2006). Conversely, it is the intrinsically disordered nuclear localization sequence of the p65 subunit of NF-κB that undergoes a binding-associated folding upon interacting with IκBα (Bergqvist et al. Reference Bergqvist, Croy, Kjaergaard, Huxford, Ghosh and Komives2006; Cervantes et al. Reference Cervantes, Bergqvist, Kjaergaard, Kroon, Sue, Dyson and Komives2010). Clearly in this case the coupled folding and binding of the two interacting molecules represent a sensitive adjustment of the formation of the complex to both thermodynamic and kinetic demands in a system that must respond rapidly and correctly to signals as they arrive.
6.4 Calmodulin signaling
Calcium signals are transduced by calmodulin through its interactions with a number of partner proteins. Bioinformatic studies revealed that these protein–protein interactions likely involved the coupled binding and folding of disordered regions in both calmodulin and its partner proteins (Dunker et al. Reference Dunker, Garner, Guilliot, Romero, Albrecht, Hart, Obradovic, Kissinger and Villafranca1998; Radivojac et al. Reference Radivojac, Vucetic, O'Connor, Uversky, Obradovic and Dunker2006). The flexible linker between the two calcium-binding domains mediates the interactions with partner proteins, allowing the calcium-binding domains to wrap around the partner.
6.5 Proline-rich sequences and their partners
Eukaryotic signal transduction frequently involves the interaction of proline-rich sequences with small folded domains such as the SH3 (Mayer et al. Reference Mayer, Hamaguchi and Hanafusa1988; Stahl et al. Reference Stahl, Ferenz, Kelleher, Kriz and Knopf1988) and WW (Bork & Sudol, Reference Bork and Sudol1994) domains. The interactions are dynamic and weak, as befits their role in signaling (Gu & Helms, Reference Gu and Helms2005).
6.6 Binding without folding
Although the classic idea of ‘binding’ implies an increase in order, a number of interactions between disordered proteins appear to retain significant disorder in one or both binding partners. Such interactions, which have been termed ‘fuzzy’ (Tompa & Fuxreiter, Reference Tompa and Fuxreiter2008) or ‘cloud contacts’ (Uversky, Reference Uversky2010) may consist of multiple weak interactions: the IDP uses multiple binding sites, while contacting multiple sites of the partner. Some examples include the interactions of the cystic fibrosis transmembrane conductance regulator (CFTR) regulatory region with the NBD1 (Baker et al. Reference Baker, Hudson, Kanelis, Choy, Thibodeau, Thomas and Forman-Kay2007), the Sic1 protein with an ubiquitin ligase subunit (Borg et al. Reference Borg, Mittag, Pawson, Tyers, Forman-Kay and Chan2007; Mittag et al. Reference Mittag, Marsh, Grishaev, Orlicky, Lin, Sicheri, Tyers and Forman-Kay2010), and the cytoplasmic domain of the T-cell receptor ζ chain with the SIV nef protein (Sigalov et al. Reference Sigalov, Kim, Saline and Stern2008).
7. Thermodynamics and kinetics
The thermodynamic underpinning of the IDP phenomenon retains a fascination for protein chemists of all persuasions. If the protein is disordered in its free state, then there are many low-energy states that are significantly populated, in contrast to the single (or small number of closely-related) states populated by folded proteins. Thus, the primary operative feature of an IDP would appear to be elevated entropy, which must be counteracted (at some energy cost) when the IDP folds upon binding to its partner. It follows that the enthalpy change associated with the folding and binding process must be large enough to compensate, and this appears to be the case, for example, in the binding of the phosphorylated form of the kinase-inducible domain of CREB (pKID) to the KIX domain of CBP (Zor et al. Reference Zor, Mayr, Dyson, Montminy and Wright2002). Nevertheless, there are other factors that are needed to fill out this simplistic picture, and a number of groups have addressed the problem. A quantitative thermodynamic theory for IDPs (Liu et al. Reference Liu, Faeder and Camacho2009) was used to predict the types of functional proteins that might have a greater likelihood of employing intrinsically disordered regions. While catalytic proteins and low-affinity binding proteins appear to have a preference for ordered structures, disorder was predicted to be significantly more prevalent for binding proteins with high affinities (Liu et al. Reference Liu, Faeder and Camacho2009). The thermodynamic basis for the variation in binding-induced biomolecular switches was examined (Vallee-Belisle et al. Reference Vallee-Belisle, Ricci and Plaxco2009), and was formulated in terms of a trade-off between the potential amplitude of the signal change and the affinity of the interaction. This trade-off was also invoked to explain the results of a computational study on a structural protein–protein interaction network dataset (Carbonell et al. Reference Carbonell, Nussinov and Del Sol2009). The question ‘How can peptides overcome the entropic cost involved in switching from an unstructured, flexible peptide to a rigid well-defined bound structure?’ (London et al. Reference London, Movshovitz-Attias and Schueler-Furman2010) was addressed by analyzing a database of high-resolution structures of peptide–protein complexes. The entropy cost appeared to be minimized when there was little conformational change of the partner protein upon binding. Other contributory factors included the optimization of packing at the interface, the increased number of hydrogen bonds formed at the interface and the disproportionately large contribution to the binding energy of particular residues termed ‘hot spots’ (London et al. Reference London, Movshovitz-Attias and Schueler-Furman2010). The interaction of proteins with DNA provides another example where enthalpy and entropy appear to have different roles in the interactions: binding of proteins in the DNA major groove is mostly driven by enthalpy, while minor groove binding is entropically driven (Privalov et al. Reference Privalov, Dragan, Crane-Robinson, Breslauer, Remeta and Minetti2007). This distinction appears to be related to the difference in hydration properties between the major and minor grooves of DNA, which gives a clue as to why the entropic penalty for coupled folding and binding is not prohibitively large. While an IDP does not favor a single-folded conformation in isolation, it may nevertheless contain hydrophobic residues (possibly specifically related to the ‘hot spots’ of binding) which in general have unfavorable hydration properties. When these hydrophobic side chains are folded into a core at the interface of a complex, their hydration water is released, with consequent increase in the entropy of the system. This influence of water and the hydration of IDPs can be seen in the behavior of some (but not all) IDPs in the presence of osmolytes. For example, addition of trimethylamine-N-oxide (TMAO) to a solution of the protein component of bacterial ribonuclease P, which folds upon binding to the RNA portion, resulted in folding of the protein even in the absence of its partner (Chang & Oas, Reference Chang and Oas2010).
7.1 Binding-induced folding versus conformational selection
How do the two partners of a coupled-folding-and-binding interaction make contact and form the complex? This problem has been formulated in terms of two limiting models, binding-induced folding, where interaction between the partners occurs as the first step, followed by folding on the surface of the partner, and conformational selection, where appropriately structured members of the ensemble of the IDP are selected to form the complex. In reality, most coupled folding and binding reactions will take place using elements of each of these mechanisms, and it has been suggested that the models have so much in common that they should be merged into a ‘synergistic model’ (Espinoza-Fonseca, Reference Espinoza-Fonseca2009a). Another treatment argued that an extended conformational selection model could be used to encompass both ‘conformational selection’ and any elements of ‘induced fit’ that might be necessary for the complex to form (Csermely et al. Reference Csermely, Palotai and Nussinov2010). The two limiting cases were distinguished by calculating the flux through each pathway (Hammes et al. Reference Hammes, Chang and Oas2009). This analysis showed that conformational change of flavodoxin upon binding of its cofactor flavin mononucleotide (FMN) was dominated by conformational selection at low ligand concentration and by binding-induced folding at high concentrations, with a significant range of conditions where both pathways were operative. Both models have also been invoked to explain the folding of various mutants of staphylococcal nuclease upon binding of substrate (Onitsuka et al. Reference Onitsuka, Kamikubo, Yamazaki and Kataoka2008). A system that shows more concrete evidence for conformational selection is the discrimination between various disordered inhibitors of protein phosphatase 1, where a comparison of ensemble models generated for three disordered peptide ligands with structures of the complexes implicated transient, preformed structure in the interaction (Marsh et al. Reference Marsh, Dancheck, Ragusa, Allaire, Forman-Kay and Peti2010).
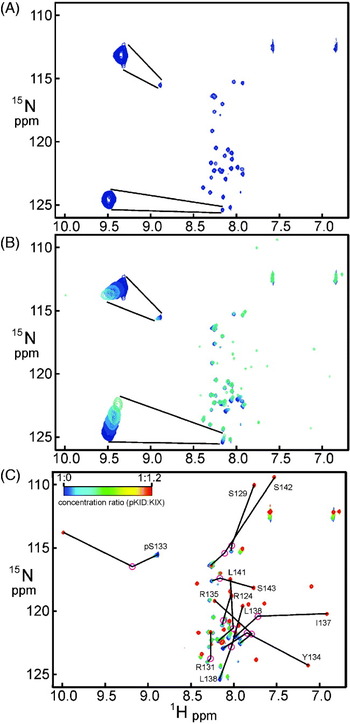
The most comprehensive study of the mechanism of a particular coupled folding and binding interaction was the analysis by NMR chemical shift perturbation and relaxation dispersion of the binding of pKID to KIX (Sugase et al. Reference Sugase, Dyson and Wright2007a). The binding of pKID to KIX is quite tight, with a K d of ~700 nM (Zor et al. Reference Zor, Mayr, Dyson, Montminy and Wright2002), and the exchange of pKID between free and bound states is slow on the NMR chemical shift timescale. Nevertheless, at molar ratios close to 1:1, additional effects are seen in the NMR spectrum, consistent with an additional process occurring on a fast-exchange timescale (Fig. 3) (Sugase et al. Reference Sugase, Dyson and Wright2007a). This was interpreted as evidence of an intermediate state that was populated during the binding process. Relaxation dispersion measurements were used to delineate the structure of this state; the results indicated that pKID binds initially to KIX in a series of encounter complexes that resolve initially into a partially folded intermediate state and then into the fully-folded complex, in a process that is largely identifiable as ‘binding followed by folding’ rather than the selection of a pre-formed conformer in the ‘conformational selection’ mechanism. Molecular dynamics simulations of this system (Huang and Liu, Reference Huang and Liu2010a, Reference Huang and Liub; Turjanski et al. Reference Turjanski, Gutkind, Best and Hummer2008) largely confirm the general outline of this mechanism. The role of non-native interactions during binding and folding was noted as a potentially important operative factor in the kinetics of the process (Huang & Liu, Reference Huang and Liu2010a).
7.2 Kinetic discrimination in antibody recognition
It has long been recognized that the antigen-binding sites of antibodies are relatively mobile (Tainer et al. Reference Tainer, Getzoff, Alexander, Houghten, Olson, Lerner and Hendrickson1984). A more recent body of work seeks to address the question ‘How can antibodies be both promiscuous and specific?’ (James et al. Reference James, Roversi and Tawfik2003). One example is a monoclonal IgE antibody raised to the hapten 2,4-dinitrophenol (DNP), which is sufficiently specific to discriminate between nitrophenol and DNP, but which can also bind protein ligands (James & Tawfik, Reference James and Tawfik2003). It appears that the antigen-binding site of this antibody is in a conformational equilibrium between structures that can bind DNP and undergo an induced-fit conformational change to form a long, narrow-binding pocket specific for the hapten, and wider, shallower pocket structures that can accommodate protein antigens (James & Tawfik, Reference James and Tawfik2005; James et al. Reference James, Roversi and Tawfik2003). Such multi-specificity may well be the explanation for the phenomena of auto-immunity and allergy, where antibodies raised against pathogenic antigens can also bind components of the organism itself or innocuous environmental molecules.
NMR 1H-15N HSQC spectra illustrating the fast- and slow-exchange processes occurring as the KIX domain of CBP is added to the intrinsically disordered pKID domain of CREB. (A) HSQC spectrum of pKID in the absence of KIX. Insets show enlarged versions of (top) the cross peak belonging to the phosphorylated Ser133 and (bottom) the cross peak of Leu138. (B) Superimposed HSQC spectra of pKID in the absence of KIX (blue) and in the presence of 1:0.1, 1:0.2, 1:0.3 and 1:0.4 mole ratios of KIX (colors progressing toward green). Insets show enlarged versions of the pSer133 and Leu138 cross peak sets. (C) Superimposed spectra for the complete titration. Corresponding assignments in the spectrum of the free and complexed pKID are linked by arrows. The pink circles represent cross peak positions calculated on the basis of the crosspeak movements illustrated in part B for the partly folded intermediate state (Sugase et al. Reference Sugase, Dyson and Wright2007a).

7.3 Thermostability and intrinsic disorder
Thermophilic organisms, those that prefer to live at temperatures above the normal physiological temperatures preferred by mesophilic organisms, contain proteins that are adapted in their structure and, particularly, in their dynamic properties, to higher temperatures (Petsko, Reference Petsko2001). Even in a mesophilic cell, that is, one that normally lives and grows at around room temperature, there nevertheless exist a repertoire of proteins that are resistant to higher temperatures, and this repertoire is enriched in disordered proteins (Galea et al. Reference Galea, High, Obenauer, Mishra, Park, Punta, Schlessinger, Ma, Rost, Slaughter and Kriwacki2006). A systematic study of proteins that are enriched after heat treatment of mouse fibroblast cells (Galea et al. Reference Galea, High, Obenauer, Mishra, Park, Punta, Schlessinger, Ma, Rost, Slaughter and Kriwacki2009) showed preponderance of soluble disordered proteins and of proteins with large segments that are predicted to be disordered. Even some sizable, fully-folded proteins were shown to be resistant to heat treatment (Galea et al. Reference Galea, High, Obenauer, Mishra, Park, Punta, Schlessinger, Ma, Rost, Slaughter and Kriwacki2009).
A contrasting result was shown in a survey of proteins from prokaryotic thermophilic organisms, which were found to employ fewer disordered regions in several protein types, compared to their analogues in mesophilic organisms (Burra et al. Reference Burra, Kalmar and Tompa2010). Transcription factors, for example, were shown to be less disordered in thermophiles, but proteins required for translation and ribosome biogenesis retained their disordered characteristics. The authors concluded that the lower incidence of disorder in thermophilic organisms was likely the result of functional simplification as a result of adaptation to extreme conditions.
7.4 Allostery and intrinsic disorder
Allostery is the term used to denote the transmission of regulatory information through conformational changes in proteins. It follows that this phenomenon is intimately connected with dynamics in proteins and with the observation of disordered segments in many important regulatory proteins; these ideas have recently been reviewed (Gibson, Reference Gibson2009; Hilser, Reference Hilser2010; Smock & Gierasch, Reference Smock and Gierasch2009; Tsai et al. Reference Tsai, Del and Nussinov2009a). Experimental results are now available for several systems. The cooperative response of the bacterial flagellar switch appears to be related to its stochastic multistate nature (Bai et al. Reference Bai, Branch, Nicolau, Pilizota, Steel, Maini and Berry2010). Another system where cooperativity arises in the presence of intrinsic disorder is the toxin–antitoxin repression operon in bacteriophage P1, where interactions between the disordered C-terminus of the antitoxin Phd and the toxin Doc mediate repression of transcription of the on (Garcia-Pino et al. Reference Garcia-Pino, Balasubramanian, Wyns, Gazit, De, Magnuson, Charlier, Van Nuland and Loris2010). Other toxin–antitoxin modules show variable levels of structural change upon binding (Drobnak et al. Reference Drobnak, Korencic, Loris, Marianovsky, Glaser, Jamnik, Vesnaver and Lah2009; Lah et al. Reference Lah, Simic, Vesnaver, Marianovsky, Glaser, Engelberg-Kulka and Loris2005).
7.5 Compensation for entropy changes in binding
One possible way that a disordered protein may compensate for the loss of entropy as it folds upon binding is to transfer the flexibility to another region of the complex. This mechanism was invoked to interpret NMR data observed for the AR domain of IκBα in the free state and in complex with its partner NF-κB (Sue et al. Reference Sue, Cervantes, Komives and Dyson2008), where a region of high mobility, resembling a molten globule state, was observed in the two C-terminal ARs in the free protein, but in the complex a different part of the molecule, the third AR, showed increased mobility (Sue et al. Reference Sue, Cervantes, Komives and Dyson2008). A similar redistribution of more dynamic regions of the protein upon binding was seen for the complex of the VTS1p-SAM domain with an RNA hairpin (Ravindranathan et al. Reference Ravindranathan, Oberstrass and Allain2010) and for the binding of stromelysin-1 to tissue inhibitor of metalloproteinases 1 (TIMP-1) (Arumugam et al. Reference Arumugam, Gao, Patton, Semenchenko, Brew and Van Doren2003).
8. Kinetic control of signaling by competition for binding sites
Although the coupled folding and binding of IDPs can (and must) be justified in thermodynamic terms, it is likely that much of the impetus for the occurrence of IDPs in nature is kinetic. Metabolic control involves the ability of a living system to change in response to stimuli. The fundamental chemical mechanism of response to environmental change appears to be competition of signaling factors for receptors, a kinetic phenomenon.
8.1 Binding of ligands to the KIX domain of CBP
The potential for competition between partners for binding sites on scarce transcriptional activator molecules is illustrated by the CBP system (shown in Fig. 1). CBP consists of a long single polypeptide chain that contains a number of variously-sized folding domains, including a histone acetyl transferase domain and a series of smaller folded interaction domains, including KIX (mentioned above in Section 7), and the TAZ domains. The KIX domain has two major binding sites for partners, one in the center of the molecule that accommodates ligands such as the pKID of CREB and the interaction domain of c-Myb (Zor et al. Reference Zor, Mayr, Dyson, Montminy and Wright2002), and the other at one end of the molecule that binds the activation domain of the mixed-lineage leukemia (MLL) protein (Goto et al. Reference Goto, Zor, Martinez-Yamout, Dyson and Wright2002). Interestingly, the two sites are allosterically coupled, resulting in tighter binding for ligands in ternary complexes than in the corresponding binary complexes (De Guzman et al. Reference De Guzman, Goto, Dyson and Wright2006; Goto et al. Reference Goto, Zor, Martinez-Yamout, Dyson and Wright2002). The KIX domain also interacts with the tumor suppressor p53 (Lee et al. Reference Lee, Arai, Martinez-Yamout, Dyson and Wright2009). The FOXO3a transcription factor provides a variation on the competition for binding to the KIX domain (Wang et al. Reference Wang, Marshall, Li, Yamamoto, Mak and Ikura2009). This protein consists of a well-folded forkhead (FH) domain that interacts with DNA, and a disordered domain containing three conserved regions (CR1, CR2 and CR3). The CR3 sequence interacts both with the KIX domain of CBP and intramolecularly with the FH domain. In the absence of DNA, the interaction of CR3 with FH prevents its interaction with KIX, but when FH binds DNA, the CR3–KIX interaction can occur, thus recruiting the CBP and its histone acetyltransferase activity to the transcriptional machinery at the transcription site.
8.2 Binding of ligands to the TAZ domains of CBP
The TAZ domains exhibit a different form of multiple-ligand binding. There are two TAZ domains in CBP, termed TAZ1 and TAZ2 (De Guzman et al. Reference De Guzman, Martinez-Yamout, Dyson, Wright, Iuchi and Kuldell2004b). Both domains are predominantly helical, with three structural zinc binding sites. The 3D structures of these domains show significant differences, and there is a corresponding difference in their ligand affinity. For example, both TAZ1 and TAZ2 bind the N-TAD of p53. Binding occurs in two separate sites on each of the TAZ domains, but with significantly different affinities (Ferreon et al. Reference Ferreon, Lee, Arai, Martinez-Yamout, Dyson and Wright2009b), and the affinities for the two domains are changed in different ways when p53 is phosphorylated (Ferreon et al. Reference Ferreon, Lee, Arai, Martinez-Yamout, Dyson and Wright2009b; Lee et al. Reference Lee, Ferreon, Ferreon, Arai and Wright2010a). The interaction of CBP with p53 provides an excellent example of the synergy of thermodynamic and kinetic factors in determining the response of transcriptional systems to signals. In unstressed cells, the N-TAD is unphosphorylated, and binds to the ubiquitin ligase human double minute protein 2 (HDM2) as well as to the CBP domains TAZ1, TAZ2, KIX and NCBD (Ferreon et al. Reference Ferreon, Lee, Arai, Martinez-Yamout, Dyson and Wright2009b). As a consequence, p53 is polyubiquitinated and degraded. Upon phosphorylation of p53 as a result of genotoxic stress, the affinity of HDM2 is significantly reduced, and the HDM2-binding segment of p53 N-TAD becomes bound exclusively to the CBP domains. p53 is no longer ubiquitinated, but instead is acetylated and activated for the transcription of stress-related genes (Ferreon et al. Reference Ferreon, Lee, Arai, Martinez-Yamout, Dyson and Wright2009b) (Fig. 2b).
The p53 system provides an example of the competition of folded domains (HDM2, the TAZ and KIX domains) for an IDP ligand. The TAZ domains also illustrate the competition between numerous IDP ligands for a folded domain. Complexes between TAZ1 and the activation domains of a number of ligands have been solved, mainly in solution by NMR methods. The TAZ1 structures include the free domain (De Guzman et al. Reference De Guzman, Wojciak, Martinez-Yamout, Dyson and Wright2005), complexes with the activation domains of the transcription factor Hif-1α (Dames et al. Reference Dames, Martinez-Yamout, De Guzman, Dyson and Wright2002; Freedman et al. Reference Freedman, Sun, Poy, Kung, Livingston, Wagner and Eck2002), the transcriptional repressor CITED2 (De Guzman et al. Reference De Guzman, Martinez-Yamout, Dyson and Wright2004; Freedman et al. Reference Freedman, Sun, Kung, France, Wagner and Eck2003) and the signal transducer and activator protein STAT2 (Wojciak et al. Reference Wojciak, Martinez-Yamout, Dyson and Wright2009). These activation domains all bind in overlapping regions of the central part of the TAZ1 domain. However, the binding sites are by no means identical, and the sense of the binding (N to C-terminal) of the ligands are in some cases completely different. This point is illustrated in Fig. 4. The interaction between the N-TAD of Hif-1α and TAZ1 (Fig. 4, red ribbon) bears some resemblance to the binding of the N-terminus of CITED2 (Fig. 4, blue ribbon). However, their C-termini are bound quite differently, with Hif-1α wound around in a short helical structure onto the opposite side of the TAZ1 domain, while the CITED2 C-terminus remains unstructured on the same face. The structure of the TAZ1–STAT2 complex (Fig. 4, green ribbon) provides a further significant structural variation: the N- and C-termini of STAT2 are swapped with respect to the Hif-1α and CITED2 complexes. The differences between the interactions of these competing domains suggests a possible mechanism for the replacement of one domain by another: a competing domain could conceivably bind even in the presence of an already-bound domain, in one of the sites that the bound domain does not occupy, and then proceed to peel off and replace the bound domain by a process of local mass action.
Comparison of the structures of ligands bound to the CBP TAZ1 domain. The surface of TAZ1 (almost identical in all three complexes) is shown in gray, with the backbone of STAT2-TAD (Wojciak et al. Reference Wojciak, Martinez-Yamout, Dyson and Wright2009) in green, the HIF-1α-CTAD (Dames et al. Reference Dames, Martinez-Yamout, De Guzman, Dyson and Wright2002) in red and the CITED2-TAD (De Guzman et al. Reference De Guzman, Martinez-Yamout, Dyson and Wright2004a) in blue. The left and right images represent a 180° rotation around the vertical axis in the plane of the page. The N- and C-termini of each ligand are labeled: note that STAT2 binds in the opposite sense to the other two ligands (adapted from Wojciak et al. Reference Wojciak, Martinez-Yamout, Dyson and Wright2009).

8.3 Action of disordered domains of viral proteins
Viruses frequently utilize IDPs to subvert the control of infected cells (Davey et al. Reference Davey, Travé and Gibson2011). Competition for scarce resources such as CBP/p300 in the cell appears to be a major strategy used by viruses. The adenovirus early region 1A (E1A) protein utilizes its disordered domains to hijack the transcriptional machinery of the cell. The E1A protein interacts with the TAZ2 domain of CBP, forming a complex similar to those described in the previous paragraph for TAZ1 (Ferreon et al. Reference Ferreon, Martinez-Yamout, Dyson and Wright2009c). An N-terminal CR of E1A mediates the interaction, forming short helical segments in complex with TAZ2 (Ferreon et al. Reference Ferreon, Martinez-Yamout, Dyson and Wright2009c). E1A competes successfully with p53 for binding to TAZ2, disrupting transcriptional control by p53. Interestingly, E1A also mediates formation of a ternary complex with the retinoblastoma protein pRb and TAZ2, suggesting a mechanism for one of the physiological consequences of adenovirus infection, inhibition of phosphorylation of pRb and promotion of MDM2 binding. These events affect cell differentiation and promote permanent exit from the cell cycle (Nguyen et al. Reference Nguyen, Baglia, Huang, Baker and Mccance2004). One of the absolute requirements for ternary complex formation is the presence of a long disordered sequence between the TAZ2 binding site at CR1 and the LXCXE sequence that binds to the B domain of pRb (Fig. 5).
Structural model of the ternary complex between the retinoblastoma protein pRb, the TAZ2 domain of CBP and the adenoviral E1A protein. The model was generated using the crystal structure of the complex of pRb with E1A (CR1, residues 37–49) (PDB entry 2R7G) (Liu & Marmorstein, Reference Liu and Marmorstein2007), the NMR structure of the complex between the TAZ2 domain of CBP and residues 53–91 of E1A (PDB entry 2KJE) (Ferreon et al. Reference Ferreon, Martinez-Yamout, Dyson and Wright2009c) and the crystal structure of the HPV E7 peptide (DLYCYEQLN, homologous to CR2 residues 121–129 of E1A) containing the LXCXE motif that interacts with pRb (PDB entry 1GUX) (Lee et al. Reference Lee, Russo and Pavletich1998). The flexible linker between residues 83 and 120 of E1A is indicated schematically as a dotted line. The backbone structures of pRb, E1A and TAZ2 are represented as ribbons colored gray, coral and blue, respectively (adapted from Ferreon et al. Reference Ferreon, Martinez-Yamout, Dyson and Wright2009c).

8.4 Kinetic control in signal transduction
Kinetic control is also key to the understanding of other signal transduction pathways. Inhibition of NF-κB signaling by the inhibitor IκBα involves signaling-related phosphorylation and degradation of IκBα in a process that incorporates interactions between folded, unfolded and partly folded domains of both proteins (described in more detail in Section 10). Another aspect of this system that has hitherto received less attention is the IκBα-mediated stripping of NF-κB from DNA following the transcriptional event. It was known that IκBα genes were frequently transcribed downstream of NF-κB-regulated genes. It has now been shown that the newly synthesized IκBα participates actively in the acceleration of NF-κB removal from the DNA (Bergqvist et al. Reference Bergqvist, Alverdi, Mengel, Hoffmann, Ghosh and Komives2009). The observation that a ternary complex was formed between NF-κB, IκBα and DNA in solution by NMR and stopped flow fluorescence (Sue et al. Reference Sue, Alverdi, Komives and Dyson2011) gives important insights into the possible molecular mechanism of the removal of NF-κB from DNA.
8.5 Mutual synergistic folding and kinetic control
As mentioned in Section 6, the term mutual synergistic folding was coined to describe the process whereby a folded complex could be formed when both components were disordered. The complex between the NCBD domain of CBP and the interaction domain of the nuclear receptor coactivator p160 (Demarest et al. Reference Demarest, Martinez-Yamout, Chung, Chen, Xu, Dyson, Evans and Wright2002) represents one example of this class of complex. Free NCBD domain contains some helical structure, although it is not cooperatively folded (Demarest et al. Reference Demarest, Martinez-Yamout, Chung, Chen, Xu, Dyson, Evans and Wright2002). Consistent with its identity as an incompletely folded domain, complexes formed between NCBD and other interaction partners show considerable structural diversity, as illustrated in Fig. 6. The partners of NCBD in several complexes provide another illustration of the structural diversity accessible as a result of disorder (Fig. 7).
Structural comparison of the NCBD domain of CBP in complex with (left) the ACTR domain of p160 (PDB entry 1KBH) (Demarest et al. Reference Demarest, Martinez-Yamout, Chung, Chen, Xu, Dyson, Evans and Wright2002) and (right) IRF3 (PDB entry 1Z0Q) (Qin et al. Reference Qin, Liu, Srinath, Lam, Correia, Derynck and Lin2005). Adapted from Wright & Dyson (Reference Wright and Dyson2009). Note that free ACTR is intrinsically disordered, whereas IRF3 is a globular protein in the free state.

(A) Superposition of p53 TAD structures in various complexes, with the NCBD domain of CBP (green) (PDB entry 2L14) (Lee et al. Reference Lee, Martinez-Yamout, Dyson and Wright2010b), with MDM2 (magenta) (PDB entry 1YCQ) (Kussie et al. Reference Kussie, Gorina, Marechal, Elenbaas, Moreau, Levine and Pavletich1996), with RPA (red) (PDB entry 2B29) (Bochkareva et al. Reference Bochkareva, Kaustov, Ayed, Yi, Lu, Pineda-Lucena, Liao, Okorokov, Milner, Arrowsmith and Bochkarev2005) and with TFIIH (blue) (PDB entry 2GS0) (Di Lello et al. Reference Di Lello, Jenkins, Jones, Nguyen, Hara, Yamaguchi, Dikeakos, Appella, Legault and Omichinski2006). The corresponding residues for each complex are aligned on the backbone of heavy atoms of the two well-defined helices, α1 and α2 of the NCBD complex. (B) Superposition of NCBD structures in various complexes, with the p53 TAD (blue) (PDB entry 2L14) (Lee et al. Reference Lee, Martinez-Yamout, Dyson and Wright2010b), with ACTR (PDB entry 1KBH) (Demarest et al. Reference Demarest, Martinez-Yamout, Chung, Chen, Xu, Dyson, Evans and Wright2002) and with SRC1 (PDB entry 2C52) (Waters et al. Reference Waters, Yue, Veverka, Renshaw, Bramham, Matsuda, Frenkiel, Kelly, Muskett, Carr and Heery2006).

8.6 Control of the cell cycle by IDPs
The cell cycle consists of a series of folded proteins, the cyclins and cyclin-dependent kinases that are regulated in almost all respects by small domains or proteins that are largely if not completely disordered. One of the most important of these regulatory proteins is p53, which is implicated in a very high proportion of mutations leading to cancer. Other examples include the cyclin-dependent kinase inhibitors p21, which was one of the first proteins to be designated ‘intrinsically disordered’ (Kriwacki et al. Reference Kriwacki, Hengst, Tennant, Reed and Wright1996), p27Kip1 and p14Arf.
The inhibitor p27Kip1 mediates the formation of ternary complexes, with Cdk2 and cyclin A, which are significantly more thermally stable than any of the corresponding binary complexes, thus appearing to act as a ‘thermodynamic tether’ (Bowman et al. Reference Bowman, Galea, Lacy and Kriwacki2006). Phosphorylation of a tyrosine residue in the Cdk-binding region of p27 has been directly implicated in oncogenic transformation, as it changes the structure of the ternary complex, allowing partial activity of the Cdk and resulting progression of the cell cycle (Grimmler et al. Reference Grimmler, Wang, Mund, Cilensek, Keidel, Waddell, Jakel, Kullmann, Kriwacki and Hengst2007).
The inhibitor p14Arf interferes with p53 control by binding to HDM2 and preventing the normal degradation of p53 (Bothner et al. Reference Bothner, Lewis, Digiammarino, Weber, Bothner and Kriwacki2001). The interaction between Arf and HDM2 appears to be heterogeneous, with the formation of oligomers and amyloid-like fibrils (Bothner et al. Reference Bothner, Aubin and Kriwacki2003; Sivakolundu et al. Reference Sivakolundu, Nourse, Moshiach, Bothner, Ashley, Satumba, Lahti and Kriwacki2008). Structural characterization of this system was achieved through studying the interaction of a 9-residue peptide to represent the interaction domain of Arf and the Arf-interacting domain of HDM2, which form bimolecular oligomers that were characterized by CD spectroscopy, sedimentation velocity measurements and NMR (Sivakolundu et al. Reference Sivakolundu, Nourse, Moshiach, Bothner, Ashley, Satumba, Lahti and Kriwacki2008). These complexes distinctively showed the signature of β-strand formation (Bothner et al. Reference Bothner, Lewis, Digiammarino, Weber, Bothner and Kriwacki2001, Reference Bothner, Aubin and Kriwacki2003; Sivakolundu et al. Reference Sivakolundu, Nourse, Moshiach, Bothner, Ashley, Satumba, Lahti and Kriwacki2008), unlike many of the other complexes so far studied, where the IDP components tend to form helices or loops, or may have heterogeneous ‘fuzzy’ characteristics.
9. Role of post-translational modification
As mentioned in Sections 3 and 4, one of the more obvious attributes of IDPs, particularly in cellular signaling systems, is that they are frequently the site of post-translational modifications. This makes sense if the primary sites of binding to partners are the small sequence motifs termed MoRFs: modification of a critical interacting residue might well serve to abrogate an interaction, for example. The occurrence of many different types of post-translational modification, sometimes at the same sites or in competing sites, argues that the picture is more complex than this simple analysis. This section will introduce a few examples of post-translational modifications on IDPs that are known to introduce specific physiological effects.
9.1 Direct relationship between chemistry and function: Hif-1α and TAZ1
TAZ1 is known to bind to a large number of proteins, through interaction domains that are frequently disordered in the free state. One of the most interesting interactions from the point of view of the direct relationship between chemistry and function is that between the TAZ1 domain and the hypoxia-inducible factor Hif-1α (Lando et al. Reference Lando, Peet, Whelan, Gorman and Whitelaw2002). Under normal conditions of oxygen concentration, the Hif-1α protein is hydroxylated at two positions, Pro564 and Asn803 (Fig. 8). Hydroxylation at Pro564 promotes binding of the Von Hippel–Lindau (VHL) ubiquitin ligase that results in the degradation of the protein. Hydroxylation at Asn803 provides a second tier of control by inhibiting the recruitment of CBP/p300 and hence halting potential transcriptional activation. Under conditions of low oxygen concentration (hypoxia), these two sites are no longer hydroxylated. Ubiquitin-dependent degradation of Hif-1α no longer occurs, and the protein dimerizes with the constitutive hypoxia factor ARNT and is translocated to the nucleus. There the heterodimer binds to CBP, with an interaction between the C-terminal disordered region of Hif-1α and the TAZ1 domain of CBP, to promote transcription of oxygen stress genes. This process is an important target for anti-tumor drugs, since the inhibition of hypoxia-inducible genes should prevent the formation of new vasculature around tumors, disallowing uncontrolled growth (Takenaga, Reference Takenaga2011). The structural basis for the interaction between TAZ1 and Hif-1α was reported by two groups (Dames et al. Reference Dames, Martinez-Yamout, De Guzman, Dyson and Wright2002; Freedman et al. Reference Freedman, Sun, Poy, Kung, Livingston, Wagner and Eck2002). The intrinsically disordered C-terminal sequence of Hif-1α binds to the folded TAZ1 domain through the formation of three short helical segments that are located in grooves on opposing faces of the TAZ1 surface and connected with loops. The regulatory Asn803 is located on the C-terminus of the second helical segment (Fig. 8), where it makes hydrogen-bonding contacts with the Hif-1α Asp799 carbonyl and the TAZ1 Asp346 backbone NH. The entire side chain is deeply buried in the interface between the two proteins, and is packed against hydrophobic side chains of TAZ1. The addition of a hydroxyl group to the Asn side chain would presumably cause disruption of this hydrophobic interaction, resulting in a lowered affinity of (hydroxylated) Hif-1α for TAZ1. (Interestingly, the affinity of hydroxylated Hif-1α for TAZ1, though greatly reduced from that of the unhydroxylated form, is still quite substantial. Attempts to replicate the relaxation dispersion experiments of Sugase et al. (Reference Sugase, Dyson and Wright2007a) with TAZ1 and Hif-1a were unsuccessful, as the affinity is simply too great for the fast-exchange interaction to be observable. However, the hydroxylated form of Hif-1α was amenable to this technique (Sugase et al. Reference Sugase, Lansing, Dyson and Wright2007b), with the proviso that much lower concentrations had to be used, since the affinity of TAZ1 even for hydroxylated Hif was substantially greater than that of pKID for KIX).
(A) Schematic diagram showing the regulation of the HIF-1α transcription factor under normal oxygenation conditions (bottom), where proline hydroxylation in the central ODD domain recruits the Von Hippel–Lindau factor, leading to degradation, and asparagine hydroxylation in the C-terminal activation domain lowers the affinity for transcriptional activators. In hypoxic conditions (top), neither the prolines nor the asparagine are hydroxylated, with the result that HIF-1α is stabilized and binds to CBP/p300 to promote transcription of hypoxia-response genes. Adapted from Hirota & Semenza (Reference Hirota and Semenza2005). (B) Backbone structure of one member of the family of NMR structures of the complex of HIF-1α CTAD with the TAZ1 domain of CBP (PDB entry 1L8C) (Dames et al. Reference Dames, Martinez-Yamout, De Guzman, Dyson and Wright2002). The HIF-1α hydroxylation site on at Asn803 on αB is indicated.

9.2 Phosphorylation of IDPs and IDRs
Covalent addition of a phosphate group to the side chain hydroxyl groups of serine, threonine or tyrosine is one of the most important regulatory mechanisms in eukaryotic cells. Phosphorylation adds a relatively large negatively charged group, which may contribute to the enthalpy of binding of a ligand and hence enhance binding, or alternatively to the disruption of an otherwise hydrophobic binding pocket and the consequent dissociation of the complex. Numerous experimental studies of IDPs include phosphorylated forms, and examples are given below. The effects of phosphorylation are amenable to computational study (Narayanan & Jacobson, Reference Narayanan and Jacobson2009), and bioinformatic studies have also pinpointed a connection between the location of phosphorylation sites and the probability that the surrounding sequences would be disordered, utilizing this observation as a basis for the prediction of phosphorylation sites (Iakoucheva et al. Reference Iakoucheva, Radivojac, Brown, O'Connor, Sikes, Obradovic and Dunker2004).
The level of phosphorylation of p53 is a critical determinant of the gatekeeper function of p53 in the cell. Under normal conditions, p53 is unphosphorylated and degraded through its interaction with the E3 ubiquitin ligase HDM2. Genotoxic stress causes phosphorylation of p53, and a greater level of stress results in a greater level of multisite phosphorylation, primarily in the intrinsically disordered N-TAD (Lee et al. Reference Lee, Ferreon, Ferreon, Arai and Wright2010a). This behavior was interpreted as a graded response: since p53 must compete with other ligands for binding to the transcriptional activator CBP, the addition of multiple phosphorylations raises the affinity of the p53 for its binding sites on CBP (the TAZ1, KIX, TAZ2 and NCBD domains). A greater efficiency of binding to CBP with increased numbers of phosphorylated sites provides a molecular rationale for the increase in the p53 response following prolonged or severe genotoxic stress (Lee et al. Reference Lee, Ferreon, Ferreon, Arai and Wright2010a). A graded response was also invoked in the analysis of the ‘ultrasensitive’ response of the cyclin-dependent kinase inhibitor Sic1 of yeast (Borg et al. Reference Borg, Mittag, Pawson, Tyers, Forman-Kay and Chan2007). Above a threshold level of phosphorylation, the dissociation and subsequent elimination of the inhibitor may simply be driven by cumulative electrostatic interactions (Borg et al. Reference Borg, Mittag, Pawson, Tyers, Forman-Kay and Chan2007). Another example of control by multiple phosphorylation is in the remodeling of chromatin by FACT, where it is thought that phosphorylation of an acidic disordered region on one of the domains provides sufficient electrostatic repulsion to enable dissociation of the protein from DNA (Tsunaka et al. Reference Tsunaka, Toga, Yamaguchi, Tate, Hirose and Morikawa2009).
Although it has been suggested on the basis of molecular dynamics calculations that phosphorylation may cause an increase in the propensity for helix formation in free IDPs (Solt et al. Reference Solt, Magyar, Simon, Tompa and Fuxreiter2006), there has been little support for this notion from most experimental studies. No difference in the conformational preference for helix was observed upon phosphorylation of a peptide representing the kinase-inducible domain (KID) of CREB (Radhakrishnan et al. Reference Radhakrishnan, Perez-Alvarado, Dyson and Wright1998), and a comprehensive thermodynamic analysis of the binding of the KIX domain of CBP to pKID on the one hand, and unphosphorylated KID and c-Myb on the other hand, showed that the difference between the binding was primarily in the large negative enthalpy generated in the complex with pKID (Parker et al. Reference Parker, Rivera, Zor, Henrion-Caude, Radhakrishnan, Kumar, Shapiro, Wright, Montminy and Brindle1999; Zor et al. Reference Zor, Mayr, Dyson, Montminy and Wright2002). Phosphorylation of the N-terminal disordered region of human c-Src kinase also showed no change in the conformational ensemble of the free protein (Perez et al. Reference Perez, Gairi, Pons and Bernado2009) and it was suggested that the primary role for phosphorylation of this region is to create a global electrostatic perturbation in the kinase that prompts its dissociation from the cell membrane.
Local interaction with membrane-spanning segments was also invoked to explain the effects of phosphorylation in the CFTR (Kanelis et al. Reference Kanelis, Hudson, Thibodeau, Thomas and Forman-Kay2010). Phosphorylation of a disordered regulatory region attached to the first nucleotide-binding domain (NBD1) changes the conformational propensities in this region (Baker et al. Reference Baker, Hudson, Kanelis, Choy, Thibodeau, Thomas and Forman-Kay2007) and modulates the transient interactions of this region with the NBD1 core, likely mediating gating for the chloride channel across the membrane (Kanelis et al. Reference Kanelis, Hudson, Thibodeau, Thomas and Forman-Kay2010). Deletion of Phe508 of the NBD1, the most common mutation that results in the disease cystic fibrosis, gives a protein where the interactions between the core and the regulatory region are not as effectively disrupted, providing a possible structural basis for the observed inefficiency of chloride transport when the ΔPhe508 mutation is present (Kanelis et al. Reference Kanelis, Hudson, Thibodeau, Thomas and Forman-Kay2010). Other groups have suggested that the disease primarily arises due to incomplete folding and degradation of the ΔPhe508 mutant protein in the endoplasmic reticulum (see Wang et al. Reference Wang, Koulov, Kellner, Riordan and Balch2008 and references therein). Nevertheless, a recent structural comparison of the wild-type and mutant proteins shows distinct changes in local structure and dynamics of the folded proteins that could also be invoked to explain the effects of the mutation in the disease state (Lewis et al. Reference Lewis, Wang, Zhao, Hamuro, Conners, Kearins, Lu, Sauder, Molnar, Coales, Maloney, Guggino, Wetmore, Weber and Hunt2010).
Conformational changes upon phosphorylation have been documented in some systems. For example, a conformational change mediated by phosphorylation was observed using time-resolved fluorescence resonance energy transfer (FRET) of the phosphorylation domain of smooth muscle myosin (Kast et al. Reference Kast, Espinoza-Fonseca, Yi and Thomas2010). Specific conformational changes were also invoked to explain NMR observations showing that pseudo-phosphorylation (replacement of serine phosphorylation sites by glutamate) of the Alzheimer's disease-associated protein tau results in attenuation of binding to microtubules, mimicking the hyperphosphorylation effects observed in the brains of patients with Alzheimer's disease (Fischer et al. Reference Fischer, Mukrasch, Biernat, Bibow, Blackledge, Griesinger, Mandelkow and Zweckstetter2009). Phosphorylation of specific sites on tau by glycogen synthase kinase (GSK)3β causes structural changes that lead to interactions with apolipoprotein E, an interaction that does not occur in unphosphorylated tau or when tau has been phosphorylated by the cyclic-AMP dependent protein kinase A (PKA). This discrimination has important implications for the occurrence and onset of disease (Leroy et al. Reference Leroy, Landrieu, Huvent, Legrand, Codeville, Wieruszeski and Lippens2010). Pseudo-phosphorylation of mutant proteins was also used to show a conformational change in the tumor suppressor and cyclin-dependent kinase inhibitor p19INK4d, which enabled the ubiquitination and degradation of the p19 protein (Löw et al. Reference Löw, Homeyer, Weininger, Sticht and Balbach2009).
9.3 Ubiquitination and neddylation
As well as its well-characterized role in targeting proteins for degradation, the reversible covalent addition of ubiquitin (and similar protein tags such as the small ubiquitin-like modifier (SUMO) and the cullin ring ligase regulator NEDD8) is also implicated in many other functions in the cell. Known ubiquitination sites frequently map to intrinsically disordered segments of target molecules (Edwards et al. Reference Edwards, Lobley, Pentony and Jones2009; Radivojac et al. Reference Radivojac, Vacic, Haynes, Cocklin, Mohan, Heyen, Goebl and Iakoucheva2010) and this observation was used to formulate a sequence predictor program for ubiquitination sites (Radivojac et al. Reference Radivojac, Vacic, Haynes, Cocklin, Mohan, Heyen, Goebl and Iakoucheva2010). Structural plasticity and conformational dynamics were also observed for ubiquitin-interacting motifs, which serve to recognize ubiquitin-labeled target molecules (Sgourakis et al. Reference Sgourakis, Patel, Garcia, Makhatadze and Mccallum2010).
An extensive series of molecular dynamics simulations on the cullin-RING-E3 ligase system suggests a model where a disordered linker domain mediates correct interaction and positioning of the various domain components for efficient transfer of ubiquitin to substrates (Liu and Nussinov, Reference Liu and Nussinov2009, Reference Liu and Nussinov2010a). Further calculations also provided a rationale for the role of the NEDD8 attachment in priming the system for ubiquitin ligation (Liu & Nussinov, Reference Liu and Nussinov2010b). These studies suggest interesting hypotheses for exploration with carefully designed experiments.
9.4 Ubiquitin-independent protein degradation
While the occurrence of disordered segments appears to be important in the ubiquitin-dependent proteasomal degradation of proteins, it has recently been observed that proteins that are intrinsically disordered or even mildly destabilized can be rapidly degraded by ubiquitin-independent mechanism (Jariel-Encontre et al. Reference Jariel-Encontre, Bossis and Piechaczyk2008). The ubiquitin pathway uses the 26S proteasome (with body and cap segments), and the ubiquitin-independent process utilizes the 20S proteasome (body segment only). Examples of disordered and unstable proteins that are degraded in ubiquitin-independent manner include p53 (Tsvetkov et al. Reference Tsvetkov, Reuven, Prives and Shaul2009a) and IκBα (Mathes et al. Reference Mathes, Wang, Komives and Ghosh2010).
9.5 IDPs and metal ion binding
The role of metal ions in stabilizing the folded states of small proteins is well-established, for example, zinc finger proteins have an absolute requirement for the presence of zinc ions, otherwise they are not folded or functional (Lee et al. Reference Lee, Gippert, Soman, Case and Wright1989; Parraga et al. Reference Parraga, Horvath, Eisen, Taylor, Hood, Young and Klevit1988). Reversible binding of metal ions, where both the metal-free disordered form and the metal-bound ordered form are functional, occur for at least one zinc-containing protein, the redox-dependent chaperone Hsp33 (Graf et al. Reference Graf, Martinez-Yamout, Vanhaerents, Lilie, Dyson and Jakob2004; Won et al. Reference Won, Low, Guzman, Martinez-Yamout, Jakob and Dyson2004), but is much more widely observed among calcium-binding proteins. Examples include the RTX motif of the Type 1 secretion system of Gram-negative bacteria (Chenal et al. Reference Chenal, Guijarro, Raynal, Delepierre and Ladant2009; Sotomayor Perez et al. Reference Sotomayor Perez, Karst, Davi, Guijarro, Ladant and Chenal2010) and the structural coupling between N- and C-terminal lobes in calmodulin (Chen et al. Reference Chen, Lowry, Mayer and Squier2008). Since calcium signaling is such an important process in many metabolic systems, it is likely that this kind of reversible order–disorder equilibrium will be found to be quite common in the future.
10. Partly folded and molten globule-like states
Expanding the proteome to include intrinsically disordered states is only part of the story. Biophysical data on disordered proteins may be difficult to interpret, but are generally available from a variety of sources. Data on partly folded states, however, are much harder to obtain, and remain extremely difficult to interpret. Nevertheless, a number of groups have recently attempted to define partly folded or molten globular states using a number of different biophysical techniques.
It was clear in early folding studies that in addition to the ‘unfolded’ and ‘folded’ states of a protein, other intermediate states could exist along the folding pathway. The ‘molten globule’ state, originally proposed as a specific intermediate with a native-like fold but without native tertiary structure (Ohgushi & Wada, Reference Ohgushi and Wada1983; Ptitsyn, Reference Ptitsyn1973) provides a model for the intermediate state, although it is now recognized that such intermediates actually consist of a number of conformational states in equilibrium. Indeed, molten globule states are particularly difficult to study by NMR, as the exchange between the conformational states is frequently on an intermediate time scale compared to the chemical shift time scale, resulting in extensive broadening and disappearance of resonances. Methods of addressing these difficulties have recently been introduced (Hsu et al. Reference Hsu, Bertoncini and Dobson2009; Li & Palmer, Reference Li and Palmer2010) but the structural characterization of these systems at a molecular level remains extremely challenging. Since molten globule-like domains are so difficult to characterize structurally by standard methods such as X-ray crystallography and NMR, other techniques such as fluorescence and CD spectroscopy, small-angle X-ray scattering and H/D exchange have been employed to give structural insights. In particular, the fluorescence of the dye 1-anilino-8-naphthalenesulfonic acid (ANS) changes in the presence of molten globule states, and has been extensively used as a signal of the presence of such a state (Cattoni et al. Reference Cattoni, Kaufman and Gonzalez Flecha2009).
An addition was made to the ‘protein trinity’ concept (folded, unfolded and molten globule) (Dunker & Obradovic, Reference Dunker and Obradovic2001; Romero et al. Reference Romero, Obradovic and Dunker2004) to include a fourth member, the pre-molten globule (Uversky and Ptitsyn, Reference Uversky and Ptitsyn1994, Reference Uversky and Ptitsyn1996), giving rise to the ‘protein quartet’ terminology (Uversky, Reference Uversky2002). A pre-molten globule is defined as a subset of unfolded proteins where there is a significant population of residual secondary structure in the free state (Uversky, Reference Uversky2002). Other terminology has been coined for complexes without fixed structures, such as ‘cloud’ or ‘fuzzy’ complexes (see Section 4) (Uversky, Reference Uversky2010).
10.1 AR proteins
AR proteins contain multiples of a short structured motif consisting of 33 amino acids arranged in a β-turn/loop-helix-loop-helix fold (Fig. 9). Multiples of between 3 and 24 repeats have been observed in over 3500 proteins, and the AR appears to function primarily as a protein recognition motif. The amino acid sequences of the repeats are homologous, but not identical, with the strongest homology in a consensus PLHLA sequence at the N-terminal end of the first short helix. AR proteins appear to have a wide repertoire of possible structured and partly structured forms. For example, the notch AR domain appears to be stably folded, although other parts of the notch protein are unstructured (Bertagna et al. Reference Bertagna, Toptygin, Brand and Barrick2008). As previously mentioned, the p19INK4d tumor suppressor undergoes a phosphorylation induced conformational change to an open position that may be coupled to ubiquitination (Barrick, Reference Barrick2009; Löw et al. Reference Löw, Homeyer, Weininger, Sticht and Balbach2009). By contrast, the AR domain of IκBα shows significant variation in the stability between its six ARs, and the presence of a partly folded region near the C-terminus of the free protein (Croy et al. Reference Croy, Bergqvist, Huxford, Ghosh and Komives2004; Sue et al. Reference Sue, Cervantes, Komives and Dyson2008) appears to be required for some of its functions. In particular, mutation of the sequence of AR5 and AR6 to conform to the consensus sequence causes the partly folded region to become more stably folded (Ferreiro et al. Reference Ferreiro, Cervantes, Truhlar, Cho, Wolynes and Komives2007) but renders the IκBα less capable of stripping the NF-κB from DNA (Bergqvist et al. Reference Bergqvist, Alverdi, Mengel, Hoffmann, Ghosh and Komives2009).
(A) Single AR module from the Notch AR domain showing secondary structure elements. (B) Backbone structure of the Notch AR domain (PDB entry 1YYH) (Ehebauer et al. Reference Ehebauer, Chirgadze, Hayward, Martinez and Blundell2005), showing close connections between repeat subunits.

10.2 Characterization of binding-induced molten globule-like state
It is perhaps intuitively satisfying (and analogous to the coupled folding and binding of completely unfolded IDPs) that a less-folded state present in a free protein should be more stably folded in complex with its partner, as in the case of IκBα. A different case has recently been characterized, where binding of the partner appears to induce the formation of a molten globule-like state in a protein that is well folded in isolation. The p53 DNA binding domain interacts with the chaperone Hsp90. NMR, fluorescence and H/D exchange experiments all point to the formation of a loosened and flexible state of the p53 DBD in the presence of Hsp90 (Park et al. Reference Park, Borin, Martinez-Yamout and Dyson2011). This observation has profound implications for the role of Hsp90 in many of its known cellular functions: if Hsp90 induces a similar loosened state in other client proteins, it would help explain the part that Hsp90 plays in the stabilization of the ligand-binding domains of nuclear hormone receptors in the absence of their hormone ligands (Pratt & Toft, Reference Pratt and Toft1997).
10.3 Coiled coil and leucine zipper proteins
Helical bundle structures would appear at first sight to be poor candidates for functions requiring flexibility. However, a number of examples have recently been reported where coiled-coil and leucine zipper structures show structural flexibility that enables them to bind many different partners (Miller, Reference Miller2009). Examples include the coupled folding and binding reaction of c-Myc upon heterodimerization with its partner Max (Follis et al. Reference Follis, Hammoudeh, Daab and Metallo2009), and bacterial type III secretion systems, which show a variety of forms ranging from localized structural disorder to molten globule states (Gazi et al. Reference Gazi, Charova, Panopoulos and Kokkinidis2009; Hamada et al. Reference Hamada, Kato, Ikegami, Suzuki, Hayashi, Murooka, Honda and Yanagihara2005).
11. Strategies for study of disordered proteins
Since the earliest recognition of the role of IDPs in biological processes, they have been the subject of numerous biochemical and biophysical analyses. Clearly some methods are completely unsuitable for use with IDPs, particularly those like crystallography that rely upon the formation of ordered uniform ensembles of molecules that all have the same structure. In this section, I will touch briefly on the techniques that have been used, with a brief analysis of the strengths and weaknesses of each approach. A recent issue of Current Opinion in Structural Biology was devoted to biophysical characterization of IDPs (Eliezer, Reference Eliezer2009).
11.1 Bacterial expression of IDPs
In our experience, the overexpression of intrinsically disordered domains in bacteria can be problematic, with yields of expressed protein being reduced by degradation during expression, by aggregation within the bacterial cells, or because they are toxic to the cells. These disadvantages can be mitigated somewhat by co-expression of disordered domains with their binding partners, which yields a stable complex that can subsequently be purified and manipulated in vitro to produce, for example, NMR samples where the components of the complex are differentially labeled (Demarest et al. Reference Demarest, Martinez-Yamout, Chung, Chen, Xu, Dyson, Evans and Wright2002). Alternatively, high yields of differentially labeled complex can be obtained by mixing bacterial lysates containing the overexpressed components, followed by purification of the complex (Sue et al. Reference Sue, Cervantes, Komives and Dyson2008). Interestingly, for the expression of E. coli proteins themselves, the presence of disorder in a protein sequence was positively correlated with expression, measured by both RNA and protein levels (Paliy et al. Reference Paliy, Gargac, Cheng, Uversky and Dunker2008), but the presence of large numbers of ubiquitination sites in disordered regions appears to regulate the expression levels of many highly expressed IDPs (Edwards et al. Reference Edwards, Lobley, Pentony and Jones2009).
11.2 Biochemistry of IDPs
As mentioned in Section 7, the proportion of IDPs present in a cell extract can be increased by heat treatment (Galea et al. Reference Galea, High, Obenauer, Mishra, Park, Punta, Schlessinger, Ma, Rost, Slaughter and Kriwacki2009). Treatment with certain acids can also be used to enrich for IDPs (Cortese et al. Reference Cortese, Baird, Uversky and Dunker2005): structured proteins are normally precipitated by addition of trichloroacetic or perchloric acids, while IDPs remain in solution. The observation that IDPs are not generally precipitated by such treatments forms the basis of a 2D electrophoresis method to identify IDPs (Csizmok et al. Reference Csizmok, Szollosi, Friedrich and Tompa2006).
A number of studies aimed at a general understanding of the biochemical limitations on intrinsic disorder have characterized the behavior of several different IDPs under a variety of solution conditions. In general, it is found that the state of an IDP can be affected by changes in many different biochemical features of the solution (Uversky, Reference Uversky2009b). The populations of areas of an IDP with conformational preferences for local structured regions (helical turns, β-turns or hydrophobic clusters, for example), as well as the general level of compaction of the protein (Marsh & Forman-Kay, Reference Marsh and Forman-Kay2010) are highly dependent on solution conditions. In particular, IDPs appear to be sensitive to the presence of membranes (Bartels et al. Reference Bartels, Ahlstrom, Leftin, Kamp, Haass, Brown and Beyer2010; Bonsor et al. Reference Bonsor, Meenan and Kleanthous2008; de la Cruz et al. Reference De La Cruz, Bajaj, Becker and Zweckstetter2010; Reingewertz et al. Reference Reingewertz, Benyamini, Lebendiker, Shalev and Friedler2009; Uversky & Eliezer, Reference Uversky and Eliezer2009), osmolytes (Chang & Oas, Reference Chang and Oas2010) and macromolecular crowding (Bernado et al. Reference Bernado, Garcia and Pons2004).
11.3 NMR techniques used for IDPs
Many of the solution NMR methods used to characterize folded proteins and complexes can be used for IDPs. Some experiments, indeed, may work better with disordered proteins than with ordered globular proteins, because the segments of a disordered protein may tumble independently, giving correlation times that approximate those of smaller proteins, with correspondingly narrower resonance lines. General techniques that are particularly appropriate for IDPs (and the unfolded forms of globular proteins) were reviewed several years ago (Dyson & Wright, Reference Dyson and Wright2004); since this time, a number of new NMR techniques have been developed specifically for the detection and characterization of IDPs. Two major problems occur in the NMR spectra of IDPs: the first problem is resonance overlap that may occur in a fully disordered polypeptide chain, due to the similarity in the chemical environments of nuclei in amino acids that are all equally exposed to solvent. This problem can generally be overcome by the use of a variety of multi-dimensional triple resonance spectra, transverse relaxation optimization and deuteration (Motácková et al. Reference Motácková, Novácek, Zawadzka-Kazimierczuk, Kazimierczuk, Zídek, Sanderová, KrásnÝ, Kozminski and Sklenár2010), and by utilizing hardware improvements such as cryogenic probes (Wang et al. Reference Wang, Filippov, Richter, Luo and Kriwacki2005). Less tractable is the second problem, resonance broadening that frequently occurs in IDPs due to exchange processes on an intermediate time scale compared to the NMR chemical shift time scale. This problem can be addressed to some extent by the design of pulse sequences and detection methods (Hsu et al. Reference Hsu, Bertoncini and Dobson2009; Li & Palmer, Reference Li and Palmer2010). An extensive examination of the conformational ensemble of the Alzheimer's disease tau protein provides an illustration of the power of a concerted NMR approach to the characterization of an important IDP (Mukrasch et al. Reference Mukrasch, Bibow, Korukottu, Jeganathan, Biernat, Griesinger, Mandelkow and Zweckstetter2009).
Paramagnetic relaxation enhancement (PRE) detected by NMR is a venerable technique that has become one of the premier sources of structural and dynamic information on disordered proteins. The PRE method takes advantage of the r −6 distance dependence of the magnetic dipolar interaction between an unpaired electron and the NMR-active nucleus of interest. Because the magnetic moment of the unpaired electron is much larger than that of the nuclear spin, PRE effects are large, and can be observed at much longer distances than, for example, the nuclear Overhauser enhancement (NOE), the analogous dipolar interaction between nuclear spins. PRE is also ideally suited to the estimation of distance ranges in conformational ensembles such as those occur that with IDPs. The application of this method to the characterization of low-populated states (such as might occur, for example, in an IDP with a local conformational preference) has been recently reviewed (Clore & Iwahara, Reference Clore and Iwahara2009), and the specific case of the description of a conformational ensemble has been reported (Iwahara & Clore, Reference Iwahara and Clore2010). Examples of the use of PRE in specific systems include the drkN SH3 domain (Xue et al. Reference Xue, Podkorytov, Rao, Benjamin, Sun and Skrynnikov2009c), the p53 TAD (Lowry et al. Reference Lowry, Stancik, Shrestha and Daughdrill2008b) and the Parkinson's disease protein α-synuclein (Wu & Baum, Reference Wu and Baum2010).
Another powerful tool that has recently been employed for the NMR characterization of IDPs is the measurement of residual dipolar couplings (RDC), which are measured under conditions of weak alignment (Dames et al. Reference Dames, Aregger, Vajpai, Bernado, Blackledge and Grzesiek2006). Examples include α-synuclein (Bertoncini et al. Reference Bertoncini, Jung, Fernandez, Hoyer, Griesinger, Jovin and Zweckstetter2005; Sung & Eliezer, Reference Sung and Eliezer2007) and β-synuclein (Bertoncini et al. Reference Bertoncini, Rasia, Lamberto, Binolfi, Zweckstetter, Griesinger and Fernandez2007). Indeed, the combination of RDC and PRE experiments is frequently employed to give a more complete picture of the conformational ensemble of an unfolded or partly folded protein (Meier et al. Reference Meier, Blackledge and Grzesiek2008; Rospigliosi et al. Reference Rospigliosi, Mcclendon, Schmid, Ramlall, Barre, Lashuel and Eliezer2009; Salmon et al. Reference Salmon, Nodet, Ozenne, Yin, Jensen, Zweckstetter and Blackledge2010).
NMR experiments are particularly suited to the estimation of polypeptide chain dynamics, and the dynamics of IDPs have been a subject of much study. The experimental techniques used to study dynamics, particularly in disordered systems, were recently reviewed (Mittermaier & Kay, Reference Mittermaier and Kay2009; Niu et al. Reference Niu, Bruschweiler-Li, Davulcu, Skalicky, Bruschweiler and Chapman2011). One of the problems with classical methods such as the model-free approach (Lipari & Szabo, Reference Lipari and Szabo1982) when applied to disordered proteins is that a number of assumptions that are valid for globular proteins are no longer appropriate. For example, the assumption of a uniform overall correlation time for all molecules is clearly inapplicable to a conformational ensemble. A particularly interesting case arises for proteins that consist of a structured domain and a long unstructured tail. Anomalies in the picosecond–nanosecond dynamics of such a system were early noted for the prion protein (Donne et al. Reference Donne, Viles, Groth, Mehlhorn, James, Cohen, Prusiner, Wright and Dyson1997; Viles et al. Reference Viles, Donne, Kroon, Prusiner, Cohen, Dyson and Wright2001). A recent comprehensive analysis was able to resolve the anomalies and suggest a methodology for dealing with the ‘tail wagging the dog’ that occurs for molecules with long disordered tails (Bae et al. Reference Bae, Dyson and Wright2009).
11.4 Fluorescence methods
Transient contacts between non-adjacent parts of polypeptide chains are readily detected by FRET. Newer single-molecule techniques have been particularly popular in defining the populations of more- or less-compact conformers in disordered protein ensembles (reviewed in Lu, Reference Lu2005). Examples of systems where these techniques have given valuable new insights include p53 (Huang et al. Reference Huang, Rajagopalan, Settanni, Marsh, Armoogum, Nicolaou, Bain, Lerner, Haas, Ying and Fersht2009), α-synuclein (Ferreon et al. Reference Ferreon, Gambin, Lemke and Deniz2009a) and three IDPs with contrasting properties (Müller-Späth et al. Reference Müller-Späth, Soranno, Hirschfeld, Hofmann, Rüegger, Reymond, Nettels and Schuler2010).
11.5 Other experimental techniques
A variety of experimental techniques have been applied to the structural and dynamic characterization of IDPs. Some of these methods are really only applicable to small numbers of systems, while others are experimentally difficult to access or the results difficult to interpret for conformational ensembles. Among these specialized methods are: electron paramagnetic resonance (EPR) spectroscopy of spin-labeled proteins, which has been used to confirm the binding of the N-terminal tail of the measles virus to the rigid C-terminal domain (Belle et al. Reference Belle, Rouger, Costanzo, Liquiere, Strancar, Guigliarelli, Fournel and Longhi2008; Kavalenka et al. Reference Kavalenka, Urbancic, Belle, Rouger, Costanzo, Kure, Fournel, Longhi, Guigliarelli and Strancar2010; Morin et al. Reference Morin, Bourhis, Belle, Woudstra, Carriere, Guigliarelli, Fournel and Longhi2006), infrared spectroscopy of specifically deuterated bonds (Cremeens et al. Reference Cremeens, Zimmermann, Yu, Dawson and Romesberg2009), vibrational spectroscopy (Bischak et al. Reference Bischak, Longhi, Snead, Costanzo, Terrer and Londergan2010), 19F-NMR spectroscopy (Winkler et al. Reference Winkler, Harkins, Lee and Gray2006), mass spectrometry (Frimpong et al. Reference Frimpong, Abzalimov, Uversky and Kaltashov2010), NMR relaxation studies of bound water (Bokor et al. Reference Bokor, Csizmok, Kovacs, Banki, Friedrich, Tompa and Tompa2005), high speed atomic force microscopy (Ando et al. Reference Ando, Kodera, Takai, Maruyama, Saito and Toda2001, Reference Ando, Uchihashi, Kodera, Yamamoto, Taniguchi, Miyagi and Yamashita2007), small angle X-ray scattering (Bernado et al. Reference Bernado, Mylonas, Petoukhov, Blackledge and Svergun2007, Reference Bernado, Perez, Svergun and Pons2008, Reference Bernado, Perez, Blobel, Fernandez-Recio, Svergun and Pons2009, Reference Bernado, Modig, Grela, Svergun, Tchorzewski, Pons and Akke2010; Blobel et al. Reference Blobel, Bernado, Svergun, Tauler and Pons2009), time-of-flight neutron scattering (Gaspar et al. Reference Gaspar, Appavou, Busch, Unruh and Doster2008) and Raman optical activity (Zhu et al. Reference Zhu, Kapitan, Tranter, Pudney, Isaacs, Hecht and Barron2008).
11.6 Computational studies of IDPs
Apart from the bioinformatic studies that use sequence data from genomic databases to predict the occurrence of IDPs and IDRs, there has also been a great deal of thought given to the theoretical underpinnings of the IDP phenomenon and the simulation of conformational ensembles by computational methods. It is impossible to do full justice to this rapidly burgeoning field; contributions to the description of energy landscapes have been made from a number of labs (Dosztanyi et al. Reference Dosztanyi, Csizmok, Tompa and Simon2005; Lobley et al. Reference Lobley, Swindells, Orengo and Jones2007; Lowry et al. Reference Lowry, Hausrath and Daughdrill2008a; Mao et al. Reference Mao, Crick, Vitalis, Chicoine and Pappu2010; Tran et al. Reference Tran, Wang and Pappu2005, Reference Tran, Mao and Pappu2008; Tyka et al. Reference Tyka, Keedy, Andre, Dimaio, Song, Richardson, Richardson and Baker2010) and computational modeling of disordered states has been reported using various methods (Fisher et al. Reference Fisher, Huang and Stultz2010; He et al. Reference He, Liwo, Weinstein and Scheraga2011; Staneva & Wallin, Reference Staneva and Wallin2009; Zwier & Chong, Reference Zwier and Chong2010). Computational approaches to docking of small molecules and IDPs have also received significant attention (Andrusier et al. Reference Andrusier, Mashiach, Nussinov and Wolfson2008; Follis et al. Reference Follis, Hammoudeh, Wang, Prochownik and Metallo2008; Hammoudeh et al. Reference Hammoudeh, Follis, Prochownik and Metallo2009; Mobley & Dill, Reference Mobley and Dill2009). Although systems in conformational equilibrium in solution may appear simple, it is clear from the studies quoted that challenges remain for attempts to define such ensembles in their entirety in silico.
12. Conclusions
It is clear from the foregoing that interest in IDPs spans a multitude of fields, and generates a multitude of opinions. It now seems that IDPs are incontrovertibly part of the landscape of protein structure and function. Motion and flexibility in proteins are ubiquitous, even in systems that we would normally think of as ‘structured’. For example, defined motions are frequently part of the mechanisms of highly specific enzymes, and disallowing these motions causes severe disruptions to the enzymatic activity. Disordered proteins may be seen as an extremum on the continuum from fully folded, entirely rigid proteins through flexibility and conformational heterogeneity. These observations clearly indicate that the proteome is vastly more versatile than we had imagined even only a few years ago, and we anticipate with eagerness further surprises in this field.
13. Acknowledgments
I thank Peter Wright and members of the Wright and Dyson groups, past and present, for helpful discussions, and Harold Scheraga for a critical reading of the manuscript. This work was supported by grants GM57374 and GM71862 from the National Institutes of Health.