I. INTRODUCTION
In this era of industrialization, the efficiency and cost-effective production of chemicals and materials is the order of the economic drive. Nine of 10 industrial processes are catalytically driven.Reference Leary and Westwood1 It is therefore vital to develop improved catalyst technologies, i.e., catalysts with all the essential attributes of good activity, stability, selectivity, and the ability to regenerate.Reference Dong, Guo, Wang, Li and Wu2 In recent years, the use of precious metal catalysts has found popularity in chemical industries, fuel cell production, and catalytic converters. However, precious metal catalysts (e.g., Pd, Ru, Pt, Rh, etc.) in bulk metal form are problematic when it comes to the stabilization of the metal and the recovery of the expensive precious metal after use. Supporting precious metal catalysts allows for the fine dispersion and stabilization of small metallic particles to obtain optimum catalyst utilization and to reduce the amount of precious metal used, thus reducing catalyst costs. This also provides access to a much larger number of catalytically active atoms than in the corresponding bulk metal, due to high surface area of exposed active sites.Reference Kim, Kim and Luo3
Nanosized carbon (e.g., carbon nanotubes, nanofibers) has been exploited as supporting materials for metal catalysts.Reference Choy4, Reference Graham, Dozier, Khatri, Bahome, Jewel, Mhlanga, Coville and Davies5 Carbon-supported catalysts have shown to exhibit potential high selectivity for olefins in the synthesis of chemicals by the Fischer Tropsch reaction. Also, the stability of carbon nanotubes-/spheres-supported catalysts was excellent.Reference Mhlanga, Mondal, Carter, Witcomb and Coville6–Reference Zaman, Khodadi and Mortazavi10 However, due to its extremely low density, it is not feasible to use it industrially as a support. Other widely used support materials include TiO2, SiO2, and Al2O3. While these are excellent supports for some heterogeneously catalyzed reactions, they also have their own shortcomings. For example, in recent years, carbon has been competing with alumina and silica due to numerous advantages it possesses. Carbons are stable in both acidic and basic media, while alumina or silica dissolves at high pHs, and often, alumina is also reported to degrade at very low pHs. As such, precious metals on carbon catalysts are mainly used in liquid phase hydrogenation, dehydrogenation, or oxidation reactions in the fine chemicals area where high acidity and basicity are the order of the day.Reference Dong, Guo, Wang, Li and Wu2, Reference Kim, Kim and Luo3 Carbon is therefore an ideal material to use in reactions that involve the synthesis of chemical from gaseous hydrocarbons such as CO, CO2, and CH4.
Carbon as an impurity in TiO2 can be introduced to enhance the properties of the TiO2 such as photocatalytic activity and stability. However, the effect of the carbon depends on the location of the carbon atoms in the matrix of TiO2. Carbon can be doped into the lattice or coated onto the surface of the TiO2. As a dopant, carbon induces electronic structure modification, whereas as a coating, it serves as a protective layer or an intermediate membrane.Reference Leary and Westwood1
The character of the TiO2 material with carbon impurities depends on the site the carbon occupies, the phases of TiO2, the carbon–TiO2 interface, type of bonding present, the nanoscale morphologies (nanotubes, nanospheres, etc.), functionalization, TiO2 to dopant mass ratio, and surface area.Reference Di Valentin, Pacchioni and Selloni11 These factors are highly dependent on the synthesis process. Thus, control over the synthesis is crucial.
The valence shell of the C atom (2s 22p 2) and Ti atom (4s 23d 2) both contain four electrons but can also accommodate up to four excess electrons as it is observed in TiC. This allows for carbon to be doped into the lattice of TiO2. The location of the doping atom depends on the oxidation state of the carbon and can either be a substitutional anion, an interstitial cation, or both. It is reported that the oxidation state of the C atom ranges from negative in the substitutional sites of the lattice to highly positive in the carbonate species. This implies that the substitutional anion is associated with the −4 oxidation state of the Ti–C bond in carbides and the interstitial cation with the +4 state of the C–O bond in carbonates. Thus, the character of carbon dopants is determined by whether carbon is oxidized or reduced when introduced in a TiO2matrix.Reference Di Valentin, Pacchioni and Selloni11, Reference Park, Kim, Park and Tachkaw12
The anion carbon doping induces modifications of the TiO2 electronic band structure by band gap narrowing or the formation of localized midgap. This is consequential to the visible light absorption and the transfer of photoexcited carriers to the reactive sites at the catalyst surface. This enhances the photocatalytic activity of the TiO2.Reference Leary and Westwood1, Reference Linselbigler, Lu and Yates7, Reference Gupta and Tripathi13
The high TiO2 crystallinity and a large fraction of the anatase phase of TiO2 are must be maintained to keep the electron–hole pair recombination minimal while maintaining a high ultraviolet (UV)/Vis TiO2 photoactivity in carbon-doped photocatalysts.Reference Gupta and Tripathi13 This aspect highlights the difference between carbon doped and carbon coated. Coating TiO2 with carbon delays the phase transformation from anatase to rutile and through that improves the crystallinity of anatase phase in TiO2, which induces high photoactivity. Carbon coating can also reduce the amount of UV radiation reaching the surface of the TiO2 particles.Reference Inagaki, Kojin, Tryba and Toyaba14 A balance among the factors controlled by the carbon layer on the TiO2particles is required to get high photocatalytic activity.
The C/TiO2 materials used in this project were produced by the chemical vapor deposition (CVD) technique using a single source precursor in the absence of a catalyst. CVD processes are known to produce both spheres and other shapes. Numerous methods have been reported to produce TiO2 spheres; however, CVD and sol–gel have been methods of choice to synthesize these materials. CVD methods require high temperatures (400–1000 °C), which make the method difficult for large-scale application.Reference Jung15 The CVD technique is however simpler to carry out as compared to the sol–gel process. It also provides an easy platform to control the composition of the deposit by varying synthesis parameters. However, the sol–gel technique has a higher deposition rate compared to CVD. This is because CVD is a vapor process. The deposition rate generally affects the morphology and particle size distribution of the resulting product.Reference Saito, Ando and Tobe16, Reference Harizanov, Gesheva and Stefchev17
The aim of the research was to use green chemical strategies to synthesize nanostructured materials of carbon and TiO2 for use as catalyst support materials, hence the choice of a single source precursor. In this project, novel nanocrystalline C/TiO2 synthesized via a single source CVD method where carbon can be doped into the lattice or coated onto the surface of the TiO2was synthesized.
II. EXPERIMENTAL
A. Synthesis of carbon-doped (C/TiO2) spheres
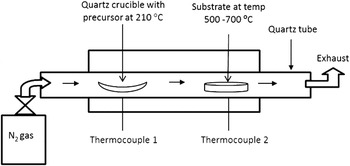
Carbon-doped TiO2 spheres were synthesized by the direct pyrolysis of a single source precursor, Ti(IV) butoxide. The process was undertaken in a quartz tube system in a two-stage furnace (Fig. 1). First, a quartz substrate was placed in the second stage of the furnace (where thermocouple 2 is located), and the furnace was heated to the desired temperature (500–700 °C) at a ramping rate of 10 °C/min, under N2 flow (50 mL/min). Once the desired temperature was attained, a quartz boat loaded with the Ti(IV) butoxide was placed in the first stage of the furnace (where thermocouple 1 is located), and the furnace was heated to the decomposition temperature of the precursor (210 °C). Heat transfer from zone 2 to zone 1 was prevented by quartz wool that was fixed in the middle of the furnace. The two stages of the furnace were kept at those conditions until the entire precursor was vaporized and deposited on the substrate in zone 2. The system was then switched off and cooled to room temperature under N2flow.
Diagram showing the experimental setup of a two-stage CVD process using to synthesize C/TiO2spheres.

In an attempt to control the sizes of the materials, several reactions were performed varying the N2flow rate (50–200 mL/min) and the decomposition temperature (500–700 °C) in the second stage (zone 2) of the furnace. Our previous studies have shown that the gas flow rates and temperature are key in controlling the size and microstructure of spherical nanoparticles synthesized by the CVD process.
B. Characterization
The synthesized C/TiO2 spheres were characterized by x-ray diffraction (XRD) with Cu Kα to determine the crystal phase of TiO2; scanning electron microscope (SEM) equipped with energy dispersive spectroscopy (EDS) was used to determine the elemental composition of the TiO2 material. The morphology, structure, and particle size of the samples were examined by transmission electron microscopy (TEM) and SEM. Raman spectra were recorded at room temperature using a micro-Raman spectrometer with a 514.5-nm Ar+ laser as the excitation source in a backscattering geometry. Thermogravimetric analysis (TGA) under constant flow of air was used to determine the thermal stability of the material. Surface area analysis of the TiO2spheres was carried out by the use of Brunauer-Emmett-Teller (BET) nitrogen adsorption. Densities of the materials were measured by condensing a certain mass of the material in a measuring cylinder.
III. RESULTS AND DISCUSSION
A. TEM analysis
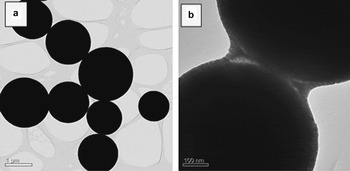
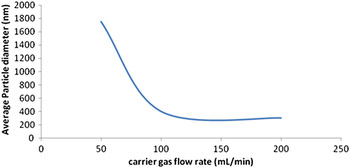
C/TiO2 spheres were successfully synthesized as a fine gray powder. The color of the spheres was intermediate to that of pure carbon spheres (black) and TiO2 (white). TEM analysis of the products revealed that the materials were all spherical particles (Fig. 2). The particle sizes (diameters) of the materials were between 1 and 1.5 μm with the change in temperature from 500 to 700 °C. When carrier gas flow rate was varied from 50 to 200 mL/min, the size of the spheres was reduced from micrometer (μm) to nanometer (nm) (Fig. 3). The change in size is caused by the amount of time (residence time) the reactive gas species (vapor) of the precursor spends in zone 2 of the furnace. Lower flow rates mean that a long time is spent by the vapor in that zone, which results in increased growth of the spheres. The mechanism of growth is explained elsewhere.
(a) TEM image of C/TiO2 spheres synthesized in a two-stage furnace at 700 °C; N2gas flow rate = 50 mL/min. (b) A higher magnification image shows that the materials have a core–shell structure.

Plot graph of carrier gas flow rate versus average particle diameter of spheres synthesized at temperature of 700 °C.

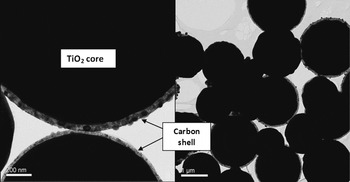
Since the precursor, Ti(IV) butoxide, contains carbon in its structure, it was envisaged that the product (i.e., TiO2 spheres) would be doped with carbon. TEM analysis of the product obtained shows a core–shell structure (Fig. 4),i.e., a dark sphere is surrounded by a faint outer shell. As per procedure, the faint shell can be thought as the carbon, surrounding the TiO2 sphere. The thickness of the outer shell was about 20 nm under the reactions conditions used. However, not all the spheres were found to have this outer shell. Studies are underway to investigate the cause of this observation. We believe that some of the carbon may be doped into the core of the materials. However, the density of the reactive species during pyrolysis favors the deposition of carbon as a shell on the TiO2.
TEM images of the C/TiO2spheres showing the core–shell structure.

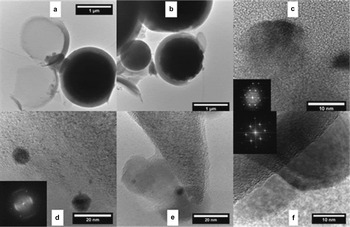
Through the use of high resolution transmission electron microscopy (HRTEM) analysis, it was possible to confirm the crystallographic composition of both the carbon shell and also the titania core. This analysis was carried out using a FEI Tecnai F20 (Minato, Japan) at 200 kV. It was found that certain spheres had broken open and these were used to allow access to the inner core for imaging. Figures 5(a)–5(f) show a collection of HRTEM images from low to increasing magnification confirming the core–shell structure. It is also observed that some of the carbon material in the shell is of a graphitic nature, while there is also an amorphous component. The TiO2inside the core–shell was confirmed to have crystalline structure, predominantly in the anatase phase.
HRTEM images of the core–shell structures [(a) and (b)] showing the result of the shell breaking open allowing the TiO2 to be dissolved out of the structure. Image (c) shows the crystallographic structure of TiO2 found leached from the core of a structure with power spectrum insert confirming rutile in the (111) orientation. Images (d) and (e) confirm the presence of highly disordered graphitic type layering of the carbon material on the surface of the shell. TiO2 in the rutile phase was only found as nanoparticles imbedded in the carbon material. Image (f) shows a large TiO2rutile particle in the (010) orientation associated with the other core of the structure.

It was noted that that the core material of the clusters was composed mainly of titania held together by amorphous carbon material. This also accounts for the darker regions observed in the shell in Fig. 5 as these are TiO2 nanoparticles that were included into the shell rather than the core. These nanoparticles were predominantly rutile phase of TiO2.
The size and shape of the material are properties that can be influenced by several factors. A few most dominant factors are growth mechanism, synthesis parameters (temperature, carrier gas flow rate, etc.), and the type of precursor used. The growth mechanism is interlinked with the synthesis method/technique chosen. In this case, CVD is a method of choice; it offers the advantage of tailoring the particle distribution by altering synthesis parameters and paying attention to the parameters that are also feasible to initiate a chemical reaction of the precursor/s used.
Previous studies on the CVD fabrication of TiO2 nanomaterials show extensive favoritism of organic Ti precursor. The ease with which these types of precursors are pyrolyzed is a function of their vapor pressure. Generally, these precursors have low vapor pressure, thus need additional heating to increase equilibrium vapor pressure. The key step in obtaining the TiO2 is a trait of the ease with which the precursor pyrolyzes. An explanation for the difference in particle size distribution resulting from the use of organic precursors has been discussed by Guosheng et al.Reference Guosheng, Tomohiro, Bunsho and Aicheng18 in terms of the nucleation and growth rate of the TiO2. The TiO2spheres are formed by the following sequential reaction in the quarts tube reactor: (i) heating at the first stage of the furnace turns the organic Ti precursor into vapor; (ii) diffusion and the carrier gas nitrogen push the organic Ti vapor to the high temperature zone (second stage of the furnace); (iii) the vapor is decomposed in the high temperature zone where it is deposited on the substrate.
In a vapor or liquid process via pyrolysis of metal–organic precursors, the decomposition of the reactant is rapid, and the nucleation and growth of TiO2 particles occur in a quasiequilibrium state after the completion of chemical reactions. This process can be thought as polymerization of TiO2. TiO2 monomers condensate to form larger clusters by homogeneous nucleation in the gas phase based on the collision mechanism, forming microspheres and nanospheres. The density of the vapor of the organic Ti precursor has a significant impact on the diameter of the formed TiO2 spheres. If the density of the vapor of organic Ti compounds is low, the possibility of agglomeration of small TiO2 droplets reduces greatly, favoring the formation of nanospheres. By changing the flow rate of the carrier gas, one can change the density of the vapor. This is why the diameter of TiO2 spheres decreased from 1.5 μm to 200 nm when the flow rate of the carrier gas was increased from 50 to 200 mL/min. The same effect can also influence the phase of the TiO2formed, in which using a denser precursor brings about a slow growth, which essentially favors the formation of rutile, whereas faster growth permits the formation of some, or exclusively, anatase.
B. Thermal stability analysis
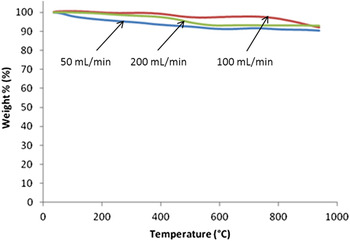
The TGA of the TiO2 spheres was carried out using a Perkin Elmer Pyris TGA (Perkin Elmer, Santa Clara, CA) under a continuous flow of air (50 mL/min). The TGA profiles of the C/TiO2 spheres synthesized at different temperatures and purge gas flow rates are presented in Fig. 6. Analyses of the TGA profiles revealed that the TiO2materials are fairly stable when heated from room temperature to 1000 °C; all the samples still attain above 90% of their mass at 1000 °C. The 2–10% weight losses observed in the samples are an attribute of moisture and other small quantities of amorphous materials or impurities. The small differences in the plots are an attribute of the variation in amount of unstable impurities, formed during the synthesis. Thus, the heat treatment of the samples before use may be crucial in catalysis. The calcination of the catalysts, which removes the impurities, is highly recommended.
TGA profiles for the C/TiO2spheres synthesized at 700 °C and varied gas carrier flow rate (a) 50 mL/min, (b) 100 mL/min, and (c) 200 mL/min.

C. XRD analysis
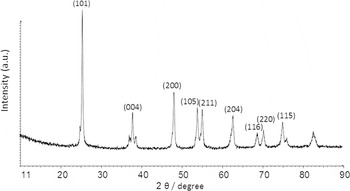
XRD analysis of the C/TiO2 powder revealed that the TiO2 in the core of the samples is the crystalline form of anatase phase (Fig. 7). Contrary to what was observed in TEM, the patterns exhibit all the characteristic peaks of the anatase phase. According to the literature, the metastable anatase phase of the TiO2 tends to transform to the more stable rutile. This implies that the sample synthesized at 700 °C should show the presence of rutile species (as seen in TEM). However, this is not seen in any of the XRD spectra, suggesting that single source CVD method used in this work favors mainly the anatase form of TiO2 despite the temperature used. However, the observation of the rutile phase from TEM cannot be excluded. From TEM, the rutile phase was observed for the nanoparticles in the outer shell of the spheres. The ratio of these outer shell TiO2nanoparticles compared to the core is very small and could not be detected by XRD.
XRD patterns of TiO2spheres synthesized at temperature of 700 °C and flow rate of 50 mL/min. The XRD patterns were similar for the materials obtained at other gas flow rates used.

In addition, the resistance to transformation of the material can be attributed to the presence of the carbon in the material. The precursor used in the synthesis comprises of the Ti, O, and C atoms in the ratio 1:4:16, respectively, thus it is expected that the resulting TiO2 material has some traces of carbon. The precursor provides a nonexternal source, thus it is kinetically favored that the carbon will be incorporated into TiO2. For example, the direct pyrolysis of carbon containing solvents at high temperatures results in the deposition of carbon spheres. However, the XRD pattern does not show any carbon peaks. It could be that the carbon content in the sample is lower than the detection limit of the XRD (see also Sec. III. D). The carbon content consequently could be estimated at approximately 5% or less, i.e., the detection limit of XRD.
D. EDS analysis
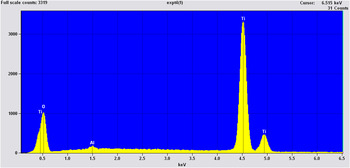
The materials were further investigated for elemental composition using EDS. Strong Ti and O peaks were observed, indicating that the formed spheres were TiO2 (Fig. 8). However, there was no carbon peak in the spectrum. The EDS spectrum can show the presence of an element regardless of whether it is doped or coated onto the surface. The absence of the carbon can bring doubts of whether the carbon is incorporated into the material or flushed out of the reactor. However, it was expected that carbon should be present in the material because of the use of a nonexternal precursor of all the atoms. The EDS spectra was coherent with the XRD pattern and show only the presence of TiO2. The ability to detect an element is related to its atomic mass. Thus, lighter elements such as H, C, and N are consequently difficult to detect. Since the EDS detector looks at a wide range of the x-ray spectrum simultaneously, the background signal is fairly high, and it cannot detect concentrations below about 0.5 wt%.
EDS spectrum of TiO2 spheres synthesized at constant temperature of 700 °C and flow rate of N2of 200 mL/min. The energy dispersive x-ray (EDX) spectra were similar for the materials obtained at other gas flow rates used.

E. Raman spectroscopy analysis
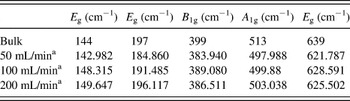
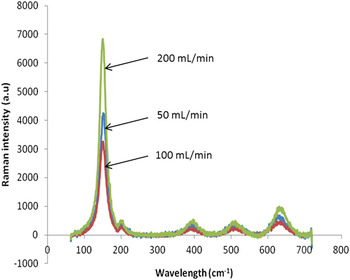
According to group theory, TiO2 has 15 optical modes in Raman with irreversible representation, 1A 1g + 1A 2u +2B 1g + 1B 2u + 3E g + 2E u. There are six allowed modes for anatase phase; 144 cm−1 (E g), 197 cm−1 (E g), 399 cm−1 (B 1g), 513 cm−1 (A 1g), 519 cm−1 (B 1g), and 637 cm−1 (E g). The rutile phase has four allowed modes at 612 cm−1 (A 1g), 143 cm−1 (B 1g), 826 cm−1 (B 2g), and 447 cm−1 (E g).Reference Choi, Jung and Kim19, Reference Gao20 Therefore, the Raman spectra with these bands specify the phase present in the material. From the spectra (Fig. 9) five distinct bands are observed. The position of the band signify that the material is in anatase phase, agreeing with XRD data. Although there are six allowed modes for anatase, the missing band B 1g is not seen in the spectra, mainly due to the fact that the B 1g and A 1g are so close together that they may overlap and probably be seen as one band. Table I shows that there is a shift in the spectra compared to the wave numbers described for the bulk anatase; the shift is due to the effect of decrease in particle size.Reference Choi, Jung and Kim19
Values of wave numbers of TiO2modes highlighting the band shift of the Raman spectra.

a N2gas flow rate used during synthesis.
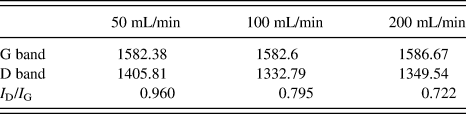
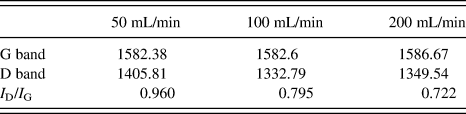
D and G band shift and defect ratio of TiO2spheres.
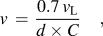
Vibrations of the molecule are attributes of the Hooke’s law. The stretching frequency of a bond can be approximated by the Hooke’s law. In this approximation, two atoms and the connecting bond are treated as a simple harmonic oscillator composed of two masses (atoms) joined by a spring. According to the Hooke’s law, the frequency of the vibration of the spring is related to the mass and the force constant of the spring, k, by the following formula F = −kx, or, where k is the force constant, and x is the displacement of the spring. In the classical harmonic oscillator, E = 1/2kx 2 = hν, where x is the displacement of the spring and x is the frequence of the vibration. Thus, the energy or frequency is dependent on how far one stretches or compresses the spring, which can be any value. Thus, when the particle size decreases, there are two effects on the vibration properties might occur. First, the size decrease induces radial pressure as a result of volume contraction, and a decrease in the interatomic radius subsequently leads to an increase in the force constant. In vibration transitions, the wave number varies approximately in proportion of k 1/2, thus the increase in force constant is shown in the shift. Second, the contraction effect induces decreases in the vibrational amplitude of the nearest neighbor bond (Ti–Ti) due to the increase of the static disorder and the thermal vibrational disorder of the material. The particle size and the frequency of the lowest energy spherical mode of the Raman spectra can be related by the equationReference Choi, Jung and Kim19:
 $$v\, = \,{{0.7\,v_{\rm{L}} } \over {d \times C}}\quad,$$
where v is the lowest energy of the spherical mode of a free particle corresponding to the angular momentum of l = 0 and v L is the speed of the longitudinal sound waves, c is the vacuum light velocity of sound waves, and d is the particle diameter. Thus, from this relationship, it can be deduced that the frequency of the E g band of the lowest energy is inversely proportional to the diameter of the particle. From the spectra (Fig. 9) and the data in Table I, one can see that the frequency, line width, and intensity of the Raman shape of the E g mode are not dependent on the temperature; similar patterns were observed at all temperatures used. This concludes that temperature has no significant effect on the particle size of the material. A similar trend can evaluate for the effect of the carrier gas flow rate, by varying the flow rate of N2 (50–200 mL/min). It is clear that the E gfrequency increases as a function of flow rate; this implies that the particle size of the material decreases with the increase in the carrier gas flow rate.
Raman spectra of C/TiO2 spheres synthesized at 700 °C using N2gas flow rates of 50–200 mL/min.

The intensity of the lowest frequency band dramatically fluctuates with the varied synthesis parameters. The intensity of the E g band can be related to the crystallinity of the material; the higher the intensity, the more crystalline the material is said to be. Therefore, Fig. 9 shows that the crystallinity of the material decreases with carrier gas flow rate. Similar results were deduced by the XRD.
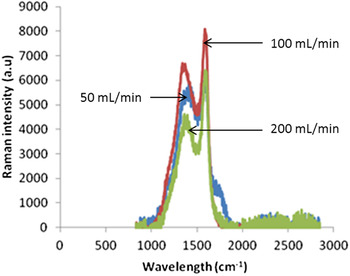
Although the XRD pattern and the EDS data showed no peak of carbon, the Raman spectra show two prominent peaks corresponding to the D and G band of graphitic carbon (Fig. 10). Table II shows that all the samples have these D band frequencies that are characteristic of the graphitic carbon. This clearly suggests the presence of carbon in the materials. However, the carbon is present in low content that the EDS and XRD cannot detect.
Raman spectra showing the D and G band of the C/TiO2spheres.

The D band is a defect-induced band; the presence of this band signifies that the graphitic carbon material is not highly crystalline. The defect quantity of the material can be estimated the ratio of the intensity of the D band and G band (I D/I G). From Fig. 10 and the values in Table II, it can be deduced that the defects decrease with increase in carrier gas flow rate. With an increased carrier flow rate, the particles are smaller and remain far apart. The space around them reduces the chances of frequent collision, which may cause agitation of the particle.
F. Density measurements
The TiO2 as a core–shell of the carbon sphere was envisaged to increase the density of the carbon to increase its resistance to degradation in applications for catalysis. In this study, the carbon shell in the sample was identified as graphitic by Raman spectroscopy and TEM. Therefore, the material is expected to exhibit some resistance to corrosion. The density of the C/TiO2 materials was measured to be 0.70 g/mL, while that of pure graphitic carbon (tubes and spheres) was ∼0.15 and 0.17 g/mL, respectively. This increase was attributed to the TiO2. The materials were dispersible in water and ethanol, thus posttreatment may not be necessary if the materials are to be used as support for catalysts. Also, compared to carbon nanotubes and carbon spheres, the C/TiO2spheres were quite stable and not “fluffy.” Thus, they could easily be packed in a reactor without too much compression or sticking to the sides of the reactor.
IV. CONCLUSIONS
C/TiO2 spheres were produced using Ti(IV) butoxide as a single source precursor. The study has shown that the diameters of the spheres could be controlled by varying the flow rate of N2 carrier gas. The carbon in the materials was either doped or formed a core–shell on the TiO2 as observed under TEM. The study proposes an alternative process of producing core–shell structures. However, further experiments need to be done to attain materials with complete core–shells. While XRD and Raman analysis revealed that all the samples exhibit the anatase phase of TiO2, TEM analysis showed that the outer shell of the spheres contains some nanoparticles of the rutile phase of TiO2, caused by the partial transformation of the anatase phase of TiO2 that was exposed in the outer shell of the spheres. The stabilization of anatase is due to the carbon layers surrounding the TiO2. Even in such small composition, that the XRD could not detect, the carbon was sufficient to suppress the transformation of the TiO2 in the core to rutile. Raman analysis revealed that the nature of the carbon surrounding the TiO2is graphitic in nature. The materials show advantages of phase transformation resistance, high thermal stability, and greater densities than that of pure carbon nanotubes and spheres, making them ideal candidates for use as catalyst supports, especially where properties of carbon are desired.
ACKNOWLEDGMENTS
The project was carried out in the School of Chemistry, Wits University, and funded by the Molecular Sciences Institute (MSI). The authors are grateful for the support.