Proteolysis in milk is mainly due to the activity of the serine proteinase; plasmin, which principally hydrolyses β-casein into γ-casein and proteose peptones but also, to a smaller extent, hydrolyses α-S1- and α-S2-casein (Fox, Reference Fox and PF1992). Plasmin enters milk from the blood in the form of plasminogen, but there are also other native proteinases in milk that may be secreted from somatic cells or leaked out from damaged somatic cells (Larsen et al. Reference Larsen, McSweeney, Hayes, Andersen, Ingvartsen and Kelly2006). The somatic cells in milk consist of neutrophils, macrophages, lymphocytes and a smaller number of epithelial cells (Sordillo et al. Reference Sordillo, Shafer-Weaver and DeRosa1997). The neutrophils, also called polymorphonuclear leukocytes (PMN), dominate in milk during mastitis (Azzara & Dimick, Reference Azzara and Dimick1985) and contain several enzymes including the serine proteases cathepsin G and elastase (Kirschke & Barrett, Reference Kirschke, Barrett, Glaumann and Ballard1987; Travis, Reference Travis1988; Owen & Campbell, Reference Owen and Campbell1999). Secretion into milk of cathepsin G and elastase has not been directly demonstrated to date (Kelly et al. Reference Kelly, O'Flaherty and Fox2006), but the specificities of elastase and cathepsin G towards αS1- and β-casein are well documented (Considine et al. Reference Considine, Healy, Kelly and McSweeney1999, Reference Considine, Healy, Kelly and McSweeney2000, Reference Considine, Geary, Kelly and McSweeney2002a).
The lysosomes in somatic cells contain the cysteine proteases; cathepsin B, H, L and S and the acid proteinase; cathepsin D (Owen & Campbell, Reference Owen and Campbell1999). Of these lysosomal enzymes, cathepsin B and D are known to exist in milk. Cathepsin B was identified in milk by immunological methods (Magboul et al. Reference Magboul, Larsen, McSweeney and Kelly2001) and its specificity towards αS1- and β-casein has been studied by Considine et al. (Reference Considine, Healy, Kelly and McSweeney2004). Cathepsin D activity was observed in milk already in 1972 by Kaminogawa & Yamauchi and was later shown to be derived primarily from its pro-form, procathepsin D (Larsen et al. Reference Larsen, Boisen and Petersen1993). Its properties and specificity have been reviewed by Hurley et al. (Reference Hurley, Larsen, Kelly and McSweeney2000). Larsen et al. (Reference Larsen, Rasmussen, Bjerring and Nielsen2004) reported that an increased proteolysis in milk from an udder quarter of a cow, experimentally infected with Streptococcus uberis, was accompanied by elevated levels of immunoreactive cathepsin B and procathepsin D.
It has been suggested that a somatic cell count (SCC) in milk higher than 400 000 cells/ml probably indicates that the cow suffers from udder inflammation (Akers, Reference Akers2002), but the threshold of SCC in relation to udder inflammation is variable and depends on pathogen and phase of inflammation (early or chronic) (Leitner et al. Reference Leitner, Shoshani, Krifucks, Chaffer and Saran2000). High SCC influences milk quality because it is associated with increased proteolytic degradation of caseins (Verdi et al. Reference Verdi, Barbano, Dellavalle and Senyk1987). Lindmark-Månsson et al. (Reference Lindmark-Månsson, Timgren, Aldén and Paulsson2005) estimated that the peptide content in milk increased from 0·03 to 2·71 mg/ml, with SCC of 20 000 and 980 000 cells/ml, respectively. In high SCC milk, it is believed that proteolysis is due less to plasmin than other proteases, e.g. cathepsins and elastase (Larsen et al. Reference Larsen, Rasmussen, Bjerring and Nielsen2004; Kelly et al. Reference Kelly, O'Flaherty and Fox2006).
It has been suggested that the proteolytic activity of lysosomal enzymes contribute to the lower yield and poorer quality of cheese made from milk with high SCC (Grandison & Ford, Reference Grandison and Ford1986; Cooney et al. Reference Cooney, Tiernan, Joyce and Kelly2000). Marino et al. (Reference Marino, Considine, Sevi, McSweeney and Kelly2005) demonstrated that addition of somatic cells (300 000 or 600 000 cells/ml) to cheese milk increased the moisture content and the activity of lysosomal enzymes in cheese. They also observed an accelerated degradation of αS1-casein in cheeses made from milk with added somatic cells. It has been shown that the degradation of αS1-casein into αS1-I during cheese ageing results in a less elastic and softer cheddar cheese (Creamer & Olson, Reference Creamer and Olson1982). Considine et al. (Reference Considine, Mc Sweeney and Kelly2002b) showed that addition of cathepsin B or elastase to skimmed milk weakened the structure of rennet-induced milk gels.
It is important to extend the knowledge on naturally occurring milk proteinase activities to better understand how to improve the technological quality of milk. The objective of this work was to identify peptides in milk, at various levels of SCC, and relate their cleavage sites to the activity of indigenous milk enzymes. In this study the activities of the proteinases actually present in milk were studied, i.e. no enzymes were added. Furthermore, the exact identities of the isolated peptides were unambiguously determined by mass spectrometry (MS) methods.
Materials and Methods
Materials
Acetic acid was purchased from J.T. Baker (Deventer, Holland), acetonitrile from Rathburn Chemicals (Walkerburn, Scotland) and trifluoracetic acid (TFA) from Merck (Darmstadt, Germany). Water was purified using a USF Elga Maxima system (Bucks, UK). Buffer solutions for high performance liquid chromatography (HPLC) were filtered through a 0·45-micron Magna nylon filter from Frisenette (Ebeltoft, Denmark) prior to use. The peptide calibration standard, 1000–4000 Da (PepMix), used for calibration of the matrix-assisted laser desorption ionization time of flight tandem mass spectrometer (MALDI-TOF MS/MS) and the MALDI target plate was from Bruker Daltonik GmbH (Bremen, Germany). The matrix α-cyano-4-hydroxycinnamic acid used for MALDI-TOF MS/MS analysis was purchased from Sigma (St Louis, USA).
Milk samples
Milk samples from one Swedish red and white cow and one Swedish Holstein cow were collected at the experimental dairy herd at Jälla (Swedish University of Agricultural Sciences) and from one Danish Holstein Friesian cow at the Research Center Foulum (Danish Institute of Agricultural Sciences). The milk samples represented 50 000, 500 000 and 16 000 000 cells/ml corresponding to good quality milk, a sub-clinical sample and a sample representing acute clinical Streptococcus uberis mastitis (Larsen et al. Reference Larsen, Rasmussen, Bjerring and Nielsen2004), respectively. The cooled milk samples were skimmed by centrifugation (3000 g, 15 min, 4°C) using a Heraeus multifuge 3 S-R (Kendro Laboratory, Albertslund, Denmark). Aliquots of skimmed milk were stored at −18°C until further analysis.
Preparation of samples for capillary reversed phase (RP)-HPLC
Acid whey was produced from skimmed milk (1 ml) via pH adjustment to 4·6 by adding 30–35 μl acetic acid (10%). An equal volume of 1 m-sodium acetate was then added to maintain the pH at 4·6. Centrifugation was carried out at 1500 g for 10 min at 5°C to separate the whey fraction from the caseins. The whey fraction (500 μl) was further ultrafiltered. This was accomplished by centrifugation, at 10 000 g for 45 min at 10°C, in Micron YM-10 filter units (Milipore, Bedford, USA) with a molecular cut-off of 10 000 Da.
Separation of peptides by capillary RP-HPLC
The capillary HPLC system from Agilent 1100 Series (Agilent Technologies 2000, Waldbronn, Germany) consisted of a capillary pump, autosampler, valve, micro-vacuum degasser, thermostated column compartment, variable wavelength detector, a cooled microwell-plate autosampler/MALDI target spotter and the software Agilent chemstation. The whey filtrate (0·5 μl) was injected onto a C18 RP-HPLC column (Agilent Zorbax 300SB, 150×0·5 mm, 300 Å, 5 μm) and eluted using a linear gradient from 100% buffer A (0·1% TFA in ultrapure water) to 55% buffer B (0·1% TFA in 80% acetonitrile) for 15 min, a second linear gradient to 60% B for 5 min and a final linear gradient to 100% B for 10 min. Column temperature was 20°C and the flow rate was 10 μl/min. Detection was monitored at 214 and at 280 nm. Volumes of 2 μl were spotted from the HPLC eluent directly onto the anchors of the MALDI target plate.
Identification of peptides by MALDI-TOF-MS/MS
A peptide calibration standard (0·2 μl) was manually spotted to a separate anchor of the MALDI target plate. A saturated solution (0·4 μl) of matrix α-cyano-4-hydroxycinnamic acid in 70% acetonitrile and 0·1% TFA was added to all spots. The calibration standard contained seven standard peptides ranging in molecular mass from 1046·54 to 3147·47 Da. A Bruker Ultraflex MALDI-TOF tandem mass spectrometer (Bruker Daltonik GmbH, Bremen, Germany) was used in reflectron mode for mass analysis of separated peptides. The instrument was calibrated using the monoisotopic masses of the peptides in the calibration standard. The ion accelerating voltage was 25 kV with a delay time of 40 ns. The laser frequency was 50 Hz and 200 laser shots were accumulated for each spectrum. Peptides were measured as +1H+. The ion accelerating voltage in MS/MS mode was 19 kV. For MS/MS dominant parent peaks in the MS spectrum were selected for further fragmentation. The peptides were identified by fragmentation of these parent ions in MS/MS mode followed by mass searches in the database Swiss Prot (Swiss Institute of Bioinformatics, Genève, Switzerland) using the MS/MS ion search programme Mascot (Matrix Science, Boston, USA). In this program the experimental mass value, obtained from MS/MS, is compared with calculated masses from a database. A scoring algorithm is used to identify the closest match, and significant (P<0·05) peptide identifications were reported.
Results
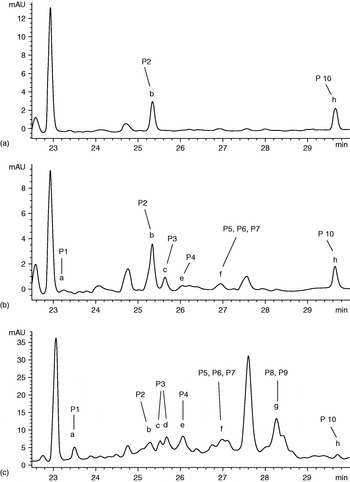
Peptides in acid whey, prepared from milk with 50 000, 500 000 and 16 000 000 cells/ml, were separated by capillary RP-HPLC and the chromatograms are presented in Fig. 1a–c. The peaks represent the peptides monitored at 280 nm and therefore mainly correspond to peptides containing aromatic residues (Tyr and Trp). In contrast, at 214 nm, mainly the contributions of the peptide bonds are measured (Scopes, 1974), and therefore in theory more comprehensively reflect the peptide material in a sample. Accordingly, the chromatograms collected at 214 nm were more complex and as such more difficult to spot reproducibly onto the MALDI target plate (results not shown). Furthermore, at 214 nm, some of the peaks were found by mass spectrometry also to contain non-protein components (result not shown). Therefore it was decided in this initial study to focus on the chromatograms obtained at 280 nm, while a comprehensive mapping of all peptides detectable at 220 nm would require a separate study.
Capillary RP-HPLC profiles of peptides in ultrafiltered acid whey prepared from milk with (a) 50 000 cells/ml, (b) 500 000 cells/ml and (c) 16 000 000 cells/ml. Peptides were eluted using a linear gradient from 100% buffer A (0·1% TFA in ultrapure water) to 55% buffer B (0·1% TFA in 80% acetonitrile) for 15 min, a linear gradient to 60% B for 5 min and a linear gradient to 100% B for 10 min. Peaks a–h were collected for MS/MS analysis and peptide (P)1–10 were identified (Table 1).

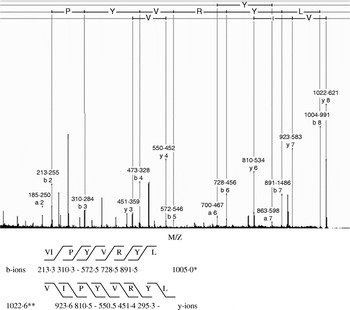
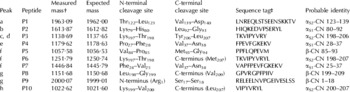
It is evident from the chromatograms in Fig. 1a–c that both the number and concentration of detected peptides (i.e. the area under the curve) present in the samples increase with cell count, and furthermore that the peptide profiles of the 50 000 and 500 000 cells/ml samples are clearly different. Peptides that could be identified by MS/MS were all eluted within 23 to 30 min and were fractionated from peaks a–h (Fig. 1). Most unlabelled peaks in the chromatogram (Fig. 1) also contained peptides but their concentrations were not high enough to be successfully fragmented in MS/MS mode and consequently not identified. The two substantial peaks with the retention times 23 and 27·6 min contained several peptides with molecular masses lower than 900 Da, but these were too small to be identified by the calibration standard employed. Table 1 shows measured masses and probable identities of the peptides in peaks a–h. All peptides were identified by MS/MS analysis of the parent peptides, as in most cases the mass of a parent peptide detected in MS mode alone could match several casein peptides (result not shown). An example of MS/MS analysis of one of the peptides (peptide P10, Table 1) is shown in Fig. 2. The most dominant ion masses were b and y ions, according to the fragmentation nomenclature proposed by Roepstorff & Fohlmann (Reference Roepstorff and Fohlmann1984). The measured mass of the parent peptide in the y-ion series was 1022·6, and most of the y-ions could be assigned (Fig. 2). The mass of the parent ion in the b-ion series corresponded to that of the b-ion, including the loss of water molecule, i.e. a measured mass of 1005·0. Also, in the b-ion series, most ions could be assigned, and taken together the combined data demonstrated the detection of the peptide P10 with the sequence VIPYVRYL, corresponding to a peptide from the C-teminal part of αS2-CN. The other peptides were similarly analysed.
MALDI TOF/TOF of the peptide P10 with measured mass 1022·6 (Table 1). The b and y ion series detected by MS/MS of the parent ion are indicated to the right of the spectrum. Amino acid single letter code is given for the sequence of the identified peptide VIPYVRYL. *, mass of the parent ion of the b-series, **, mass if the parent ion of the y-series. The mass of the parent b-ion corresponds to that of the y-ion minus water.

Identity of peptides in ultrafiltered acid whey samples (see Fig. 1 for location of peptides). The peptide masses and peptide sequences were determined by MALDI TOF MS/MS analyses

† : The measured masses were detected as the mass +1 H+
‡ : The sequence tag used for MS/MS identification
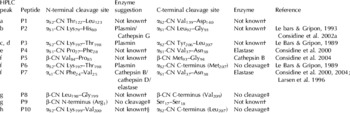
Three peptides were identified in peak f (peptides P5, P6 and P7), and two in peak g (peptides P8 and P9). Of all identified peptides, only two were observed in milk with normal SCC, i.e. 50 000 cells/ml. These included peptide P2 in peak b and peptide P10 in peak h (Fig. 1a & Table 1). In milk with 16 000 000 cells/ml we were able to identify 10 peptides (Fig. 1c & Table 1) and 8 of them were present in milk with 500 000 cells/ml (Fig. 1b & Table 1). Enzyme specificities towards cleavage sites of the identified peptides (Table 1) are presented in Table 2. The enzyme-suggestions are based on earlier reports of enzyme specificities to casein substrates in model studies (see references in Table 2). Peptides P2–P7 had at least one cleavage site (N- or C-terminal) that could be assigned to a potential responsible bovine protease according to earlier reports, including plasmin, elastase and cathepsins (Table 2). The casein cleavage sites corresponding to peptides P1, P8, P9 and P10 have not been reported earlier and therefore a potential responsible protease could not be suggested (Table 2).
Enzyme specificity towards identified cleavage sites of αS1-CN, αS2-CN and β-CN based on earlier reports

† “Not known” indicates that a possible responsible protease for generation of this cleavage site could not be suggested
‡ “No cleavage” indicates that the residue is located at the N- or C-terminal position of the protein from which it was derived, and therefore not the result of a proteolytic cleavage at that position
§ It is possible that plasmin is responsible for this cleavage, due to its preference for cleavage after lysine residues (Weinstein & Doolittle, Reference Weinstein and Doolittle1972)
Discussion
The present investigation is a qualitative study on the presence of peptides derived from caseins in raw milk at different levels of SCC. Several of the identified peptides could be ascribed to activities not only of plasmin, but also potentially to the cell associated proteases cathepsin B, D and elastase.
Peptide P2 with the cleavage site Lys79–His80 (Fig. 1 & Table 2) could have, according to the literature, been cleaved either by cathepsin G or by plasmin. This peptide was also present in milk with normal SCC, i.e. <50 000 cells/ml. It is most probable that this cleavage site corresponded to cleavage by plasmin, as the cathepsin G activity in milk with normal SCC is expected to be limited. However, the actual presence and activity of cathepsin G in milk at different levels of SCC awaits further studies.
In relation to milk proteolysis, the activities of elastase and cathepsin B have previously mainly been studied in model systems (Considine et al. Reference Considine, Healy, Kelly and McSweeney1999, Reference Considine, Healy, Kelly and McSweeney2000 & Reference Considine, Healy, Kelly and McSweeney2004). The results from the present study extend the knowledge of probable contributions of these enzymes to proteolysis in milk itself. Peptides potentially derived from activities of plasmin, cathepsin B, cathepsin D and elastase could be detected in milk with elevated SCC, i.e. 500 000 and 16 000 000 cells/ml (Fig. 1b, 1c & Table 2). Hydrolysis of the Phe24–Val25 bond in αS1-CN, generating the N-terminus of peptide P7, could be due either to elastase, cathepsin B or cathepsin D (Table 2). However, cleavage of Val37–Asn38 on αS1-CN generating the C-terminus of peptide P4 and P7 was only specific for elastase (Considine et al. Reference Considine, Healy, Kelly and McSweeney2000) and cleavage of Met93–Gly94 in β-CN, generating the C-terminus of peptide P5, only matched the specificity of cathepsin B (Considine et al. Reference Considine, Healy, Kelly and McSweeney2004; Table 2). The two possible elastase specific cleavage sites identified in this study were both located near the N-terminus of αS1-CN, which is one of the regions where elastase is most active (Considine et al. Reference Considine, Healy, Kelly and McSweeney2000). Taken together, most of the peptides identified in this study (7 out of 10 peptides; Table 1) were derived from either the N- or C-terminal regions of the protein molecules, suggesting that these parts are more readily hydrolysed probably because they are more exposed.
To our knowledge this is the first direct identification of peptides present in milk that can be linked to activity of elastase in milk through unequivocal determination of cleavage sites. Certain casein fragments in high SCC milk has earlier been ascribed to elastase activity (Moussaoui et al. Reference Moussaoui, Laurent, Girardet, Humbert, Gaillard and Le Roux2003; Nabhan et al. Reference Nabhan, Girardet, Campagna, Gaillard and Le Roux2004), but the exact identities of these peptides were not determined. Elastase activity has been detected in neutrophils from milk during experimentally induced mastitis (Prin-Mathieu et al. Reference Prin-Mathieu, Le Roux, Faure, Laurent, Béné and Moussaoui2002; Haddadi et al. Reference Haddadi, Prin-Mathieu, Moussaoui, Faure, Vangroenweghe, Burvenich and Le Roux2006). However, attempts to detect activities of leukocyte elastase in skimmed milk using a synthetic chromogenic substrate (S-2484: PyroGlu-Pro-Val-pNA) has been negative (LB Larsen, unpublished results). Difficulties in demonstrating elastase activity in milk is suggested to be due to the complex binding between elastase and its inhibitor (Christensen & Sottrup-Jensen, Reference Christensen and Sottrup-Jensen1994; Kelly et al. Reference Kelly, O'Flaherty and Fox2006).
Le Bars & Gripon (Reference Le Bars and Gripon1989) identified 8 cleavage sites after addition of plasmin to αS2-CN and one of these sites, Lys197–Thr198 in peptide P3, was identified in the present study (Table 2). An additional cleavage site in αS2-CN, Lys199–Val200, resulting in generation of peptide P10 (Table 2), has not previously been characterised as a plasmin catalysed cleavage site. However, based on the known specificity of plasmin, i.e. preference for cleavage after lysine residues (Weinstein & Doolittle, Reference Weinstein and Doolittle1972), it seems possible that plasmin was also responsible for this cleavage. Peptides P2 and P10, that most probably resulted from activity of plasmin, were also present in low SCC milk (Fig. 1a).This would indicate that plasmin was mainly responsible for the proteolysis observed in the low cell count milk, whereas the somatic cell proteases were involved at higher cell counts.
Further cleavage sites identified in this study, which have not been reported earlier, could be due to bacterial proteinases, but also to hitherto unidentified milk protease activities (Larsen et al. Reference Larsen, McSweeney, Hayes, Andersen, Ingvartsen and Kelly2006). Some strains of mastitis pathogens produce extracellular proteases, but earlier results from a storage experiment of milk from a gland with acute Strep. uberis mastitis indicated that bacterial proteases were not the principal source of the observed proteolysis (Larsen et al. Reference Larsen, Rasmussen, Bjerring and Nielsen2004).
A broader cleavage pattern for the caseins, than was observed in this study, has been reported in various model studies (Le Bars & Gripon, Reference Le Bars and Gripon1989 & Reference Le Bars and Gripon1993; McSweeney et al. Reference McSweeney, Fox and Olson1995; Larsen et al. Reference Larsen, Benfeldt, Rasmussen and Petersen1996; Considine et al. Reference Considine, Healy, Kelly and McSweeney1999, Reference Considine, Healy, Kelly and McSweeney2000, Reference Considine, Geary, Kelly and McSweeney2002a & Reference Considine, Healy, Kelly and McSweeney2004). This might be due to several reasons. One explanation could be that the hydrolysis pattern of the caseins in model systems and in milk in some instances are expected to differ (Fox & McSweeney, Reference Fox, McSweeney, Fox and McSweeney1998). It has also been shown that the structure and folding of substrate proteins affect the susceptibility for proteolysis (TK Dalsgaard, JH Nielsen & LB Larsen, unpublished results) and that the hydrolysis is affected by the environment, e.g., pH and salts (Fox & Guiney, Reference Fox and Guiney1973; Lane & Fox, Reference Lane and Fox1999). In the model studies carried out by Considine et al. (Reference Considine, Healy, Kelly and McSweeney1999, Reference Cooney, Tiernan, Joyce and Kelly2000, Reference Considine, Geary, Kelly and McSweeney2002a & Reference Considine, Healy, Kelly and McSweeney2004), the disulphide bonds in the caseins used as substrates were reduced prior to hydrolysis, which may lead to a more extensive hydrolysis than was observed in this study. Furthermore, an important notice is that only peptides with absorbance at 280 nm were selected for analysis in this study. At this wavelength mainly peptides containing Trp or Phe are detected and therefore the spectrum of identified peptides was relatively narrow, as explained in the results section.
In conclusion, we identified 10 peptides in ultrafiltered acid whey from high SCC milk (16 000 000 cells/ml). The agreement between identified cleavage sites and earlier reported specificities of plasmin, cathepsin B, D and elastase suggests their increased contribution to proteolysis in high SCC milk samples, i.e. >500 000 cells/ml. Several cleavage sites identified in this study have not been associated with indigenous enzyme specificities previously. We suggest that these sites correspond to further, yet unidentified, proteinases or other enzymes relevant for proteolysis in high SCC milk. The LC MALDI MS/MS technique used in this study proved to be a useful method to identify peptides in milk and enables further studies in peptide profiling, as in milk from other species and to monitor cheese ripening.
The authors wish to thank Stina Greis Handberg and Rita Albrechtsen, Department of Food Science, Danish Institute of Agricultural Sciences for excellent technical assistance. LBL wishes to acknowledge Dr Alan Kelly, University College, Cork, Ireland, for inspiring discussions in the field of milk proteases and AW wishes to thank PhD student Maria Åkerstedt, Department of Food Science, Swedish University of Agricultural Sciences for valuable discussions. The financial support from the Department of Food Science, Swedish University of Agricultural Sciences, the Danish Dairy Research Foundation, the FØTEK III programme and the Innovation Law are gratefully acknowledged. The NorFA network is acknowledged for financial support permitting a short-term scientific stay of AW in Foulum, Denmark.