
I. INTRODUCTION
Fe–36 wt% Ni alloy, so-called invar, is well known for its dimensional stability upon temperature changes between 20 and 100 °C. Reference Shiga1 Depending on the type and alloy composition, the coefficient of thermal expansion (CTE) of this alloy lies in the range between 1.3 and 5 ppm/°C. Reference Nagayama, Yamamoto and Nakamura2,Reference Carr and Colling3 From the practical point of view, this alloy cannot be used under the conditions where a high strength is demanded. Therefore, several researches have been performed on the age hardening of this alloy by addition of the alloying elements such as Al, Ti, Be, and Sn or the interstitial elements such as C to obtain a modified hardness and strength. Reference Ogorodnikova and Maksimova4–Reference Sun, Sun, Tong, Jia, Zhang and Peng8 Upon age-hardening, the developed precipitates from the ternary solid-solution of the invar-based alloy increase the hardness and ultimate tensile strength. Reference Gulyaev and Svistunova9–Reference Ha, Lee, Song and Jeong11
Few investigations have been conducted on the age-hardening of invar-based Sn alloys to study the microstructure of the precipitates as well as the variation of CTE upon aging. Reference Eliezer, Weiss, Ron and Nadiv12–Reference Nissan, Komen and Weiss16 The age-hardening treatment of invar-based Sn alloys brings about an increased hardness as a result of the formation of Ni3Sn2 precipitates of the hexagonal crystal structure. Additionally, the depletion of Ni atoms from the solid-solution upon aging gives rise to a raised CTE. Reference Eliezer, Weiss, Ron and Nadiv12 The Ni3Sn2 precipitates can form continuously (CP) in the form of needle-type precipitates or discontinuously in the form of lamellar/cellular precipitates. Reference Eliezer, Weiss, Ron and Nadiv12,Reference Eliezer, Nadiv (Niedzwiedz), Ron and Weiss13,Reference Nissan, Komen and Weiss16 Upon the later type of discontinuous precipitation (DP), the supersaturated matrix of the invar-based Sn alloy decomposes into the lamellae of the less Sn-saturated matrix and the Ni3Sn2 precipitate. Reference Nissan, Komen and Weiss16
The investigated growth kinetics of the DP reaction in many alloy systems follow a steady-state growth behavior as the diffusion direction of the alloying element is perpendicular to the reaction front (RF). Reference Turnbull17–Reference Xie, Wang, Xie, Mi, Liu and Gao21 This implies the time-independency of the DP growth kinetics in which the reaction kinetics is mainly controlled by the diffusion of the alloying element through the thickness of the RF instead of its diffusion through the whole volume of the matrix. Reference Turnbull17,Reference Zener22 Previous experimental researches joined with the theoretical models based on a similar approach provide a very good understanding of this steady-state growth kinetics. Reference Cahn23–Reference Seo, Bhadeshia and Suh31
In contrast to the simple experimental cases, the aforementioned steady-state growth behavior of DP reaction can be replaced by a nonsteady-state growth in the more complicated alloy systems. In these systems, a concurrent evolution of the CP precipitates in the matrix ahead of the DP RF may occur. Reference Petermann and Hornbogen32 It is also possible that the formation of the solute diffusion zone ahead of a migrating boundary results in a nonsteady-state growth. Reference Hillert25,Reference Hillert29,Reference Kikuchi, Urabe, Cliff and Lorimer33–Reference Srinivas and Kutumbarao35
The kinetics of the DP reaction has so far not been investigated for the case of the aged invar-based Sn alloys. It can be suggested that the kinetics of the DP reaction growth may follow a nonsteady-state behavior due to the simultaneous formation of CP particles. Thus, the current research focuses on studying the velocity of the DP RF upon age-hardening of the Fe–33 wt% Ni–7 wt% Sn alloy. For age-hardening, the heat treatment conditions were extracted from the calculated Fe–33 wt% Ni–Sn phase diagram by Thermo-Calc. The impact of the concurrent CP precipitation on the DP growth rate was experimentally studied and accompanied with the modified analytical model for the nonsteady-state growth kinetics of the DP reaction. In addition, the effect of cold deformation, shown to play a considerable role in the DP growth kinetics, Reference Hornbogen36–Reference Ng, Bettles and Muddle39 has been evaluated for the case of invar-based Sn alloy. The fraction of the transformed matrix via the DP reaction has been obtained by the X-ray diffraction technique and compared for the cases of homogenized and cold-rolled specimens.
II. EXPERIMENTAL
A. Specimen preparation
The alloy of Fe–33 wt% Ni–7 wt% Sn was cast using a cold crucible inductive furnace. Small pieces of pure Fe (99.98 wt%), Ni (99.98 wt%), and Sn (99.98 wt%) were mixed and melted in a water-cooled copper mold. To enhance the homogeneity, the cast was remelted two more times. For determining the concentrations of Fe, Ni, and Sn elements, X-ray fluorescence analysis technique was used, and the concentration of light element impurities such as C, S, N, and O was measured using carrier gas hot extraction and the combustion methods. The final chemical composition of the cast alloy is shown in Table I. To decrease the micro-segregations, the cast was homogenized at 1150 °C for 1 h and subsequently quenched in water. Specimens with the lateral dimensions of 10 × 15 mm2 and the thickness of 5 mm were cut from the homogenized cast (mentioned as the homogenized specimens in this paper). The samples were then aged at 700 °C for different aging times (10 min–5 h) followed by the subsequent quenching in water. To investigate the effect of cold deformation, one homogenized sheet of 5 mm thickness was cold rolled to a thickness of 4.45 mm (i.e., 11 pct. of thickness reduction) prior to the aging step, and the cold-rolled specimens were cut from this sheet.
Chemical analysis of Fe–Ni–Sn alloy.

B. Specimen characterization
1. Scanning electron microscopy (SEM)
The microstructure of the homogenized and cold-rolled specimens was investigated in a Zeiss Ultra 55 type field emission SEM (Carl Zeiss AG, Oberkochen, Germany) after aging. Prior to investigation, the surface of specimens was ground and polished (last polishing step: 1 µm diamond suspension using the vibratory polisher for 24 h). The interlamellar spacing in the DP microstructure, λ (see Sec. III.C.1), was measured from the images recorded by the ECCI technique. Energy-dispersive spectroscopy (EDS) method was used to determine the concentration of Sn in the supersaturated solid-solution before aging
 $\hbox( {x_{{\rm{Sn}}}^{{\gamma ^{{\rm{SS}}}}}} \hbox)$
as well as in the less-saturated transformed matrix
 $\hbox( {x_{{\rm{Sn}}}^{{\gamma ^{{\rm{DP}}}}}} \hbox)$
in the vicinity of the DP microstructure (see Sec. III.C.1).
2. X-ray diffraction (XRD)
X-ray diffraction patterns were recorded from the surface of the specimens before and after aging to characterize the developed phases after each heat treatment process. The XRD measurements were performed using the diffraction angle range of 20°–100° 2θ and the step size of 0.01° 2θ in a Seifert-FPM URD-6 diffractometer (SEFIERT FPM, Ahrensburg, Germany) equipped with a Cu tube. The recorded XRD patterns were evaluated by the X’Pert HighScore software (PANalytical, Almelo, the Netherlands). Each recorded diffractogram with Cu Kα radiation was composed of both Cu Kα1 and Cu Kα2 components. For obtaining the given lattice parameters in this article, the Cu Kα2 component was stripped before fitting the reflections by the pseudo-Voigt (pV) function. Each matrix reflection was fitted by two split peaks: one for the Sn-supersaturated matrix in the CP microstructure (γCP) and another for the less-saturated matrix of the DP microstructure (γDP).
To obtain the transformed matrix fraction upon the DP reaction as a function of the aging time (see Sec. III.D), the X-ray diffraction pattern in a 2θ angle range of 47°–100° was analyzed using Rietveld refinement (i.e., the (111)γ austenite reflection at a lower 2θ angle was left out from the analysis as the two split matrix peaks at the position of this reflection were not distinguishable). For reconstruction of the X-ray diffractogram, the lattice parameter of γDP was assumed to be similar to the lattice parameter of the pure invar alloy (3.5922 Å), 40 and the lattice parameter of γCP was taken as a fitting parameter.
3. High temperature confocal laser scanning microscopy (CLSM)
In situ microstructure evolutions of the polished surface of homogenized and cold-rolled specimens were observed by a high temperature CLSM (CATY-T3H/TC2KN, Yonekura MFG Co., Ltd., Osaka, Japan). The specimen with a lateral dimension of 7 × 7 mm2 and a thickness of 1 mm was placed in an Al2O3 crucible and positioned on a sample holder at one focal point of the ellipsoidal furnace chamber as described in Ref. Reference Aneziris, Schroeder, Emmel, Schmidt, Heller and Berek41. Subsequently, the specimen was heated up to 700 °C using a 1.5 kW halogen lamp with a heating rate of 200 °C/min under the argon inert atmosphere. The specimen was kept at this temperature for about 2 h and afterward cooled down to room temperature with a cooling rate of 200 °C/min. For recording images, initially a He–Ne laser was applied in combination with a 5× objective lens to find an appropriate position for the start of the DP reaction and thereafter other objective lenses with the higher magnifications were used. The micrographs recorded per minute of aging at 700 °C by a digital closed-circuit television camera were further analyzed to measure the changes of the DP RF position as a function of the aging time. The outcome of these measurements was later used to obtain the variations of the DP RF velocity versus aging time (see Sec. III.B).
III. RESULTS AND DISCUSSION
A. Phase and microstructure analyses after homogenization and subsequent aging
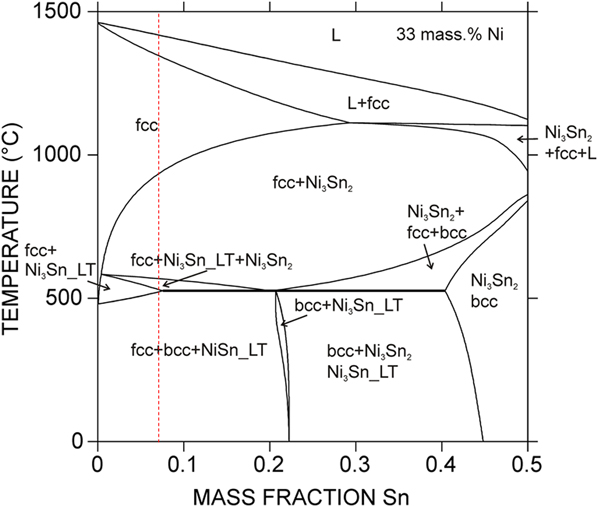
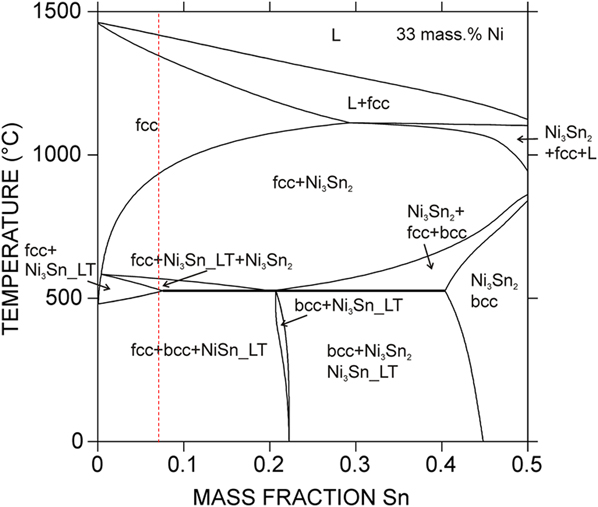
The isothermal section of the Fe–Ni–Sn ternary phase diagram has previously been reported at 270 °C in which only solubility of the third component in the binary phases has been observed, while no ternary compounds have been found. Reference Huang, Lin, Chen, Chen and Yen42 This investigated temperature is very low for performing an aging treatment. Thus, to obtain appropriate temperatures for the homogenization and the subsequent aging treatments, the phase diagram of Fe–33 wt% Ni as a function of the Sn content was calculated by Thermo-Calc program set. Reference Andersson, Helander, Höglund, Shi and Sundman43 Figure 1 depicts the calculated phase diagram with Sn concentrations between 0 and 50 wt% and for the temperature range between 0 and 1500 °C. The homogenization temperature of 1150 °C [single-phase region including austenitic phase (fcc)] and the aging temperature of 700 °C [two-phase region including austenite (fcc) phase and the precipitate of Ni3Sn2] were chosen for the heat treatment of the Fe–33 Ni wt% alloy with an approximate Sn concentration of 7 wt% (see the dashed vertical line in Fig. 1).
Phase diagram of the Fe–33 wt% Ni–Sn alloy calculated by Thermo-Calc. The vertical dashed line indicates the Sn content (∼7 wt%) of the experimental alloy.
Regarding to the thermodynamic calculations of this phase diagram, it should be noted that the thermodynamic database available from the SGTE solution database 44 was combined based on thermodynamic descriptions of the Fe–Ni, Fe–Sn, and Ni–Sn binary systems. In other words, the information on ternary solubility in the binary compounds reported in Ref. Reference Huang, Lin, Chen, Chen and Yen42 has not been taken into account in the current thermodynamic calculations. For the purpose of this research, the suggested compositions by the simulated phase diagram in Fig. 1 have shown a good compatibility with the experimental results (see below).
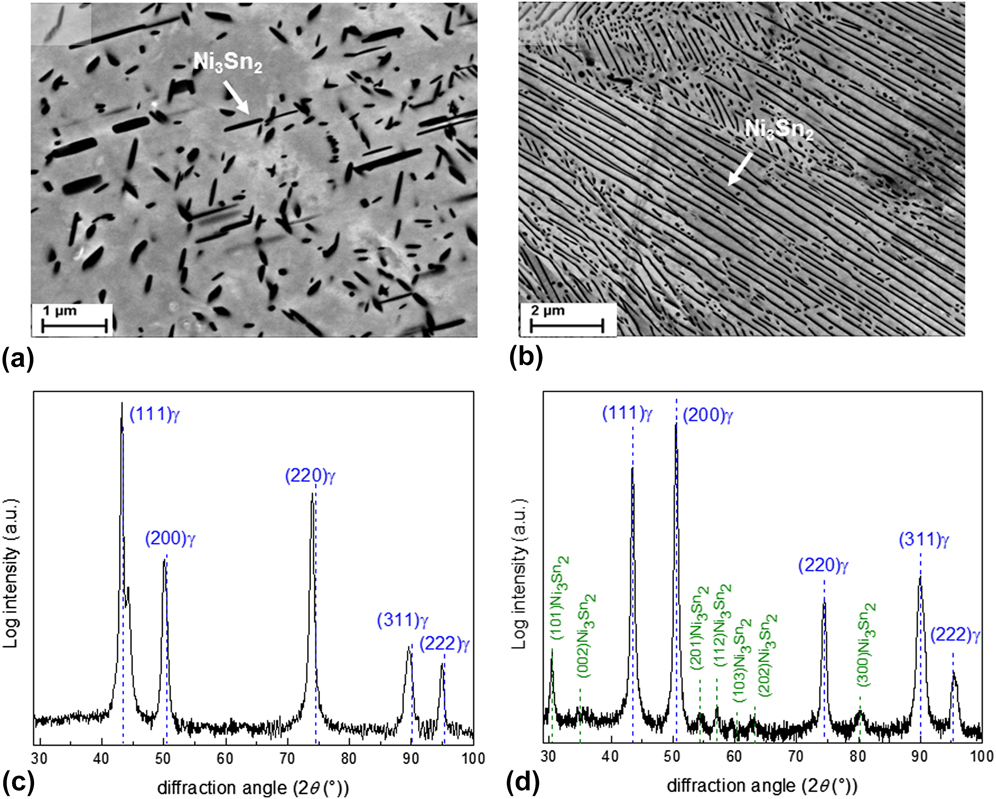
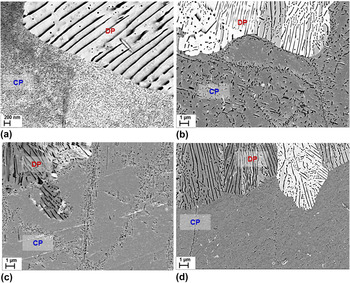
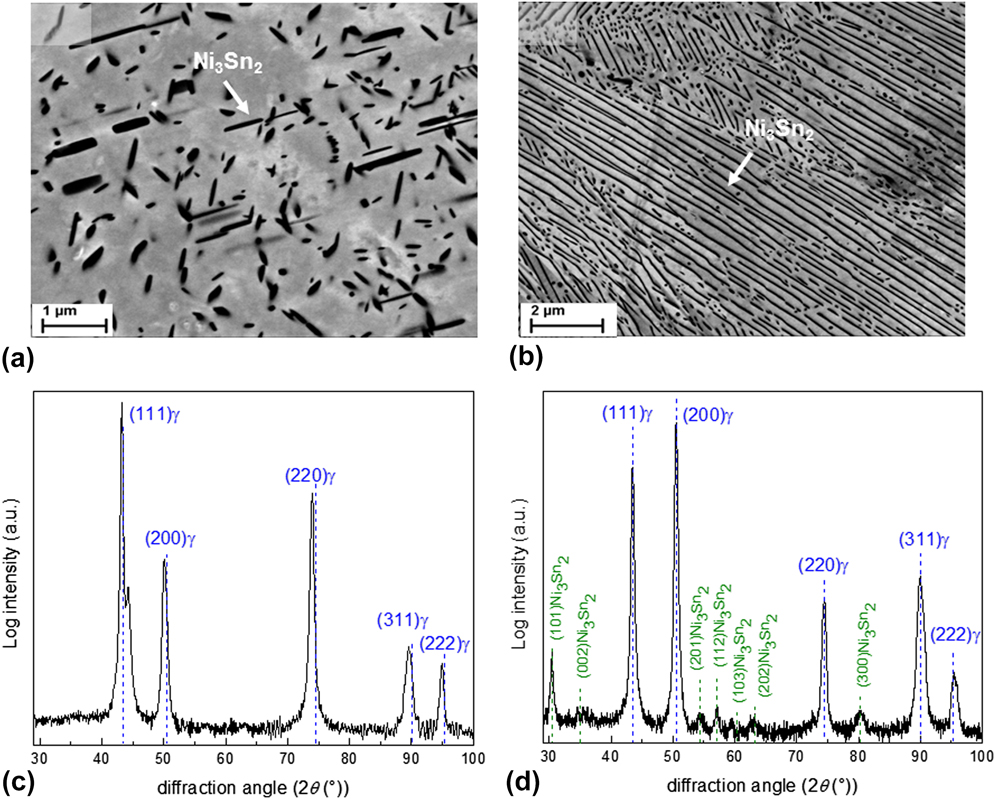
Two types of precipitates have been observed after aging treatment of both the homogenized and cold-rolled specimens at 700 °C (see Fig. 2). These precipitates are (a) continuous precipitates (CP) with a needle-type morphology having a specific orientation relationship with the austenitic matrix as reported by Ref. Reference Nissan, Komen and Weiss16 and nucleating homogenously throughout the specimen [Fig. 2(a) and (b)] discontinuous precipitates (DP) developing as lamellar precipitates and nucleating heterogeneously at the grain boundaries or on the matrix defects [Fig. 2(b)]. The driving force for the progress of the later microstructure has been attributed to the reduction of the matrix Sn-supersaturation. In addition, elimination of the huge misfit strain via transition of the coherent continuously-formed precipitates and supersaturated matrix to the incoherent discontinuously-formed precipitates and less-saturated matrix can be considered. Reference Nissan, Komen and Weiss16,Reference Manna, Jha and Pabi30 The above precipitates were characterized by XRD to be Ni3Sn2 with the hexagonal crystal structure. The X-ray diffraction pattern recorded from the cold-rolled specimen before and after aging for 10 min has been depicted in Figs. 2(c) and 2(d), respectively. The XRD pattern of specimen before aging confirms the formation of the austenitic phase after homogenization and the XRD pattern of aged specimen shows the development of two phases of austenite and Ni3Sn2 precipitate after aging at 700 °C.
ECC images of the specimen aged at 700 °C for 1 h: (a) needle-type CP develop throughout the matrix and (b) the lamellar-type microstructure contains the DP and matrix. Diffractograms (Cu Kα radiation) shown in (c) and (d) have been recorded from the surface of the cold-rolled Fe–Ni–Sn specimens before and after aging for 10 min, respectively. Positions of the XRD peaks of the Invar matrix (Fe64Ni36) with the austenitic crystal structure and the Ni3Sn2 precipitate with the hexagonal crystal structure have been shown by the blue and green vertical lines, respectively, according to Ref. 40. The intensity of the diffracted reflections has been reported in a logarithmic scale.
B. Velocity of DP reaction front upon aging
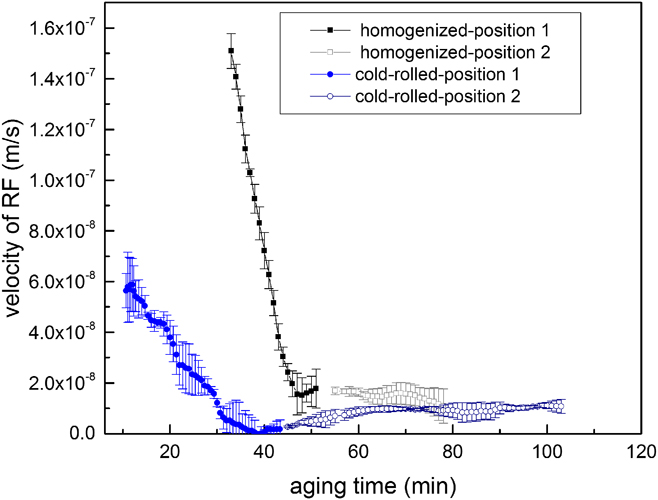
The DP nuclei mainly develop heterogeneously at the grain boundaries. Reference Xie, Wang, Xie, Mi, Liu and Gao21 That means, the starting point of the DP reaction is at the migrating grain boundaries. To indicate the velocity of the DP RF (i.e., the interface between the discontinuously transformed and the nontransformed matrices) upon aging, the position of RF relative to the position of its original grain boundary has been measured from the recorded images by CLSM as a function of the aging time (for more information see Fig. 9.12 in Ref. Reference Mittemeijer45). Correspondingly, the first derivative of the RF position change versus aging time gives the RF velocity value at that specific aging time. The progress of the DP reaction was followed from several migrating grain boundaries with different incubation times for the initiation of this reaction. Reference Manna, Pabi and Gust46,Reference Azzeddine, Abdessameud, Alili, Boumerzoug and Bradai47 The trend of the RF velocity changes as a function of the aging time is shown in Fig. 3 for the two complementary positions (positions 1 and 2), representing the whole transition trend during the studied aging time in the homogenized and cold-rolled specimens.
Decrease of the velocity of RF during discontinuous precipitation (DP) as a function of aging time in the homogenized and cold-rolled specimens. For each specimen, two positions with different incubation times for the start of DP reaction have been illustrated (positions 1 and 2). The RF velocity approaches a steady-state condition after prolonged aging times.
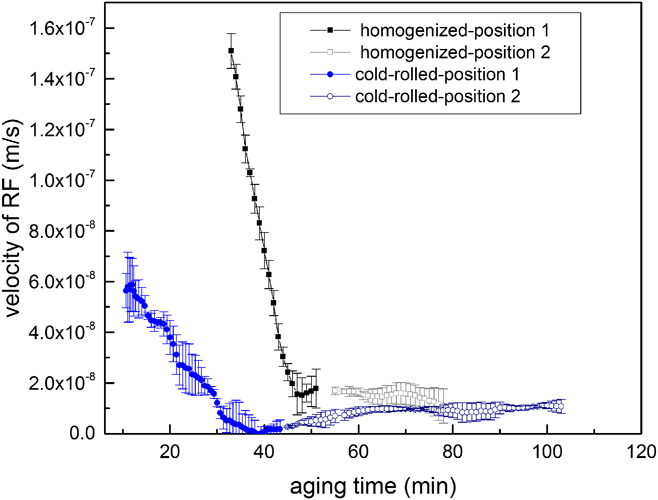
According to Fig. 3, the RF velocity in both specimens declines from the maximum value in the beginning of aging and approaches the steady-state value after the prolonged aging. In cold-rolled specimens, the DP reaction has started after a short incubation time of around 10 min with the RF velocity of approx. 6 × 10⁻⁸ m/s and has proceeded with the slight decrease of RF velocity to an approximately constant value of 0.2 × 10⁻⁸ m/s after 40 min. In contrast, the DP growth has initiated after a longer incubation time of 33 min in the homogenized specimen with the high RF velocity of approx. 1.5 × 10⁻⁷ m/s and continued by a drastic reduction of RF velocity to the constant value of around 2 × 10⁻⁸ m/s after the aging time of 50 min.
C. Supersaturation reduction in the matrix ahead of DP reaction front
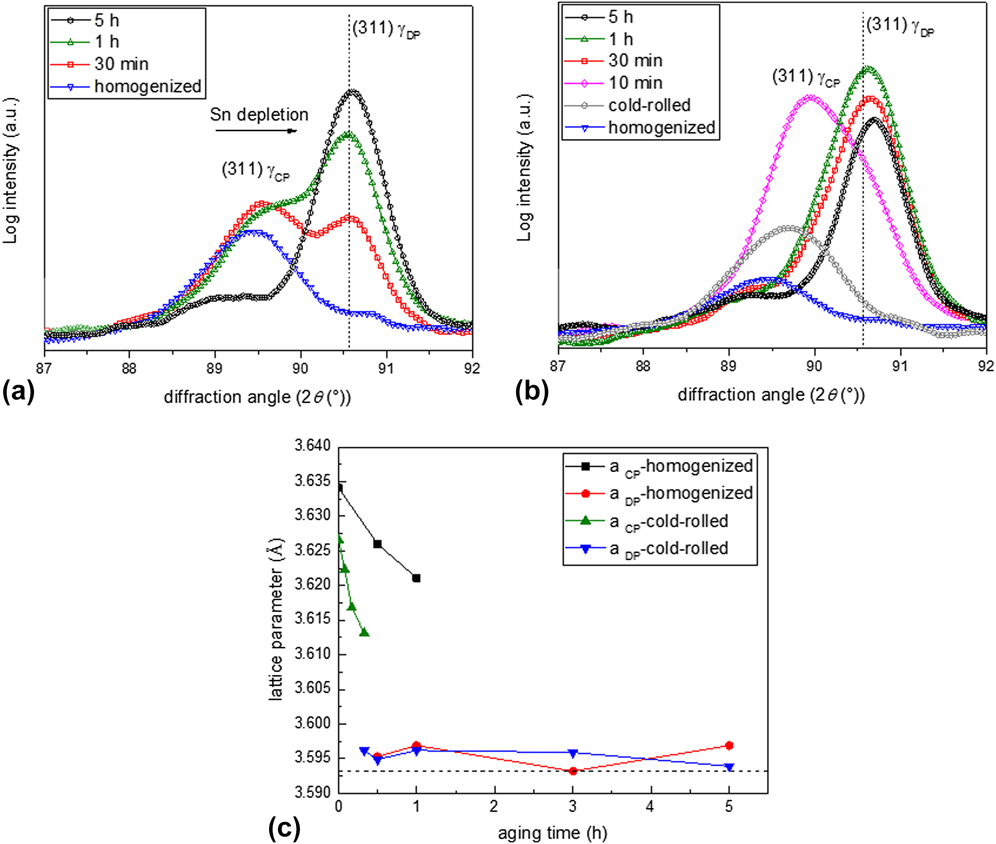
The decrease of the DP RF velocity upon aging treatment before approaching the steady-state condition may be associated with the variation of matrix supersaturation ahead of the DP RF as a function of the aging time. This idea can indirectly be verified by performing the X-ray diffraction analysis on specimens before and after aging. The evolution of position and intensity of (311) reflection of the invar alloy (Fe64Ni36) upon aging have been depicted in Figs. 4(a) and 4(b) for the homogenized and cold-rolled specimens, respectively. Before aging of both specimens, the reflected peak by matrix has shifted toward the lower 2θ angles as compared to the peak position of the pure invar matrix, which is indicated by a vertical line in Figs. 4(a) and 4(b). This could be ascribed to the supersaturation of the austenitic invar matrix with Sn. The high amounts of Sn atoms are only soluble in a pure α-Fe matrix and the solubility of Sn in a pure γ-Fe matrix is limited to 1.7 wt% Sn. Reference Baker48 In invar alloys, due to the presence of a high amount of Ni atoms, the Sn-supersaturated austenitic matrix is also stable (see Fig. 1). The previous investigations have shown the expansion of ferritic matrix by the dissolution of Sn atoms. Reference Pearson49 However, the effect of Sn dissolution on the lattice parameter of the austenitic invar matrix can be determined experimentally from the X-ray patterns shown in Fig. 4 of the current research.
Evolution of the Cu Kα1-311 invar matrix (Fe64Ni36) reflection recorded from (a) homogenized and (b) cold-rolled specimens before aging and for the aging times as indicated in the figure. The Kα1-peak position for the pure invar matrix has been indicated by a vertical line. The peak at the lower 2θ angle is reflected by the supersaturated austenitic matrix in the CP microstructure (γCP), and the peak at the higher 2θ angle is reflected by the less-saturated matrix of the DP microstructure (γDP). Figure (c) shows the extracted lattice parameters of γCP and γDP matrices as a function of the aging time. The lattice parameter of the pure invar matrix has been shown with a horizontal dashed line.
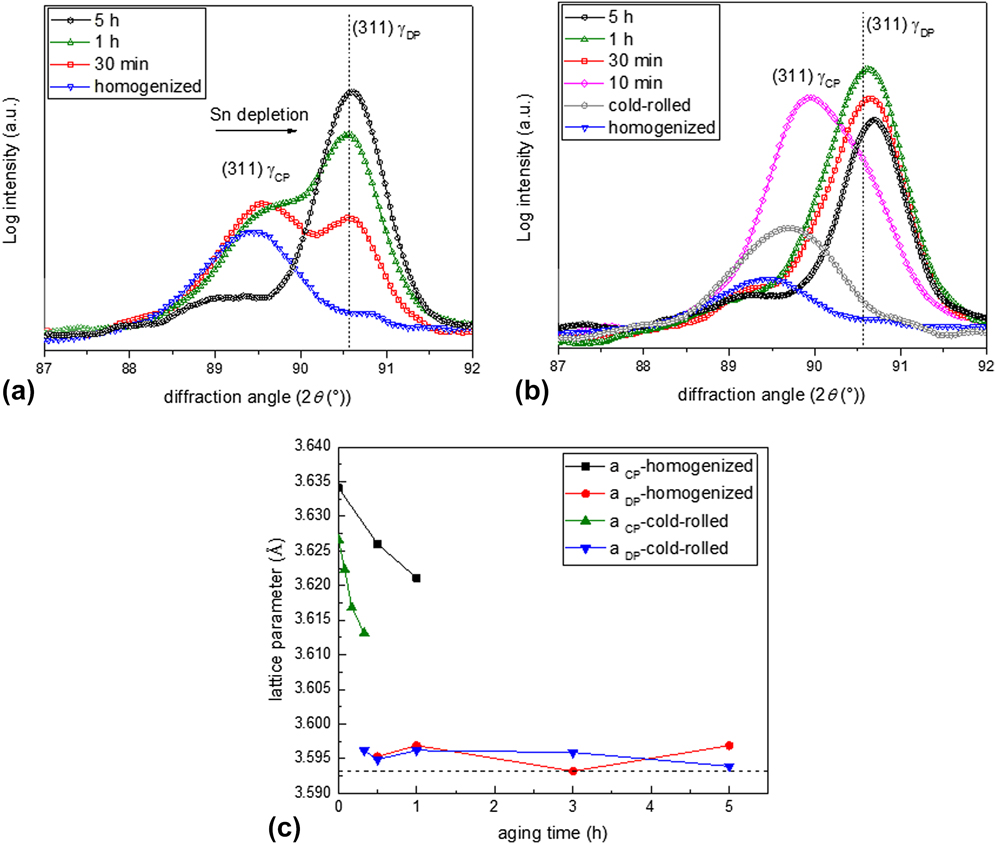
By initiation of the aging treatment, another peak at the position of the pure invar matrix has revealed. This matrix peak splitting is the consequence of contribution of two coexisting matrices in the specimen after aging, namely the Sn-supersaturated matrix in a CP microstructure (γCP) and the less-saturated matrix of the DP microstructure (γDP). The aging treatment is proceeding with a decrease in the relative intensity of the γCP matrix and correspondingly with an increase in the relative intensity of the γDP matrix. The aforementioned observation may suggest that the whole matrix will gradually be transferred to the DP microstructure upon further aging. After prolonged aging, only the reflected peak by γDP is noticeable at the approximate position of the pure invar matrix. For more details about the effect of DP microstructure on the matrix peak splitting during X-ray diffraction analysis see Refs. Reference Kikuchi, Kajihara and Choi34 and Reference Steiner, Akhlaghi, Meka and Mittemeijer50.
To trace the reduction of matrix supersaturation in the CP region, which is the main intent of the current research, the matrix lattice parameters of the supersaturated CP and less-saturated DP regions were extracted from the (311) matrix reflection. The results of the lattice parameter changes as a function of the aging time have been shown in Fig. 4(c) for both the homogenized and cold-rolled specimens. The lattice parameter of the matrix in the CP microstructure (a CP) decreases by increasing the aging time. Such a reduction of the matrix lattice parameter in the CP region has earlier been ascribed to the (i) loss of matrix supersaturation from the solute/diffusing alloying elements Reference Kikuchi, Kajihara and Choi34 and/or (ii) the elastic accommodation of the misfit strain between the coherent second-phase particles and the matrix. Reference Steiner, Akhlaghi, Meka and Mittemeijer50 In the current research, the decreased lattice parameter of the CP matrix can mainly be related to the first explanation. It should be noted that the elastic accommodation of the small volume misfit (approximately 3%) between the austenitic invar matrix and the hexagonal Ni3Sn2 precipitates may have a negligible influence on variation of the matrix peak position upon aging.
The concluded reduction of the Sn content in the supersaturated matrix in the CP region can be originated from two different phenomena: (i) coarsening of the CP particles in the untransformed matrix ahead of the DP RF as mentioned in Refs. Reference Petermann and Hornbogen32 and Reference Hornbogen36 or (ii) development of the diffusion zone in front of RF, where Sn atoms diffuse from the supersaturated matrix into the less-saturated matrix of the DP microstructure and form a higher volume fraction of Ni3Sn2 precipitates within the DP cells as discussed in Refs. Reference Hillert25, Reference Hillert29, Reference Kikuchi, Urabe, Cliff and Lorimer33, and Reference Kikuchi, Kajihara and Choi34. For the case of invar-based Sn alloy, the second explanation is difficult to be argued or proved. First of all, determination of a diffusion zone in front of RF by using the compositional microanalysis methods is impossible due to the presence of the tiny dispersed CP particles in this region (see Sec. III.C.1). In addition, the RF velocity varies by a factor of about 10 during aging as shown in Fig. 3. This small variation of RF velocity may result in a minor change of the Ni3Sn2 volume fraction in the DP cell, which is difficult to be measured. In fact, in this research, the increased Ni3Sn2 volume fraction in the DP cell has not been recognized by XRD analyses or SEM observations. Thus, in the following subsections, the effect of size and volume fraction of the CP particles on the reduction of the matrix supersaturation will be investigated in detail in the homogenized and cold-rolled specimens.
Also, it should be mentioned that the obtained lattice parameters of the less-saturated matrix in the DP microstructure (a DP) in Fig. 4(c) are slightly higher than the lattice parameter of the pure invar and they have remained approximately constant during aging. This may be attributed to the low concentration of remained Sn in this matrix. Further EDS measurements revealed that the composition of Sn in the less-saturated matrix is approximately 1.85 wt%, 1.95 wt%, and 1.90 wt% after aging for 1 h, 3 h, and 5 h, respectively (see also Table II). This suggests that the low concentration of Sn in this matrix is relatively constant as a function of aging time.
Constants used for plotting Fig. 6.

a The average Sn concentrations were experimentally measured using EDS as described in Ref. Reference Ziȩba and Gust57.
b The approx. interlamellar spacing is obtained by averaging several measured values from the SEM images. The small variation of λ as a function of aging time is neglected.
c The thickness of DP RF is assumed as one lattice spacing and the critical nucleus radius is considered as 100 nm similar to the size of CP particles at the early aging stages as shown in Fig. 5(a).
1. Influence of CP development and growth on the reduction of matrix supersaturation in homogenized specimen
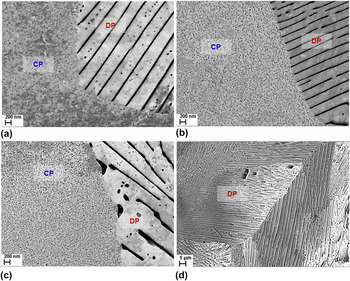
Evolution of the CP precipitates in front of the DP RF was studied for the homogenized specimen by ECCI method. The recorded micrographs shown in Fig. 5 illustrate the microstructure of the aged specimens after different aging times. As observed in Fig. 5(a), the high fraction of tiny precipitates with the size range of 100–150 nm is replaced by the coarser precipitates of ∼500 nm in Fig. 5(b) after aging for 1 h. That implies the occurrence of the continuous coarsening (CC) of these tiny precipitates within this time interval. Upon prolonged aging, the dissolution of these precipitates takes place as shown in Figs. 5(c) and 5(d) in which the coarse precipitates located within the grains and at the grain boundaries have dissolved, respectively. Comparing the above results with the change of velocity of the DP RF (as shown in Fig. 3 for the homogenized specimen), the inconstant growth rate of the DP reaction occurring at the early stages of aging can be explained as a result of the continuous coarsening of precipitates. This influences the total Gibbs energy change of the system (ΔG total) applied for the progress of the DP reaction.
The sequence of CP evolution ahead of DP RF in the homogenized specimen after aging for (a) 30 min, (b) 1 h, (c) 3 h, and (d) 5 h. By increasing the aging time, the CP particles have initially coarsened and then gradually dissolved. The average interlamellar spacing of DP at the interface in specimens after aging for 30 min and 5 h is 280 ± 46 nm and 320 ± 62 nm, respectively.

Next step is allocated to study the effect of precipitate coarsening and the resulted ΔG total variations on the change of the DP RF velocity. There are several concepts offering a mathematical description for the steady-state velocity of the RF in cellular reactions (i.e., pearlite formation, discontinuous precipitation, discontinuous coarsening and etc.). Reference Turnbull17,Reference Zener22–Reference Hillert25 Due to the clear correlation between the ΔG total and RF velocity (V), the proposed model by Petermann and Hornbogen Reference Petermann and Hornbogen32,Reference Hornbogen36 was chosen. This model has been modified for the current case of the nonsteady-state DP reaction occurring during early aging stages of the invar-based Sn alloy in the current research.
The velocity of the DP RF (V) can be related to the driving force for the progress of the DP reaction, ΔG total, using the following equation Reference Petermann and Hornbogen32,Reference Hornbogen36 :
 $$V = - {{8{D_{\rm{b}}}\idelta \Delta {G_{{\rm{total}}}}} \over {{\ilambda ^2}{\rm R}T}}\quad ,$$
where D b is the Sn boundary diffusion coefficient, δ is the DP RF thickness, and λ is the interlamellar spacing between the Ni3Sn2 lamellae in the DP microstructure. R and T are the gas constants and the absolute aging temperature, respectively. The total Gibbs energy change (ΔG total) per mole growth of the DP microstructure can be written as:
 $$\Delta {G_{{\rm{total}}}} = \Delta {G_{{\rm{chem}}}} + \Delta {G_{{\rm{inter}}}} + \Delta {G_{{\rm{strain}}}}\quad ,$$
where ΔG chem is the chemical Gibbs energy change per mole formation of the DP microstructure from the supersaturated matrix in the vicinity of the CP particles, ΔG inter is the Gibbs energy change per mole formation/dissolution of the interface between the Ni3Sn2 precipitates and the matrix, and ΔG strain is the Gibbs energy change due to the elimination of the misfit strain energy between the CP particles and the supersaturated matrix. The ΔG chem for the simple case of binary ideal solution is given by Reference Manna, Pabi and Gust20 :
 $$\Delta {G_{{\rm{chem}}}} = - {\rm R}T\left[ {x_{{\rm{Sn}}}^{{\gamma ^{{\rm{CP}}}}}\ln \left( {{{x_{{\rm{Sn}}}^{{\gamma ^{{\rm{CP}}}}}} \over {x_{{\rm{Sn}}}^{{\gamma ^{{\rm{DP}}}}}}}} \right) + \left( {1 - x_{{\rm{Sn}}}^{{\gamma ^{{\rm{CP}}}}}} \right)\ln \left( {{{1 - x_{{\rm{Sn}}}^{{\gamma ^{{\rm{CP}}}}}} \over {1 - x_{{\rm{Sn}}}^{{\gamma ^{{\rm{DP}}}}}}}} \right)} \right]\quad ,$$
where
 $x_{{\rm{Sn}}}^{{\gamma ^{{\rm{CP}}}}}$
is an average Sn concentration in the supersaturated austenitic matrix in the vicinity of the CP particles, and
 $x_{{\rm{Sn}}}^{{\gamma ^{{\rm{DP}}}}}$
is the Sn concentration in the less-saturated matrix in the vicinity of the DP lamellae. For simplification purposes, the invar-based Sn system has been considered as a Fe–Ni binary matrix and Sn solute; therefore, the separate impact of Ni concentration variations on ΔG
chem has been neglected.
For the current case of invar-based Sn alloy in which the CP precipitates and supersaturated matrix are replaced by the DP microstructure (see Fig. 5), the interfacial Gibbs energy change (ΔG inter) is attributed to: (i) the dissolution of the CP and matrix interface and (ii) the development of the DP and matrix interface. Thus, ΔG inter can be described as Reference Petermann and Hornbogen32,Reference Porter and Easterling51 :
 $$\Delta {G_{{\rm{inter}}}} = + {{2{\gamma _{{\rm{incoh}}}}{V_{{\rm{CP}}}}} \over \ilambda } - {{4{\gamma _{{\rm{coh}}}}{V_{{\rm{CP}}}}\,\,c} \over {{r_{{\rm{CP}}}}}}\quad ,$$
with γincoh as the interface energy between the incoherent discontinuously developed Ni3Sn2 precipitates and matrix and γcoh as the interface energy between the coherent continuously developed Ni3Sn2 precipitates and matrix. Reference Nissan, Komen and Weiss16 The molar volume fraction of Ni3Sn2 precipitates is shown by V CP. Equation (4) has been simplified by assuming the CP precipitate as a spherical particle with the radius of r CP, instead of the needle-type precipitate as depicted in Fig. 2(a). The term c, describing an effective concentration difference between the supersaturated solid-solution and the supersaturated matrix for the progress of the continuous coarsening (CC), can be written as:
 $$c = {{x_{{\rm{Sn}}}^{{\gamma ^{{\rm{SS}}}}} - x_{{\rm{Sn}}}^{{\gamma ^{{\rm{CP}}}}}} \over {x_{{\rm{Sn}}}^{{\gamma ^{{\rm{SS}}}}} - x_{{\rm{Sn}}}^{{\gamma ^{{\rm{DP}}}}}}} = 1 - {{{r_0}} \over {{r_{{\rm{CP}}}}}}\quad ,$$
where
 $x_{{\rm{Sn}}}^{{\gamma ^{{\rm{SS}}}}}$
is the Sn concentration in the supersaturated austenitic solid-solution before aging and r
0 is the radius of the critical nucleus (i.e., r
0 is the required particle radius for the elimination of the compositional difference between the supersaturated solid-solution and the supersaturated matrices
Reference Porter and Easterling51
).
By dissolution of the CP particles and their replacement by the DP microstructure, the reduced misfit strain energy between the coherent continuously developed precipitate (with the bulk modulus of K CP) and the matrix (with the shear modulus of G M) contributes to the energy change of ΔG strain Reference Christian52 :
 $$\Delta {G_{{\rm{strain}}}} = - 6{G_{\rm{M}}}b\ivarepsilon _{{\rm{CP}}}^2{V_{{\rm{CP}}}}\quad ,$$
with
 $$b = {{3{K_{{\rm{CP}}}}} \over {3{K_{{\rm{CP}}}} + 4{G_{\rm{M}}}}}\quad .$$
The linear misfit parameter between the CP particles and matrix, ε CP, can be calculated from r 0 and r CP by using ε CP = r CP/r 0 − 1.
To obtain the change of the total Gibbs energy (ΔG
total) as a function of the CP particle radius (r
CP), the average concentration of Sn in the supersaturated matrix in the vicinity of CP
 $\hbox( {x_{{\rm{Sn}}}^{{\gamma ^{{\rm{CP}}}}}} \hbox)$
is replaced by r
CP via insertion of Eq. (5) into Eq. (3). Afterward, Eqs. (3), (4), and (6) were inserted into Eq. (2). Following the above procedure and using the constants reported in Table II, the change of ΔG as a function of r
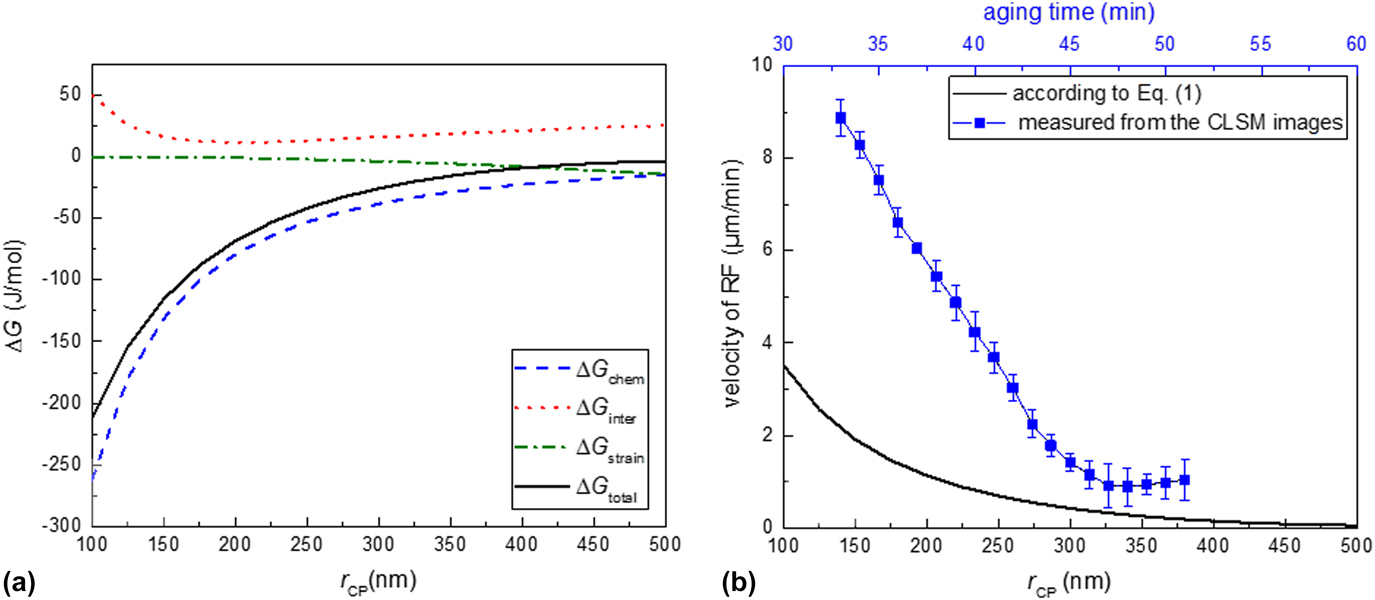
CP has been demonstrated in Fig. 6(a). According to this figure, the total Gibbs energy change (ΔG
total) for the development of the DP microstructure (shown as a solid black curve) increases by increasing the size of the CP particles. This suggests the disinclination of the system for continuing with the DP reaction upon the growth of the CP particles. Two energy components of ΔG
inter and ΔG
strain have a minor effect on the change of the total Gibbs energy: (i) ΔG
inter has a positive value and approaches a minimum at r
CP ≅ 150 nm and subsequently increases by the increase of r
CP (shown as a dashed red curve) and (ii) ΔG
strain decreases gradually by the increase of r
CP (shown as a dashed green curve). The total Gibbs energy has mainly been influenced by change of the chemical Gibbs energy component (ΔG
strain, shown as a dashed blue curve). This component of energy is related to the change of matrix supersaturation surrounding the CP particles.
(a) Change of the total Gibbs energy and the individual Gibbs energy components as a function of CP particle size (r CP) and (b) variation of the RF velocity versus the CP particle size calculated according to Eq. (1) (shown as a solid black curve) and the measured RF velocity versus the aging time (shown as a blue curve).
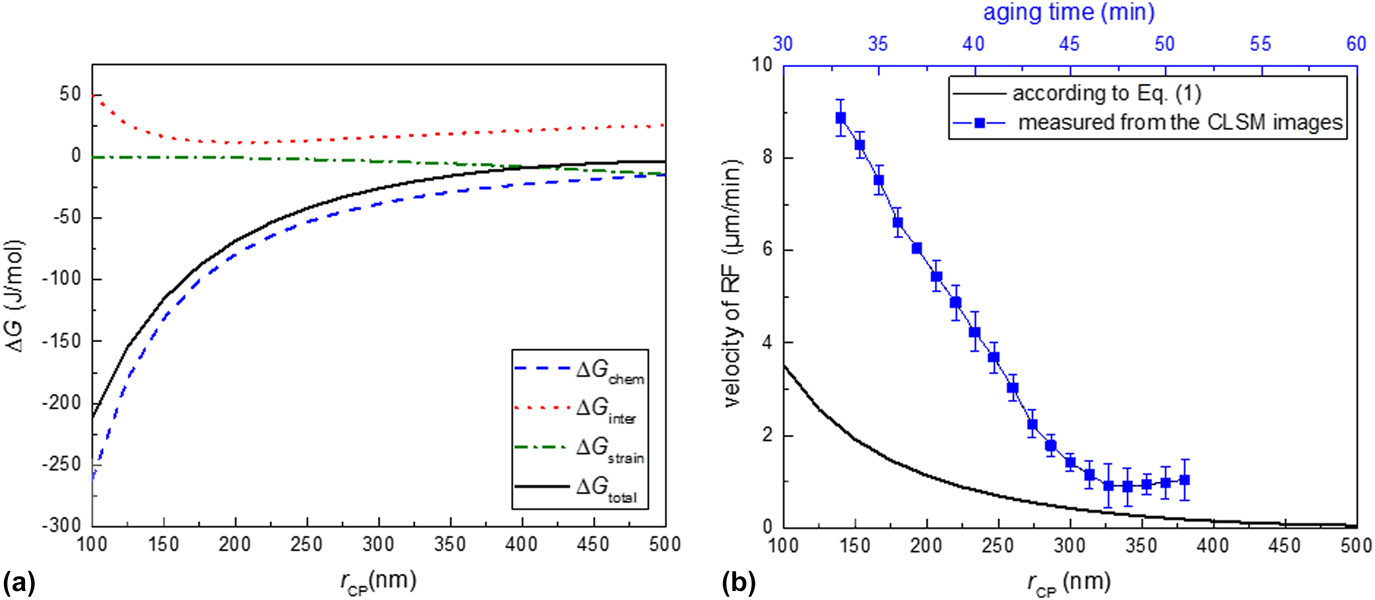
By using the obtained ΔG total from Eq. (2) and the constants shown in Table II, the velocity of the DP RF can be calculated from Eq. (1) as a function of r CP. The calculated result has been shown as a solid black curve in Fig. 6(b). The deceleration of velocity has occurred by the coarsening of the CP particles. To roughly correlate the size of the CP particles to the aging time, it can be assumed that regardless of the CP morphology, a CP particle size of around 100 and 500 nm may, respectively, associate with the aging times of 30 and 60 min [see Figs. 5(a) and 5(b)]. Now, the comparison between the obtained curve according to Eq. (1) and the experimental results measured from the CLSM images [shown in Fig. 3 and also repeated as a blue curve in Fig. 6(b)] can be made. These results suggest that regardless of the difference in absolute velocity values, a compatible trend for the DP velocity changes can be obtained in both cases. The lower velocity values obtained by Eq. (1) as compared to the experimental values can partly be ascribed to the fact that due to unavailability of the boundary diffusion coefficient of Sn in the austenitic Fe matrix, the volume diffusion coefficient of Sn in austenite has been taken for this equation (see Table II).
2. Influence of the increased fraction of CP particles on the reduction of matrix supersaturation in cold-rolled specimen
The ECC images taken from the surface of the cold-rolled specimen, in contrast, reveal an unchanged size of the CP particles through the aging [compare Fig. 7(a) with Figs. 7(b) and 7(c)]. However, the fraction of CP particles has slightly increased after aging for 30 min. This observation is in agreement with the decline of the DP RF velocity at the beginning of the aging treatment as shown in Fig. 3. It is believed that the gradual depletion of the supersaturated matrix from Sn, as a result of the development of new Ni3Sn2 nuclei, is responsible for this decreased DP RF velocity. The gradual formation of the new Ni3Sn2 nuclei may be facilitated on the lattice defects induced through the cold deformation. After prolonged aging, once variation of the CP particles fraction ceases [Figs. 7(b) and 7(c)], the velocity of RF will reach an approx. constant value as depicted in Fig. 3.
The sequence of the CP evolution ahead of the DP RF in the cold-rolled specimen after aging for (a) 10 min, (b) 30 min, and (c) 60 min. By increasing the aging time, the fraction of the CP particles increases. According to part (d), the specimen has been completely covered by the DP microstructure after 3 h of aging. The average interlamellar spacing of DP at the interface in specimens after aging for 30 min and 3 h is 300 ± 48 nm and 320 ± 65 nm, respectively.

Additionally, according to Fig. 7(d), the DP reaction is already completed after 3 h of aging in the cold-rolled specimen, which hints at the elevated kinetics of this reaction. Comparing this result with the progress of the DP reaction in the homogenized specimen, the DP reaction is not completed even after 5 h of aging (compare Fig. 5 with Fig. 7). The constructive or destructive role of cold deformation on the kinetics of the DP reaction has been discussed earlier for several individual case-studies. Reference Manna, Pabi and Gust20,Reference Hornbogen36–Reference Ng, Bettles and Muddle39,Reference Selg, Bischoff, Meka, Schacherl, Waldenmaier and Mittemeijer53 The positivity or negativity of this effect is very specific to the material and the applied heat treatment conditions. For the current case of the aged invar-based Sn alloy, applying the deformation has apparently enhanced the kinetics of the DP reaction (also see Sec. III.D).
D. Matrix transformed fraction upon DP reaction
The previous sections (III.B and III.C) were dedicated to measure and study the velocity of the RF upon progress of the DP reaction in homogenized and cold-rolled specimens. It was shown that the velocity of the RF is slower in the beginning of aging in the cold-rolled specimen compared to that in the homogenized one (see Fig. 3).
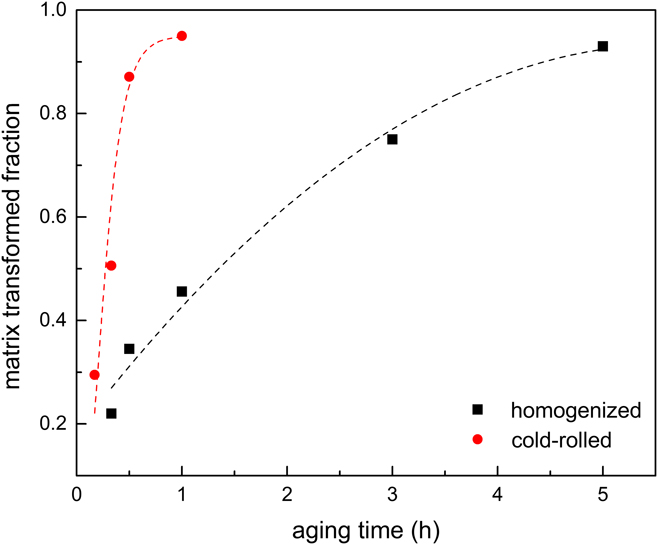
In this section, the transformed fraction of the matrix upon the DP reaction (i.e., the fraction of supersaturated matrix that transforms into the less-saturated matrix) has been measured as a function of aging time in both specimens. The individual volume fractions of γCP and γDP matrices at each aging time were measured from the complete 2θ range of the X-ray diffractogram. For analyzing the XRD patterns, the procedure described in Sec. II.B.2 was accordingly applied. The outcome of this measurement has been plotted as a function of the aging time in Fig. 8. By comparing the variations of the matrix transformed fraction versus aging time in both specimens, a considerably faster progress of the DP reaction in the cold-rolled specimen than in the homogenized specimen can be concluded. A similar conclusion can also be deduced from the ECC images as previously discussed in Sec. III.C.2.
Fraction of the transformed matrix upon the DP reaction as a function of the aging time in the homogenized and cold-rolled specimens. Lines are drawn to assist the eye.
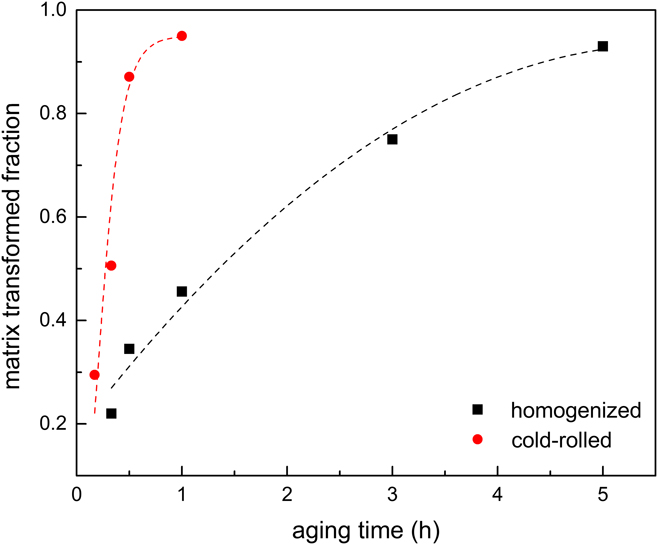
Above observations can be explained as follows: the cold-rolled specimen contains a higher volume fraction of defects which serve as the nucleation sites for the initiation of the DP reaction. Thus, a high number of DP nuclei initiates at the matrix grain boundaries as well as within the grains on the matrix lattice defects. On the other hand, these nucleated colonies of the DP lamellae grow with the low growth rates as evidenced by Fig. 3. In contrast, although the DP lamellae growth rate in the homogenized specimen is slightly higher, the DP nucleation sites in this specimen are limited only to the matrix grain boundaries with an average grain size of 300–500 µm (i.e., heterogonous nucleation sites). Therefore, as suggested by Fig. 8, the faster overall DP transformation kinetics (i.e., nucleation and growth) in the cold-rolled specimen indicates that the lower RF velocity of the DP reaction can entirely be compensated by the higher DP nucleation rate in this specimen.
IV. CONCLUSIONS
-
(1) Supersaturated austenitic solid-solution of invar-based Sn alloy decomposes into the less Sn-saturated matrix, and the Ni3Sn2 precipitates upon aging. This decomposition may take place: (i) continuously by the formation of CP or (ii) discontinuously by the formation of a lamellar microstructure including the discontinuous precipitate (DP).
-
(2) The in situ analyses performed to trace the velocity of DP RF reveals a nonsteady-state behavior in the beginning of aging before approaching a constant velocity within the longer times. This behavior can be attributed to the variation of the matrix supersaturation in front of the DP RF.
-
(3) The concurrent evolution of CP particles in the matrix ahead of the DP RF declines the matrix Sn-supersaturation. This evolution includes the continuous coarsening as well as the gradual nucleation of the CP particles, which affects the total Gibbs energy changes for the formation of the DP microstructure.
-
(4) The original Petermann and Hornbogen model, describing the growth kinetics of DP reaction, was modified for the case of DP reactions with the variable total Gibbs energy changes. The obtained trend by this modified model for the change of RF velocity versus CP particle size is in agreement with the experimental observations.
-
(5) The change of the transformed matrix fraction via DP reaction obtained by XRD shows faster kinetics of the DP reaction in the cold-rolled specimen as compared to that of the homogenized one.
ACKNOWLEDGMENTS
The authors would like to thank I. Grahl for the assistance with sample preparation, G. Franke and P. Neuhold for the performance of heat treatment and casting processes, and Dr. A. Franke for the assistance with the cold-rolling process (all with Institut für Eisen-und Stahltechnologie). We also appreciate the help of Dr. C. Schimpf for performing the XRD measurements (Institut für Werkstoffwissenschaft).