Introduction
Body composition (BC) is a pivotal factor in sports science, offering crucial insights into athletes’ physical condition and performance capacity throughout the season. Monitoring BC is essential to assess the impact of training and nutrition, which is particularly relevant in football, as fluctuations in body weight can occur, affecting performance and recovery(Reference Bunc, Hráský and Skalská1). Additionally, for female athletes, understanding the sex-specific characteristics of BC is crucial, as hormonal fluctuations, menstrual cycle (MC) and metabolic differences play significant role(Reference Smith-Ryan, Cabre and Moore2).
Football is an intermittent team sport where the combination of high- and low-intensity actions required high physiological demands(Reference Majano, Garcia-Unanue and Fernandez-Cuevas3). Therefore, female football players must possess exceptional aerobic capacity, muscular strength and endurance, speed, agility and flexibility(Reference Milanović, Sporiš and James4). Currently, total distance covered is used as an indicator of activity volume; however, intensity-related metrics, such as high-speed running (HSR) and number of sprints, are more relevant(Reference Randell5). These components are associated with BC, as a higher body fat percentage (%BF) will affect HSR and sprinting ability and, consequently, players will cover fewer total distances. Optimal BC, characterised by high lean mass (LM) and low %BF, is therefore crucial for athletic success.
Nutritional intake, particularly carbohydrate (CHO) consumption, plays a central role in modulating BC. CHO is the primary energy source for athletes, as it helps replenish glycogen stores impacting positively on the performance(Reference Kerksick, Wilborn and Roberts6,Reference Pueyo, Llodio and Camara7) . Inadequate CHO availability has been associated with reduced energy availability, hormonal imbalances and impaired performance in female athletes(Reference Randell5,Reference Martinho, Field and Naughton8,Reference Fahrenholtz, Sjodin and Benardot9) . At the same time, hormonal factors, such as testosterone and oestradiol (E2), influence muscle mass, adiposity and metabolic regulation(Reference Van Pelt, Gavin and Kohrt10,Reference Collado-Boira, Balino and Boldo-Roda11) . Understanding how dietary and hormonal variables interact to affect BC in female football players remains limited, given the underrepresentation of women in exercise and nutrition research(Reference Smith-Ryan, Cabre and Moore2).
BC can be evaluated through various techniques. Dual-energy X-ray absorptiometry (DXA) has been considered one of the most accurate methods to detect BC changes during interventions. However, beyond the measurement itself, many factors influence the regulation of BC, such as position on the field, ethnicity, diet, individual physiology, training volume, sex hormones, as well as MC(Reference Collins, Maughan and Gleeson12).
Thus, considering that women in exercise and nutrition research is underrepresented(Reference Smith-Ryan, Cabre and Moore2), this study seeks to address this gap by investigating the factors influencing BC in professional female football players in a longitudinal study throughout a competitive season.
We hypothesised that BC is influenced not solely by nutritional habits but also factors of a different nature. Therefore, the aim of this longitudinal observational study is to investigate the factors influencing BC in professional female football players, providing insights that can help optimise performance and health through personalised nutrition and training strategies.
Material and methods
Study design and participants
The longitudinal observational study involved thirty-eight females football players from the Real Sociedad (San Sebastián) football team, competing in the Spanish first division (Liga F) and second division (Primera Federación Femenina) during the 2023–2024 season. The sample size for this study was determined by the availability of participants. All eligible players from two professional female football teams were included, resulting in a total of thirty-eight participants.
Data on dietary habits, body weight and height, BC, serum hormones, menstruation (LEAF-Q questionnaire), physical activity and training loads were collected in November 2023 and March 2024, covering a total study duration of approximately 5 months. Recruitment and follow-up were conducted by the Health and Performance Unit of the Real Sociedad, in Zubieta, Spain. The inclusion criterion was that players had signed informed consent to participate.
This study was conducted according to the guidelines laid down in the Declaration of Helsinki, and all procedures involving female athletes were approved by the Euskadi Clinical Research Ethics Committee (TUE-RS-2022–01). Written informed consent was obtained from all athletes.
Blood biochemical parameters
Fasting blood biomarkers were measured using standard laboratory assays. Hormonal concentrations were determined using an electrochemiluminescence immunoassay method. The following hormones were considered: adrenocorticotropic hormone, cortisol, dehydroepiandrosterone, oestradiol (E2), follicle-stimulating hormone, luteinising hormone, insulin, progesterone, prolactin, sex hormone binding globulin, thyroid-stimulating hormone, thyroxine (T4), triiodothyronine (T3) and free and total testosterone.
Dual-energy X-ray absorptiometry
Following blood samples collection, DXA was used to measure total and segmental BC (Horizon Wi S/N 306809M). The DXA was calibrated daily in accordance with the manufacturer’s instructions, utilising a standard calibration block, and it was performed by the same certified technician from Policlínica Gipuzkoa. DXA utilises high- and low-energy X-ray photons to scan various body regions, measuring LM, fat mass and bone mineral density, with the attenuation of beams influenced by tissue density and volume(Reference Kasper, Langan-Evans and Hudson13,Reference Sebastiá-Rico, Soriano and Gonzalez-Galvez14) . The scanning process took approximately 7 minutes per participant, and before its completion, the height and weight of female players were measured. Participants arrived at the laboratory after an overnight fast, refraining from vigorous exercise for at least 15 h, and having a standard dinner the night before. During scanning, participants wore lightweight clothing, removed all metal accessories and assumed a supine position on the scanning table. DXA-derived BC variables are expressed as kilograms except the percentage of body fat.
Dietary assessment
Energy, macronutrient and micronutrient intake were assessed by 72 h dietary recall, aligned with match, training and rest days. All recalls were conducted by the same registered dietitian to ensure consistency. Players were familiar with portion sizes as many routinely weigh their food or use household measures, and several followed structured meal plans. Additionally, meals consumed at the club’s training facility were based on standardised menus with known gram weights, which were used to validate reported intakes. Subsequently, the data from the recall questionnaires were analysed using the DIAL software (UCM & Alce Ingeniería S.A.) (V 3.15.1.0) to convert reported food consumption into corresponding energy and nutrient values. Values represent the average of 3 days (training, match and rest). Energy intake is expressed in kcal/d, while macronutrients and micronutrients are reported in g/d.
External training and match loads
Players wore a portable global position system (GPS) device (WIMU PRO, RealTrack Systems) placed on the back. After training session and match, the data were transferred to a computer and analysed using SPRO software V.980. The selected variables were minutes played, distance covered, distance covered at HSR (> 18 km/h), number of sprints, maximum speed (km/h), accelerations and decelerations. The threshold for HSR (> 18 km/h) was based on the predefined settings of the WIMU PRO system, which have been previously applied in studies involving female football players(Reference Casamichana, Barba and Gantois15,Reference Nieto-Acevedo, de la Rubia and Alonso-Pérez-Chao16) . Data were collected from the pre-season, in July, and variables were normalised by dividing by minutes played. These variables include data from matches and training sessions.
Statistical analysis
Normality of data distribution was initially assessed using the Shapiro–Wilk test and further evaluated through graphical methods (histogram, normal Q-Q plot, boxplot and sd from normality plot). Normally distributed variables were reported as means and sd, non-normally distributed variables as median and quartiles and categorical variables as relative frequencies (percentages). Paired Student’s t tests and Wilcoxon signed-rank tests were performed to compare means and medians, respectively, between periods (November 2023 and March 2024). First, pair-wise correlations between hormones and BC, nutritional and GPS data were assessed by Spearman method, as not every variable followed normal distribution. The resulting P values from bivariate correlation tests were corrected by the Benjamini–Hochberg false discovery rate method, with an adjusted significance threshold of P < 0·05, to take into account multiple testing. After that, linear regression models were fitted with DXA-measured BC outcomes (%BF and LM) at the second time point as dependent variables, and serum hormones, MC, nutritional and GPS data from the first point as predictors, since the aim of the work was to understand which factors influence BC. Collinearity among independent variables was measured by the variance inflation factor index. Variables with a variance inflation factor bigger than 5 were initially removed from the model. Then, a backward-step procedure was used to simplify the model removing variables one by one until there is no improvement of the fit in terms of Akaike information criterion. Additionally, an analysis of models’ residuals has been conducted to validate normality and homoscedasticity and to check for outliers through residual plots.
Missing data were handled by case-wise deletion. Only participants with complete data for the variables included in each model were retained in the final regression analyses. Loss to follow-up was minimal. Of the thirty-eight participants initially enrolled, thirty-five completed all required assessments at both sampling points and were included in the final analyses.
All statistical analysis and visualisation were made using R (version 4.3.3). Significance level was fixed at 0·05 and confidence level for intervals at 95 %.
Results
Subject characteristics
A total of thirty-eight professional female football players were initially enrolled in the study. Complete data at both time points (November 2023 and March 2024) were available for thirty-five participants, who were included in the final regression analyses.
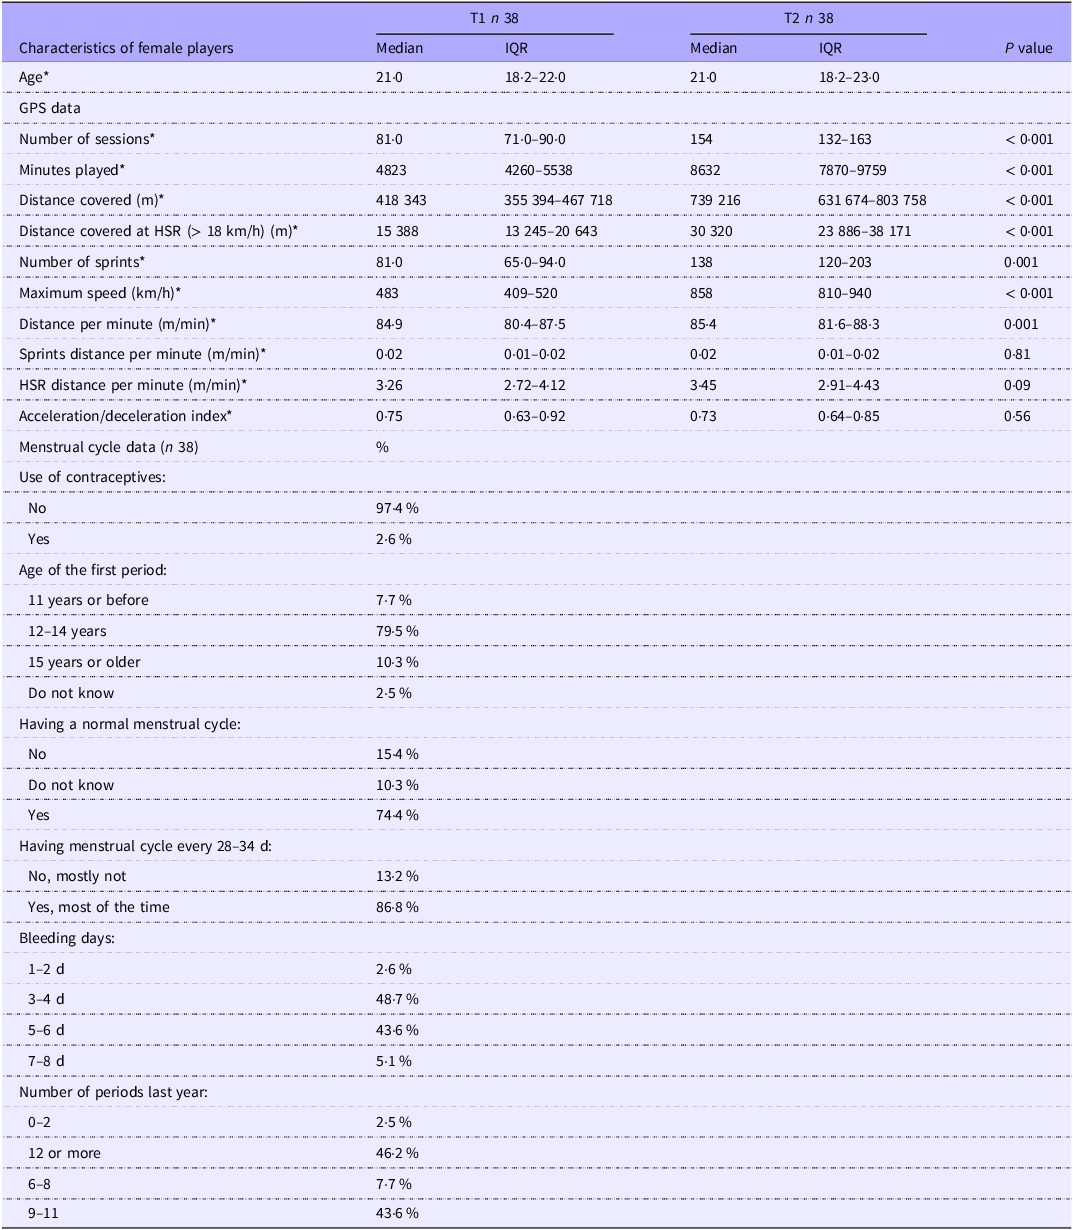
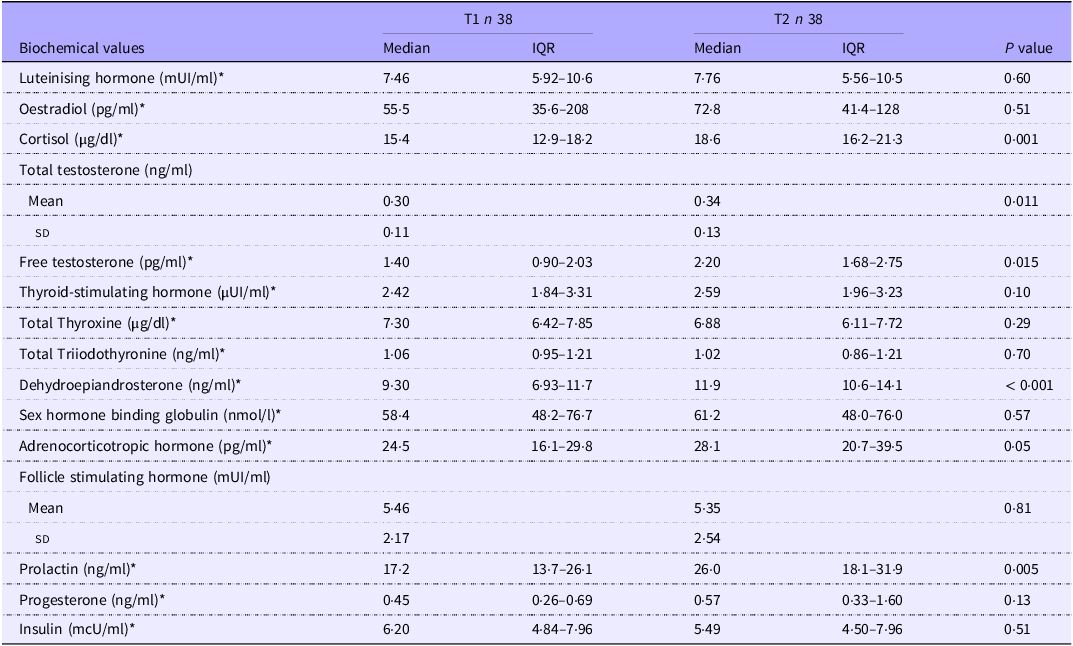
Table 1 shows participant characteristics, including age, MC and GPS data by periods. Serum hormone parameters are summarised in Table 2. All hormone variables are within optimal ranges.
Characteristics of female football players regarding menstrual cycle and GPS data

GPS, global position system; IQR, inter-quartile range; HSR, high-speed running; T1, November 2023; T2, March 2024.
Menstrual cycle data are categorical and are expressed as percentage. This menstrual cycle data are from LEAF-Q questionnaire, only the answers to the questions used in the analysis are present. *Not normally distributed variables.
Serum hormone parameters of female football players

T1, November 2023; T2, March 2024.
Not normally distributed data are expressed as median and (quartiles), while normally distributed data are expressed as mean and (standard deviation). *Not normally distributed variables.
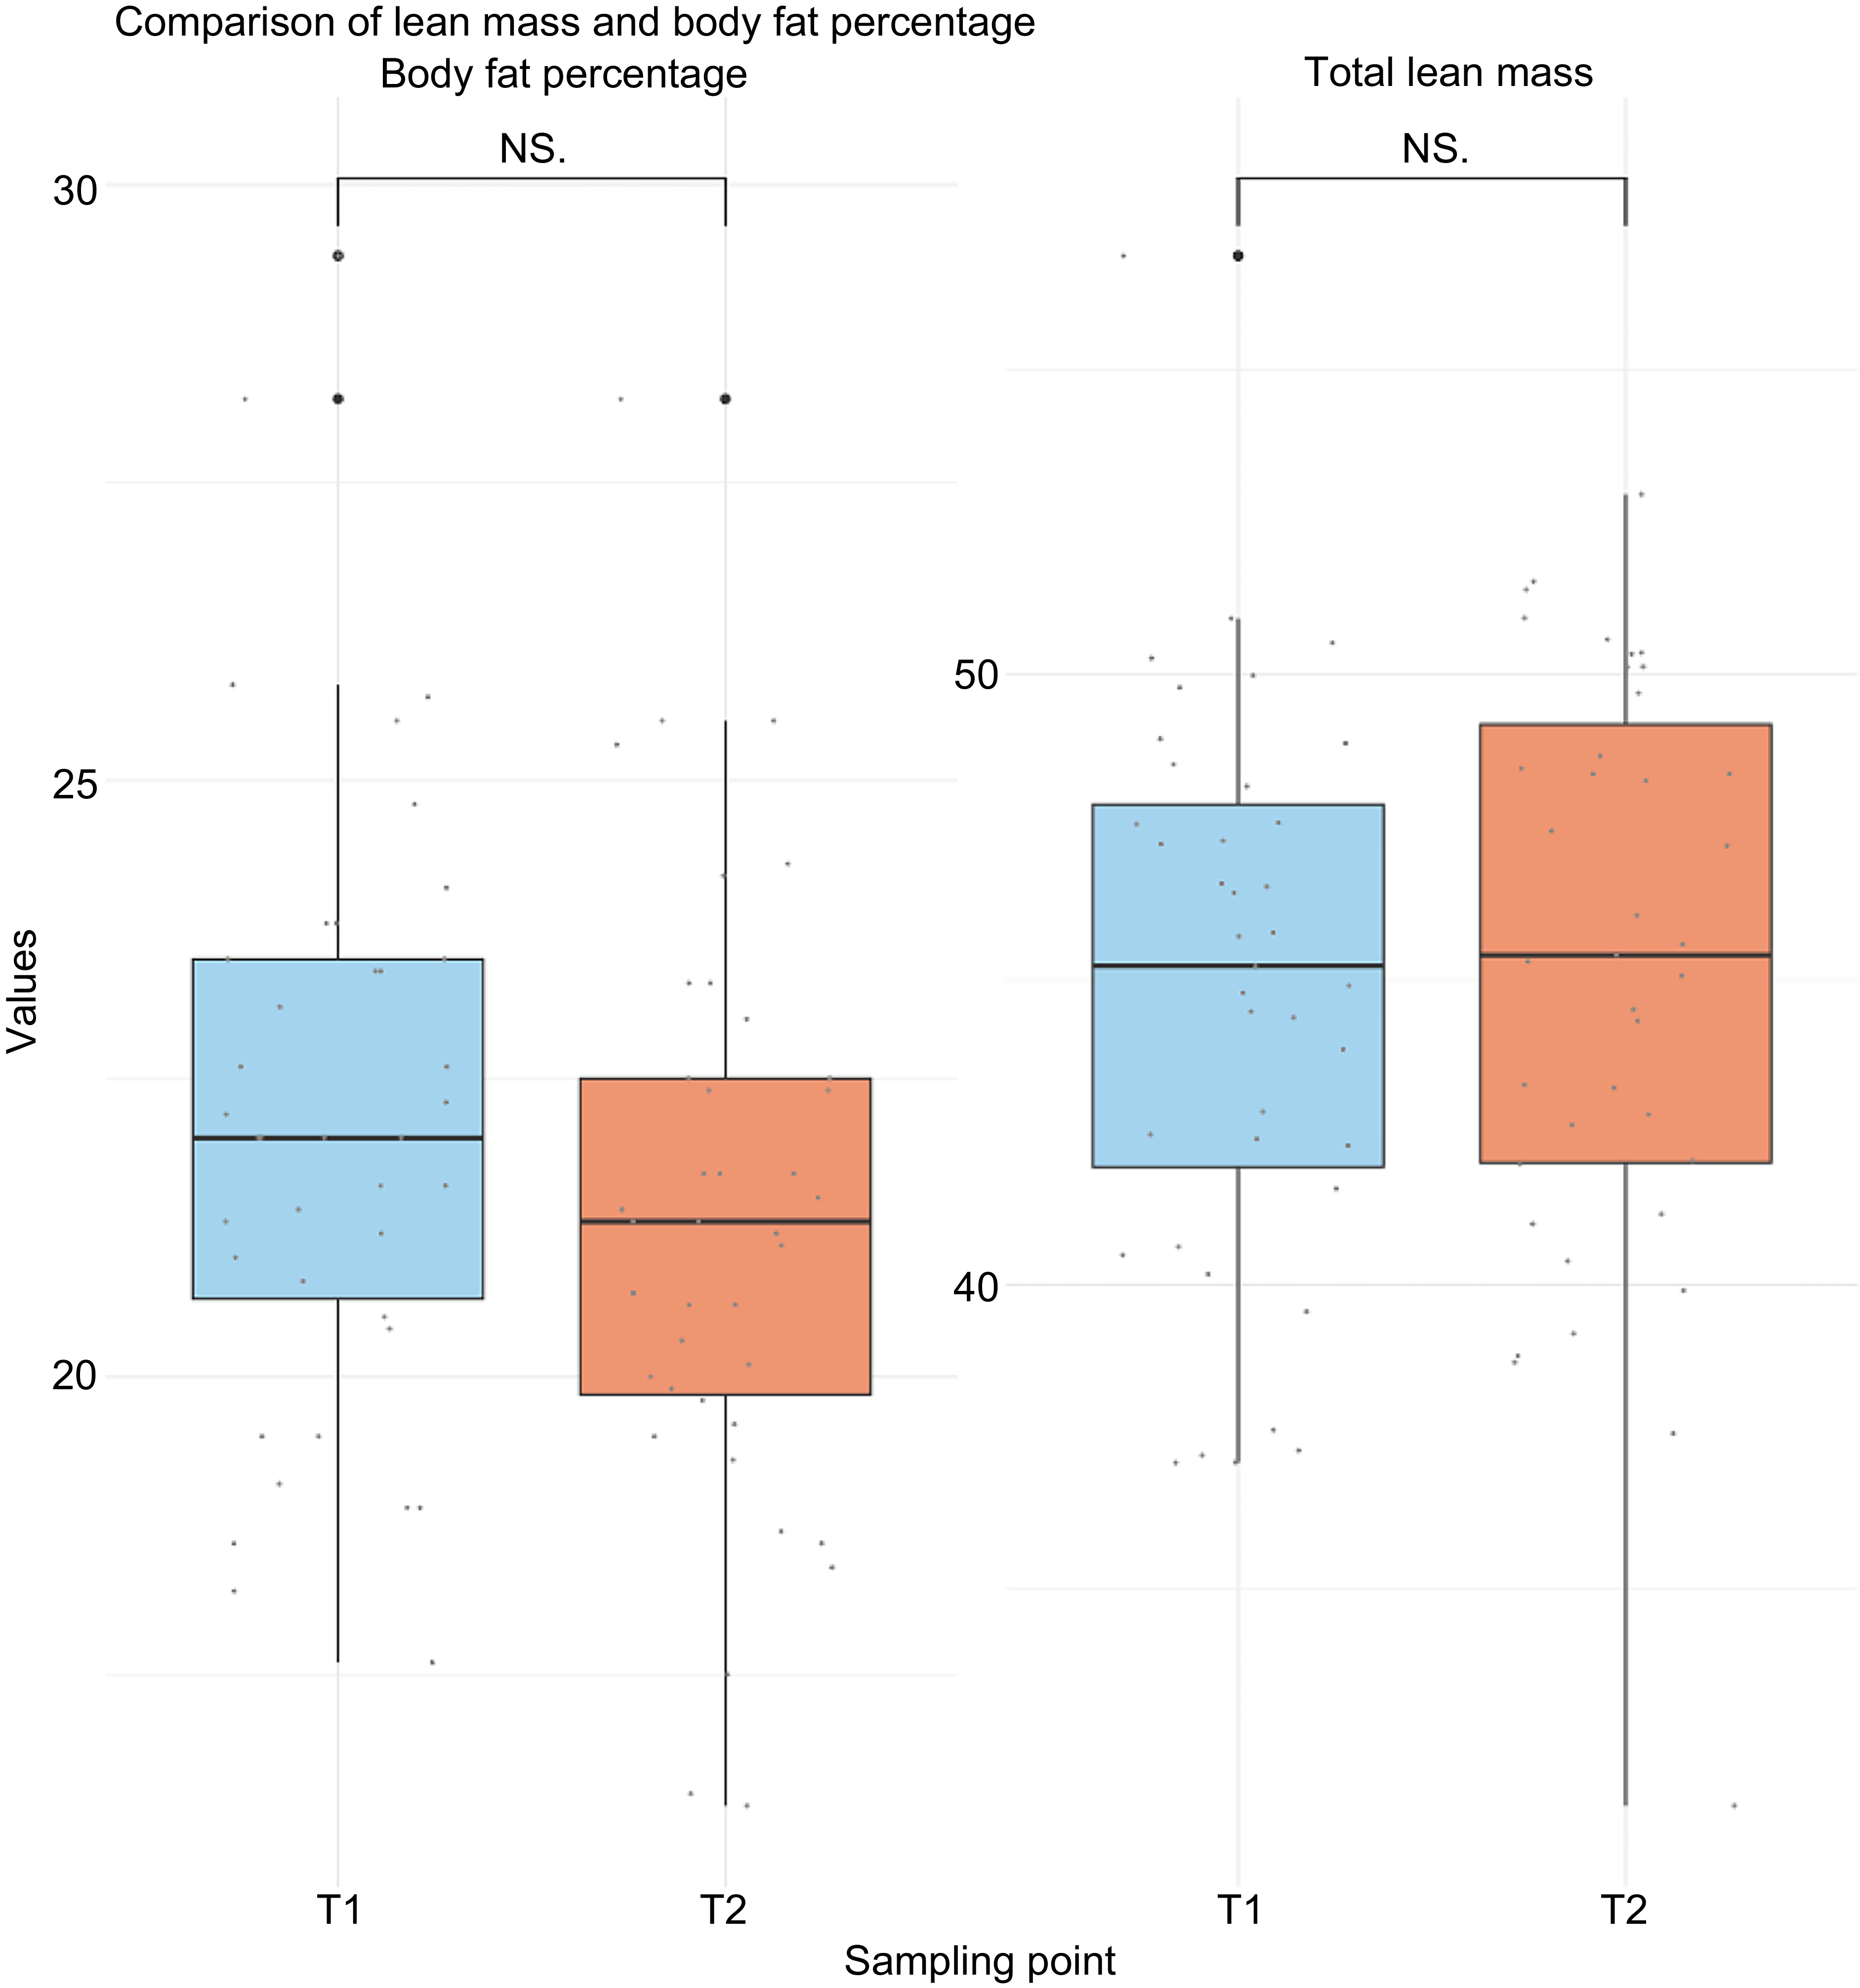
Figure 1 presents the %BF and LM of the female football players. More detailed data are provided in online Supplementary Material 1. The nutritional information in online Supplementary Material 2 provides a summary of the female players eating habits by periods.
Body composition of female football players. Boxplot with dispersion points describing the percentage body fat (on the left) and lean mass (on the right) of female football players. The blue boxplot refers to the first sampling point, November 2023, while the red one to the second sampling point, March 2024. Lean mass is in kg.

Correlations
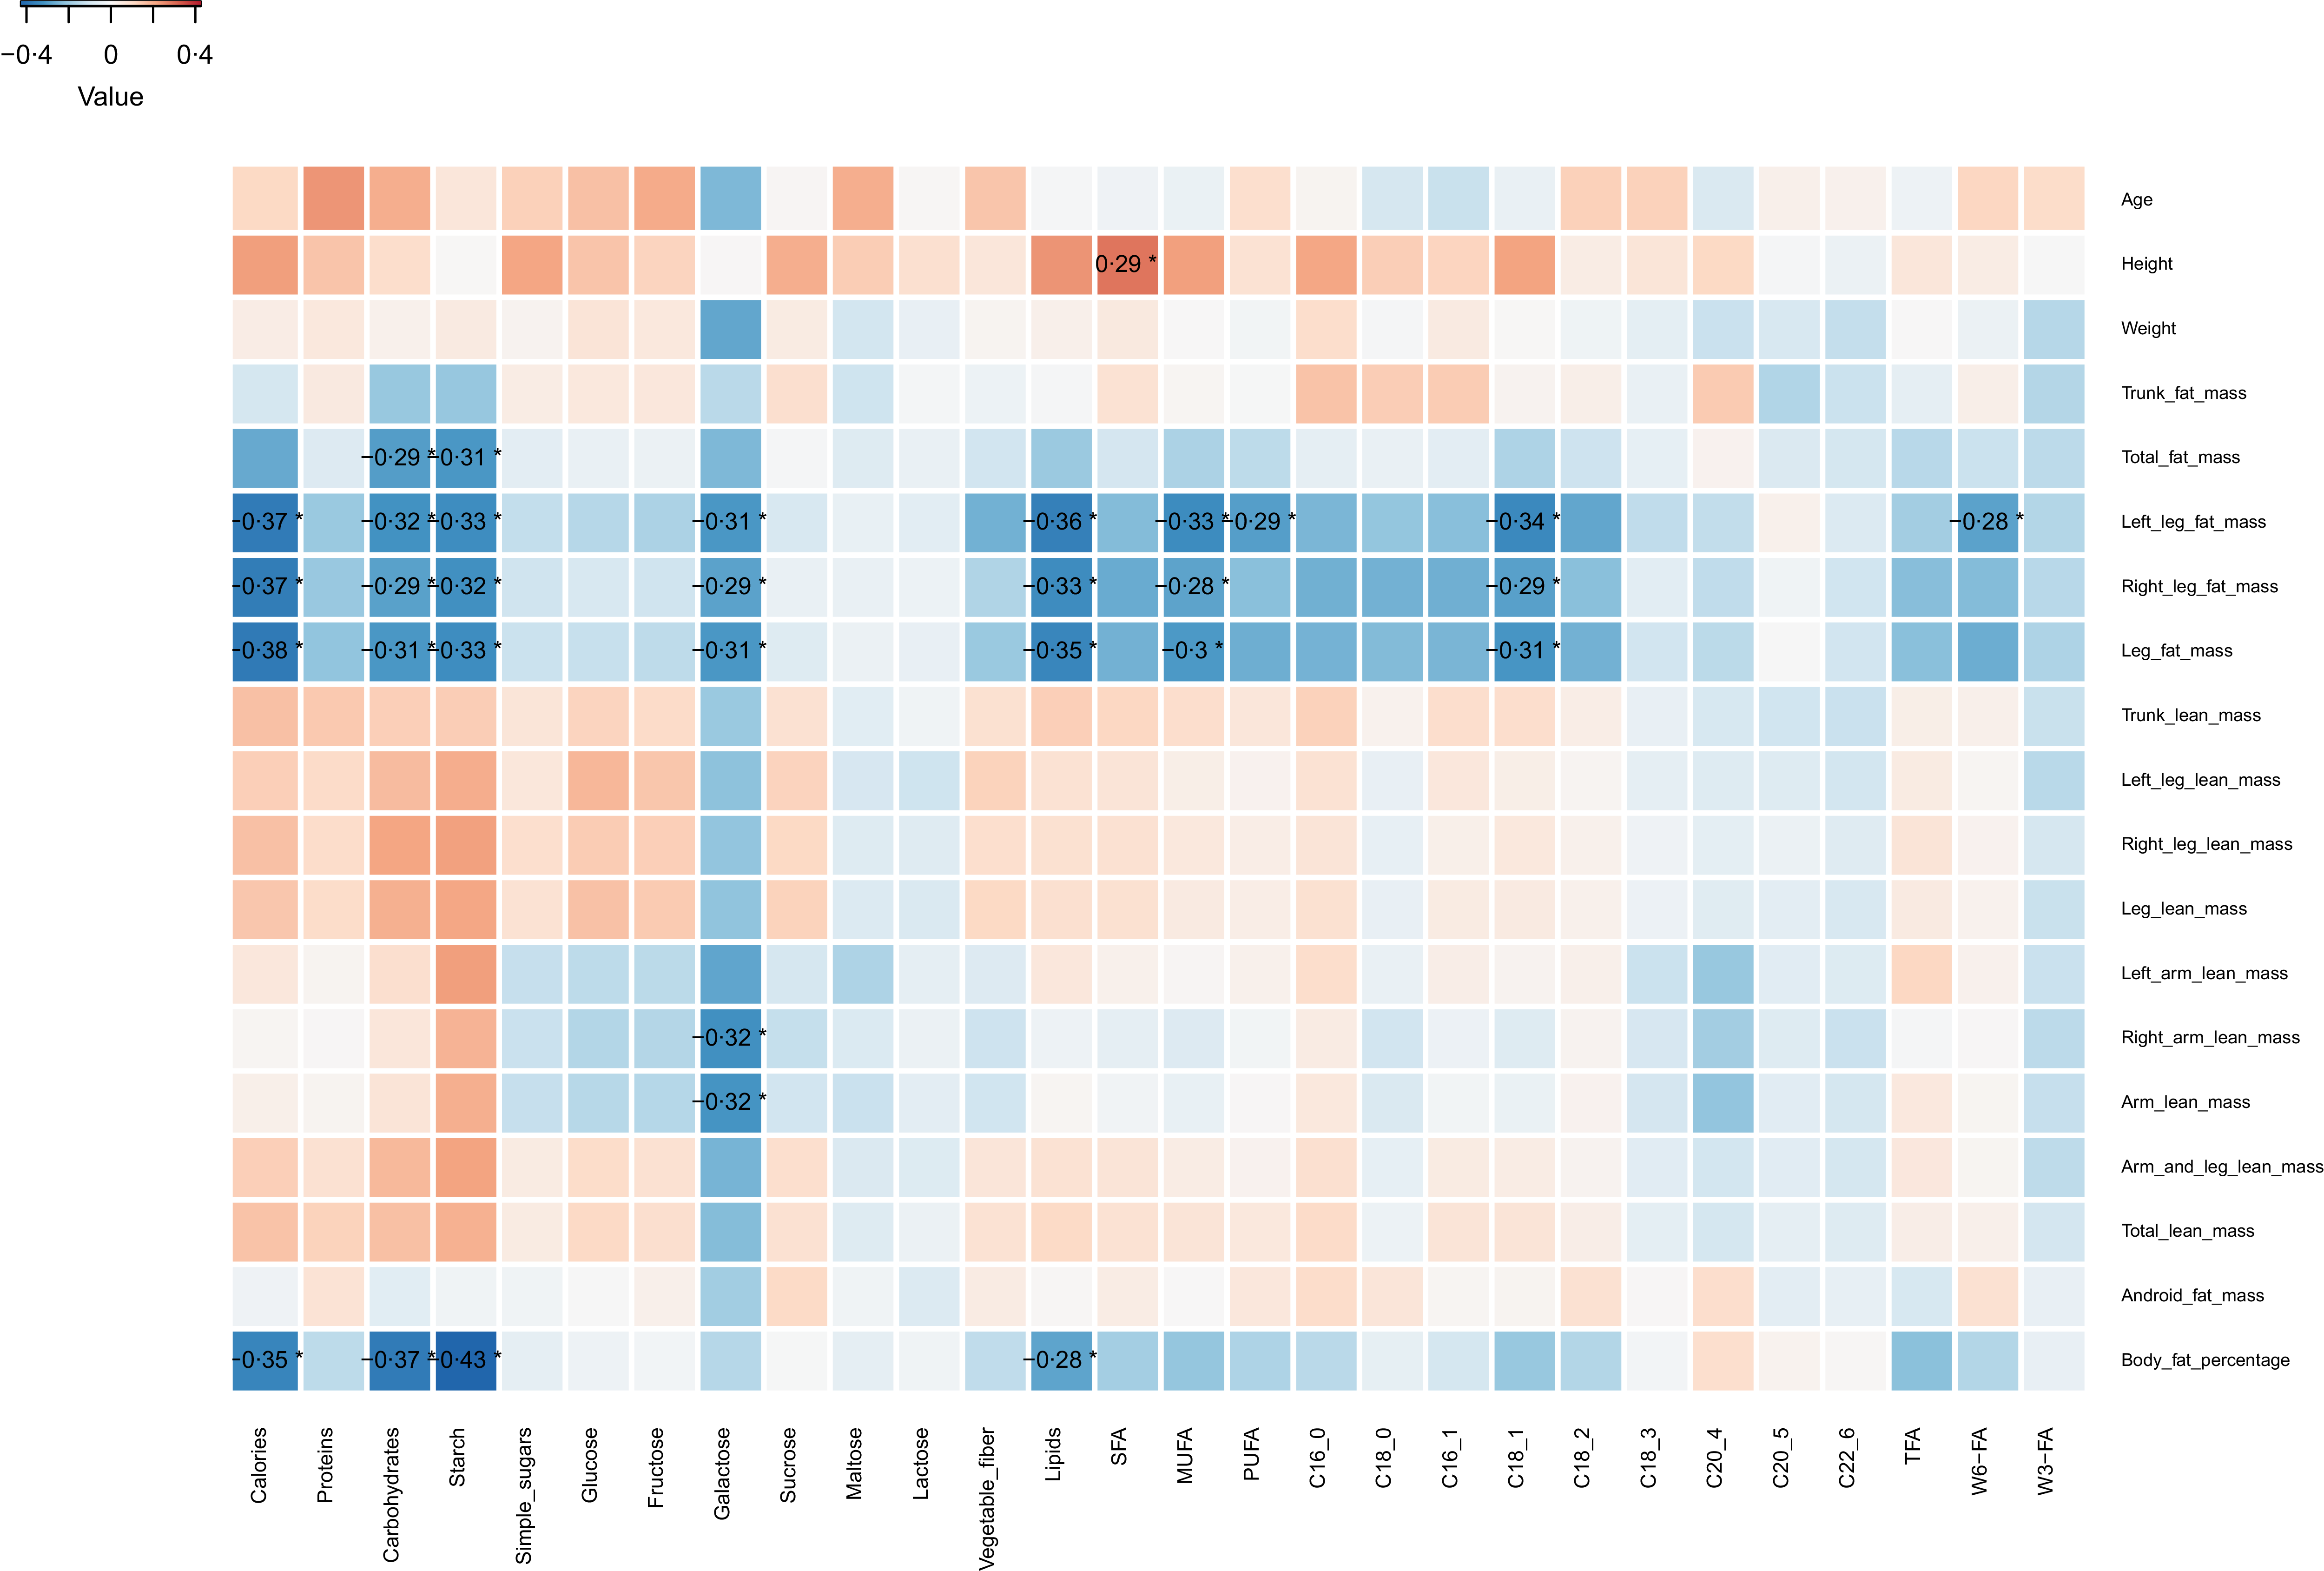
Spearman correlations revealed no significant associations between serum hormones and DXA measurements; however, as shown in Figure 2, negative correlations were observed between DXA measurements and nutritional intake, specifically between calories, CHO, starch and fat and %BF (r = −0·35, P 0·01; r = −0·37, P 0·005; r = −0·43, P 0·001; r = −0·28, P 0·04).
Heat map represents Spearman correlations between DXA measurements and nutritional data in female football players. Blue colour represents a negative correlation and red colour a positive correlation. We apply FDR adjustment to the correlations. When * appears means that correlations are significant P < 0·05 after FDR adjustment. DXA, dual-energy X-ray absorptiometry; FDR, false discovery rate.

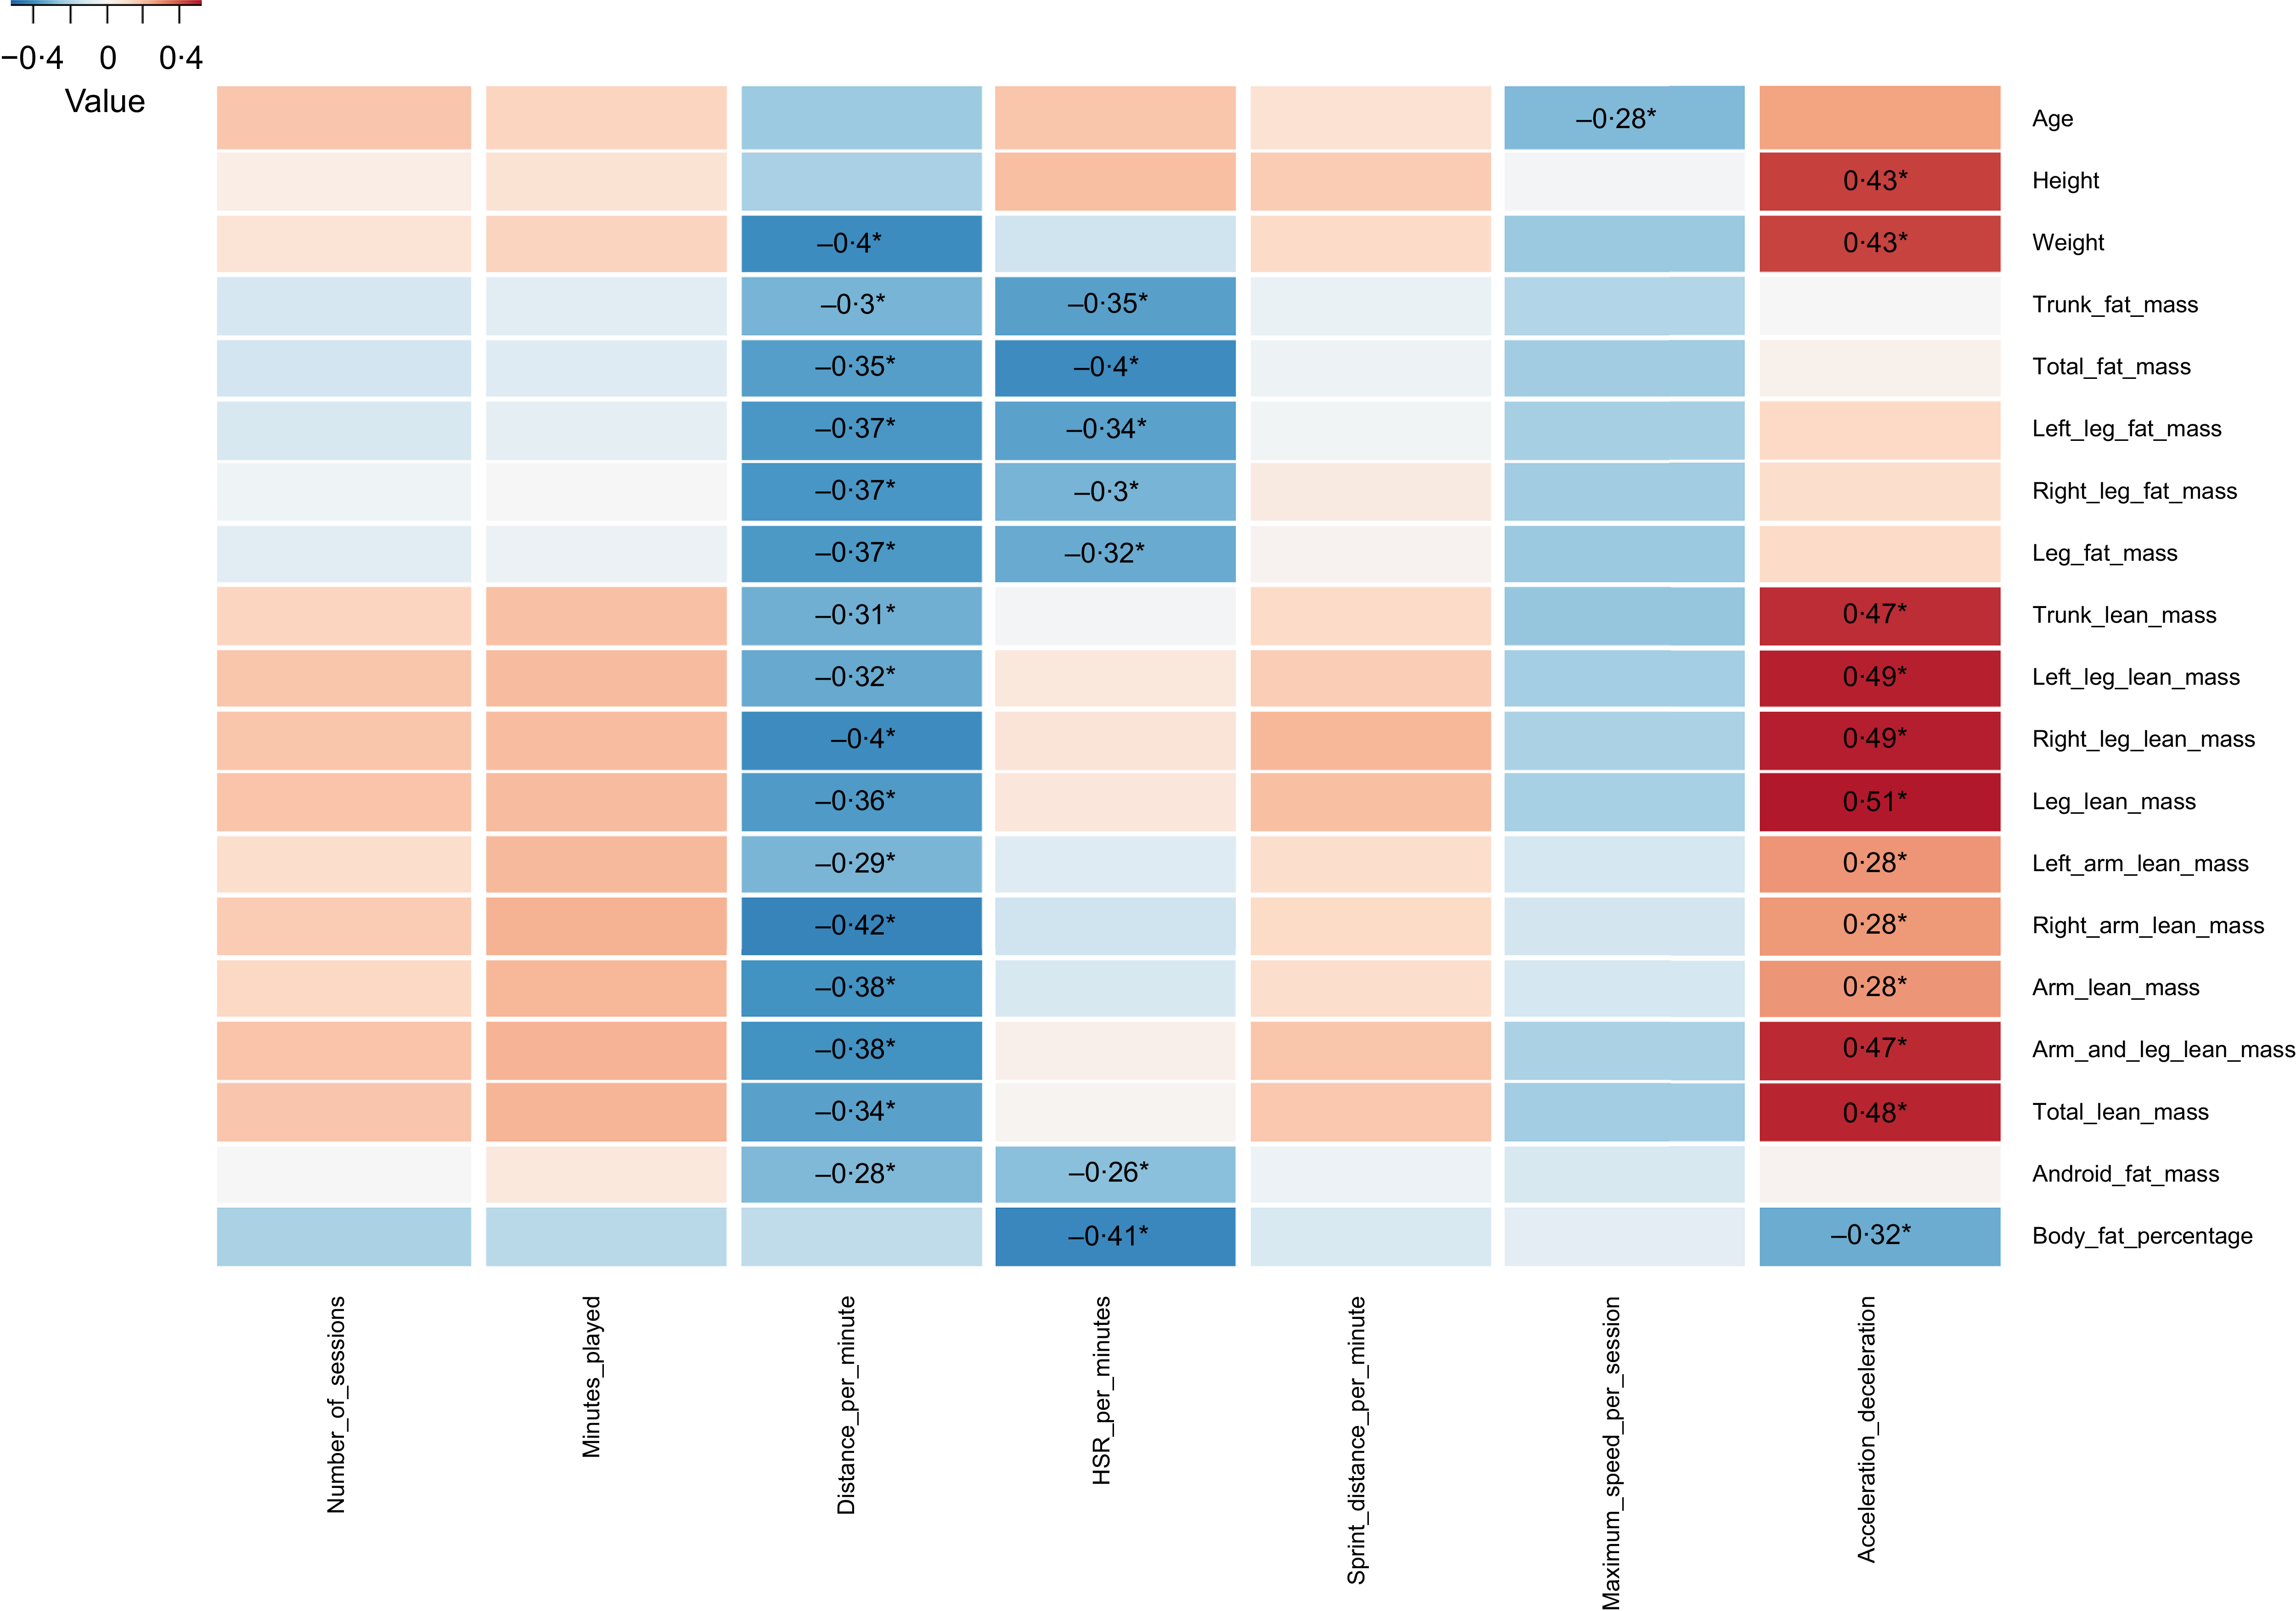
Regarding the correlations with GPS data, no significant correlations have been identified with nutritional data. Nevertheless, Figure 3 highlights both positive and negative associations with DXA measurements.
Heat map represents Spearman correlations between GPS data and DXA measurements in female football players. Blue colour represents a negative correlation and red colour a positive correlation. We apply FDR adjustment to the correlations. When * appears means that correlations are significant P < 0·05 after FDR adjustment. DXA, dual-energy X-ray absorptiometry; FDR, false discovery rate; GPS, global position system.

Linear regression models
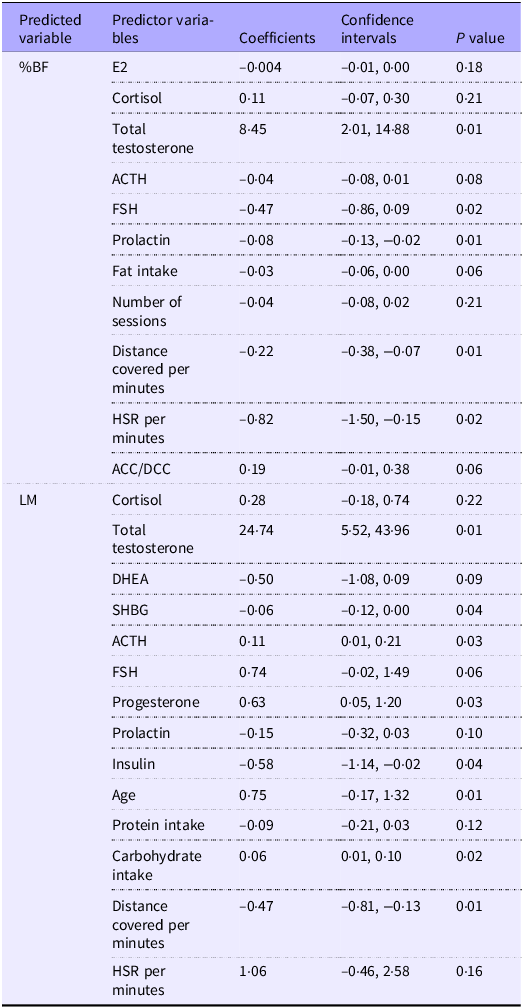
Final linear regression models included information from thirty-five players, as there was some missing data. No continuous variables were categorised in the analysis; all were treated as continuous to preserve statistical power. After removing variables with excess of collinearity (variance inflation factor > 5) and selecting the variables by the backward-step procedure these are shown in Table 3. Luteinising hormone, number of MC per year, total calories and maximum speed variables were removed due to the high collinearity. All models were statistically significant (P < 0·05). In these models, the dependent variables used were %BF and LM of the second measuring point. To predict %BF, the significant independent variables were total testosterone, HSR per minute, follicle-stimulating hormone, distance covered per minute, prolactin and fat intake. For this model, the variable that influenced positively was total testosterone, while the rest had a negative influence on the prediction of %BF. The adjusted R2 was 0·55, and P value of the Shapiro–Wilk test for the analysis of models’ residuals was 0·96. For LM model, the predictor variables were total testosterone, age, progesterone, ACTH, CHO intake, insulin, distance covered per minute and sex hormone binding globulin. The variables with positive coefficient were total testosterone, age, progesterone, ACTH and CHO intake, while the rest of the variables had a negative influence on the LM prediction. The adjusted R2 was 0·47, and P value of the Shapiro–Wilk test for the analysis of models’ residuals was 0·70.
Linear regression models for %BF and LM of female football players

%BF, body fat percentage; LM, lean mass; E2, oestradiol; DHEA, dehidroepiandrosterone; SHBG, sex hormone binding globulin; ACTH, adrenocorticotropic hormone; FSH, follicle-stimulating hormone; ACC/DCC, acceleration deceleration index; HSR, high-speed running.
Multiple R2 0·69 and 0·68; adjusted R2 0·55 and 0·50; P value < 0·001 and 0·01.
For example, a 1 ng/ml increase in total testosterone was associated with an estimated 8·45 % higher body fat and 24·74 kg higher lean mass, illustrating the practical significance of hormonal predictors.
Discussion
This longitudinal observational study presents a novel approach by integrating data on hormones related to the MC, GPS tracking and dietary habits to understand their influence on the BC of professional female football players, measured by DXA. The novelty of this study lies in its focus on a female athlete population and the inclusion of hormone variables, as the representation of women in exercise and nutrition research fields is quite low(Reference Smith-Ryan, Cabre and Moore2). The main findings were that higher testosterone levels were positively associates with %BF and LM, while CHO intake was positively associated with LM. Conversely, high-speed running and distance covered per minute showed negative associations with %BF.
These results support our initial hypothesis that BC in elite female football players is influenced by multiple factors rather than diet alone. Hormonal profiles, nutritional intake and physical performance metrics all showed significant associations with %BF and LM, highlighting the complexity of these interactions.
Body composition
Regarding the BC data, there have been no significant changes from November to March. The data correspond to the anthropometric characteristics of women competing in national leagues worldwide, where the %BF ranges from 14·5 % to 22 % and LM ranges from 42·5 to 49·5 kg(Reference Randell5).
Energy availability and macronutrient intake
The 72-h dietary recalls showed that the average intake was around 2050 kcal/d. This falls below the recommended intake for female football players, whose total energy expenditure ranges from 2400 to 2700 kcal/d(Reference Morehen, Rosimus and Cavanagh17). This, in turn, suggests a negative energy balance, putting players at risk of low energy availability, which can lead to increased injury risk, menstrual dysfunction, bone health deterioration and reduced immune function(Reference Randell5,Reference Martinho, Field and Naughton8) . Therefore, these findings highlight that energy intake below estimated total energy expenditure may be linked to low energy availability, suggesting that strategies to align intake with expenditure could be beneficial. Chronic low energy availability can also alter endocrine and metabolic function, suppress reproductive hormones and impair bone health, contributing to the clinical spectrum of relative energy deficiency in sport(Reference Fahrenholtz, Sjodin and Benardot9,Reference Mountjoy, Sundgot-Borgen and Burke18) .
In terms of macronutrients, we observed that CHO intake was low (online Supplementary Material 2). Although there was a significant increase in March, with an average intake of 3·5 g/kg/d, this amount is still below the recommended 4–8 g CHO/kg/d(Reference Martinho, Field and Naughton8). This observation is common in female players, since similar results were observed in the English Women’s Super League(Reference Moss, Randell and Burgess19) and during an international training camp(Reference Morehen, Rosimus and Cavanagh17). There is evidence of a widespread fear of CHO intake among players, associating them with weight gain, mainly fat(Reference McHaffie, Langan-Evans and Morehen20). Nevertheless, our study highlights a negative correlation between CHO intake and %BF and a positive association in the LM model, emphasising that adequate CHO consumption may be linked to optimal BC. This reflects the need for a sport dietitian who underlines relevance of nutritional education, dietary habits and CHO periodisation strategies to support glycogen availability and performance(Reference Williams and Rollo21,Reference Anderson, Orme and Naughton22) . Furthermore, it is noteworthy that after a match, 80 % of type I fibres and 69 % of type II fibres are nearly depleted of muscle glycogen, underscoring the need to increase CHO intake to sustain physical performance(Reference Krustrup, Mohr and Nybo23).
Beyond CHO, fat intake was negatively associated with %BF model, as well as negative correlation, potentially attributed to the overall caloric restriction and negative energy balance observed among players. Such restriction may be linked to lower fat consumption and potentially slower metabolic rate. This finding aligns with existing literature demonstrating the complex relationship between energy availability and macronutrient intake in athletes(Reference Randell5,Reference Morehen, Rosimus and Cavanagh17,Reference Pilis, Stec and Pilis24) . In energy deficit conditions, female athletes often experience menstrual dysfunction, lower E2 levels, reduced metabolic rate and elevated cortisol levels(Reference Fahrenholtz, Sjodin and Benardot9). It is worth mentioning that although E2 and cortisol were not significant in the %BF model, E2 had a negative association with %BF, while cortisol had a positive influence (Table 3).
Serum hormone influences
In this context, it is important to highlight the complicated role that some hormones play in BC. Follicle-stimulating hormone regulates the MC and reproductive function and promotes oestrogen(Reference Park, Kim and Kim25). Lower follicle-stimulating hormone levels may indicate reduced ovarian activity, leading to decreased E2 production, that is key for BC and bioenergetics(Reference Van Pelt, Gavin and Kohrt10). However, the protection against fat accumulation can be altered in situations of decreased energy expenditure(Reference Van Pelt, Gavin and Kohrt10). Although in the %BF model E2 was not significant, the significance of follicle-stimulating hormone could suggest this relationship. In addition, testosterone exhibited a positive coefficient in the %BF and LM models, with a greater impact on LM model (Table 3). This result suggests the dual role of this hormone. Testosterone is the most potent androgenic anabolic hormone that, even at physiological concentration in women, contributes to protein synthesis, impedes protein degradation and contributes to tissue growth and remodelling, while its elevation further enhances muscle glycogen synthesis, supporting its positive impact on LM(Reference Collado-Boira, Balino and Boldo-Roda11,Reference Mielgo Ayuso, Zourdos and Urdampilleta26) . However, excess of androgen in women have been associated with increase adiposity, potentially through effects on fat distribution and metabolic pathways(Reference Tchernof, Brochu and Maltais-Payette27).This complexity highlights that hormonal influences on BC are not unidirectional. Similarly, progesterone was observed to positively association in LM models, aligning with the results of this research which concludes that progesterone may regulate muscle mass and strength in females(Reference Alexander, Pollock and Lamon28).
Influence of training and match loads
Moreover, the study identified additional factors influencing BC. Physical performance variables, such as GPS-derived distance covered per minute and HSR per minutes, displayed negative coefficients in the %BF model. Additionally, we observed similar correlations, where greater %BF and total fat mass were negatively associated with HSR performance (Figure 3). As HSR is a physiologically highly demanding action, the ability to perform it is crucial in professional play, since it directly impacts sports performance(Reference Krustrup, Mohr and Ellingsgaard29). These findings indicate that higher fat mass may compromise physical performance partly because excess of body fat increases body mass without contributing to force production, thereby reducing the power-to-weight ratio required for sprinting(Reference Milanović, Sporiš and James4). In addition, greater adiposity can lower running efficiency and elevate energy expenditure during high-intensity actions, potentially limiting the ability to reach and sustain HSR(Reference Krustrup, Mohr and Ellingsgaard29,Reference Leão, Camoes and Clemente30) . Conversely, greater muscle mass, which has a more substantial influence on performance, enhances strength and power, supporting the importance of maintaining optimal BC in elite female players(Reference Leão, Camoes and Clemente30).
On the other hand, the LM model showed negative coefficient for distance covered per minute, and the same results were obtained in correlations. This may suggest that an excessive training volume, without adequate recovery, could lead to muscle catabolism, particularly in women. Adapting the training volume to avoid muscle catabolism is crucial, as more is not always better. Overall, these findings highlight the importance of a balanced and personalised approach in training and nutrition to optimise BC and, consequently, sports performance in women’s football.
Study strengths and limitations
This study has several limitations. The relatively small sample size, the inaccuracies in dietary intake assessment since self-administered questionnaires were used, but with dietitian support, which reduces recall bias. Menstrual cycle phase was recorded for all players, but measurements were not standardised to the same phase across participants, which could introduce hormonal variability. Although the design was longitudinal, regression models were based on observational data and cross-sectional associations, limiting causal inference. However, the main strengths lie in its multidimensional approach, combining advanced technologies such as DXA and GPS, as well as hormonal, nutritional and menstrual data with a focus on elite female footballers, a population often underrepresented in research.
This study offers valuable insights into the multifactorial determinants of BC in elite female football players, highlighting the roles of hormonal profiles, nutritional intake and physical performance. The integration of diverse data sources strengthens the robustness of the findings. Although the sample was drawn from a single club, the physiological mechanisms explored are broadly relevant to female athletes in similar high-performance contexts, supporting the extrapolation of these results to wider athletic populations.
Conclusion
This study highlights the multifaceted nature of factors influencing BC outcomes in female football players. It demonstrates that low CHO intake and reduced HSR are associated with higher %BF, while higher levels of testosterone contributed to both LM and adiposity. Thus, personalised and periodised player’s nutrition and training load management are essential for optimising elite-level players’ BC and performance.
Supplementary material
For supplementary material/s referred to in this article, please visit https://doi.org/10.1017/S0007114525106041
Acknowledgements
N.P. thanks the Department of Economic Development and Infrastructures of the Basque Government for receiving a PhD grant for young researchers in the scientific–technological and business environment of the Basque agricultural and food sector, from IKERTALENT program. We would like to express our gratitude to the female football players from Real Sociedad that participated in this study.
This work was partially funded by the Basque Country Government (Department of the Environment, Regional Planning, Agriculture and Fisheries). This work was partially supported by the Department of Environment: Territorial Planning: Agriculture and Fisheries of the Basque Country Government and the Centre for the Development of Industrial Technology (CDTI) of the Spanish Ministry of Science and Innovation under the grant agreement: OPTIPROT project (CER-20231014). This is contribution number 1293 of AZTI.
Conceptualisation: I.T., J.A., N.P. and V.S.; methodology: J.A., N.P., V.S., A.B.M. and M.B.; formal analysis: I.S. and N.P.; data curation: I.S. and N.P.; writing – original draft preparation, N.P. and I.T.; writing – review and editing, N.P., I.T., J.A., I.S. and V.S.; supervision and funding acquisition: I.T. All authors read and agreed to the published version of the manuscript.
No potential conflict of interest was reported by the authors.
The data that support the findings of this study are available from the corresponding author upon reasonable request.