


Despite its fundamental relevance to the functioning of democracy, surprisingly little is known about optimizing requirements for voter registration in order to facilitate genuine electoral participation while preventing electoral fraud. On one hand, stricter rules discourage people from registering to vote (e.g., Campbell et al. Reference Campbell, Converse, Miller and Stokes1960, 276–86; Rosenstone and Hansen Reference Rosenstone and Mark Hansen1993, 196–209; Wolfinger and Rosenstone Reference Wolfinger and Rosenstone1980, chap. 4). On the other hand, weak registration requirements promote electoral fraud and allow even noneligible voters (e.g., nonresident voters) to register to vote illegally. In the first place, voter registration was introduced mainly to address this concern (Campbell Reference Campbell2005). This tradeoff has long been a target of not only academic but also partisan debates in the United States (Campbell Reference Campbell2005, 284; Minnite Reference Minnite2010; Piven and Cloward Reference Piven and Cloward2000).
It is difficult, however, to “devise registration systems that would control fraud without shrinking the size of the active electorate” (Converse Reference Converse, Campbell and Converse1972, 298). This is principally because it is hard to estimate, much less observe, fraudulent behavior, even when we have detailed turnout statistics. For obvious reasons, those who engage in fraudulent behavior attempt—and often manage—to conceal their activity. Certainly, the existing literature of electoral fraud makes much use of qualitative sources. They include cases citizens have brought to the judiciary (Minnite Reference Minnite2010), election disputes parties have filed in the legislature (in order to nullify electoral results) (Lehoucq and Molina Reference Lehoucq and Molina2002), international election observation reports (Birch Reference Birch2007), mass media reports (Cox and Kousser Reference Cox and Morgan Kousser1981; Nyblade and Reed Reference Nyblade and Reed2008), and archival materials (Campbell Reference Campbell2005). These anecdotal sources are often insightful, but not immune to underreporting the overall scale of electoral fraud because of the covert nature of fraud, or overreporting because of the partisanship of those who produce the original materials (Minnite Reference Minnite2010). In short, as Alvarez, Hall, and Hyde (Reference Alvarez, Hall and Hyde2008, 3) lament, to date there has been “little systematic research on how election fraud can be detected and deterred.”
This article addresses this lacuna, by examining fraudulent electoral registration and detecting it statistically using the case of Japan. In this country, citizens who change their residential addresses must register them at a municipality office within two weeks.Footnote 1 Voting-age adults are automatically registered to vote in the municipality without an additional voter registration process, as long as their residence remains registered there for at least three consecutive months before the announcement of elections.Footnote 2 Some voters change their registered addresses before the election for the purpose of voting, and we call this behavior “preelectoral residential registration.” In many cases, candidates and their supporters reportedly ask voters outside a district to change their registered addresses to the district and to vote for the candidates. Given an automatic electoral registration process and relatively simple requirements for residential registration, which we explain further later, most of these “relocaters” allegedly transfer their registered addresses on paper without changing their actual residences, in which case their behavior is illegal.Footnote 3 Because this activity is inherently covert, it is difficult to know how commonly people are engaged in it and whether it is an important factor shaping election outcomes.
We make statistical inferences about this electoral behavior by taking advantage of a natural experimental setting. In a nutshell, we argue, whether or not a municipal election was held in April 2003 can be regarded as an “as-if” randomly assigned treatment, for reasons explained shortly. If this assumption holds, we can reasonably attribute a difference between the increase in “relocated” residential registration in treatment municipalities (with an election) and the increase in control municipalities (without an election) only to the effect of having an election on preelectoral residential registration. The effects estimated by differences-in-differences models are significant and, when the election is competitive, decisive enough to change the electoral results.
This study seeks to make a substantive and methodological contribution to the broader literature. First, we statistically detect preelectoral residential registration, which is a variant of a classic kind of electoral fraud, “voting from nonresidential addresses” (Minnite Reference Minnite2010, 49, 53; see also Campbell Reference Campbell2005, 6) by “ghost voters” (Campbell Reference Campbell2005, 195; Hyde Reference Hyde, Alvarez, Hall and Hyde2008, 206, 214) or “phantom voters” (Campbell Reference Campbell2005, 124, 195, 283). As we explore in the next section, the practice was and is common across many countries in Africa, the Americas, the Asia–Pacific region, and Europe. No one, however, has ever estimated how many people are engaged in it. To our knowledge, this article provides robust inference of such fraudulent behavior for the first time. This is an essential step in an inquiry into the optimal requirements for electoral registration.
Second, we add “electoral timing as treatment” to the toolkit of political science by demonstrating its usefulness. When an election is approaching, parties and candidates are more inclined to do everything they can do, either legally or illegally. One problem with examining such “electoral connection[s]” (Mayhew Reference Mayhew1974) is that we cannot manipulate the occurrence of elections. If we find a variation in election timing across geographical units, however, it is possible to estimate the treatment effects of an election per se on a range of outcome variables, by comparing treatment units (with an election) and control units (without an election). In the concluding section, we will present the contexts, other than Japanese municipality elections, in which electoral timing as a treatment variable can be exploited.
The organization of the article is as follows. The next section summarizes newspaper reports on preelectoral residential registration in Japan and argues that the highly competitive nature of Japanese local elections motivates candidates to engage in it. We also explore similar examples of voting from nonresidential addresses in many other countries. After reviewing statistical methods used in existing studies to detect electoral fraud, the third section elaborates on our natural experimental design and derives two hypotheses. The following section specifies differences-in-differences models, clarifies our predictions, and describes the data. After showing and discussing the estimated results in the subsequent two sections, we conclude by summarizing our findings and discussing alternative setups where “election timing as treatment” might be applied.
PREELECTORAL RESIDENTIAL REGISTRATION
To repeat, we define preelectoral residential registration as a change of registered address from one municipality to another before an election for the purpose of voting. In this section, we begin by summarizing patterns of this behavior, based on reports found in newspapers. Second, we highlight an important institutional factor underlying such behavior: the extremely competitive nature of municipal elections. Finally, we call attention to the fact that preelectoral residential registration is by no means specific to Japan but commonly found elsewhere.
Patterns of Preelectoral Residential Registration
In Japan, preelectoral residential registration has been periodically mentioned in the legislature (the Diet),Footnote 4 as well as investigated as a form of electoral fraud.Footnote 5 Most cases investigated are concerned with subnational (in particular, municipality-level) elections of both mayors and assembly members. For example, in 2003, police sent a total of 99 cases (136 people) to prosecutors—51 cases (66 people) in municipal elections, 28 cases (43 people) in prefectural elections, and 20 cases (27 people) in national elections—on suspicion of illegal residential registration and related crimes (Sômushô Jichigyôsei Kyoku Senkyo Bu 2003, 418; Keisatsuchô Reference Keisatsuchô2003, Table 59).Footnote 6
Searching one of the major newspapers, Asahi Shimbun, between 1985 and 2009,Footnote 7 for the two key expressions, kakû ten'nyu (false moving in) and sagi tôroku (false registration), we identified 48 reported cases of illegal preelectoral residential registration.Footnote 8 These cases range from Hokkaido prefecture in the far northeast of Japan to Okinawa prefecture in the far southwest, from rural villages to urban areas in Tokyo, and from socialists to conservatives., In what follows, we summarize these reports and explain what is known about illegal preelectoral residential registration – who, what, where, when, why, and how.
Who mobilizes voters in other municipalities and who actually changes their residential registration when asked to do so? For candidates and core supporters, first contacts are, not surprisingly, families (in particular, children) and relatives. In many cases, these people used to be actual residents but left the town or village for education and employment. Because they come back from time to time, for example, on New Year's Day, they are most prone to be mobilized. Candidates’ friends or even mere acquaintances are also likely to be targeted. Furthermore, employees, partners, and clients of companies which candidates (or core supporters) control are vulnerable to candidates’ pressure to change their residential registration. In not a few cases, even gangsters are ordered to do so by their gang bosses.
To which addresses do they change their registration? Typically used addresses (only for the purpose of registration) include candidates’ (or their core supporters’) homes, the electoral campaign headquarters, and offices or housing provided for employees of companies controlled by candidates (or their core supporters). It is common that candidates select a specific address for the purpose of preelectoral residential registration, with more than a dozen people with different family names appearing to have moved from different places to live in the same house. In an extreme case, at least 202 people registered their residence as a small house of only about 240 square meters.Footnote 9
How is this type of electoral fraud feasible? It is the simplicity of the registration process that makes it so: Japanese people can easily change their registered addresses by submitting a simple form without presenting evidence of actual relocation (e.g., water and electricity bills). Moreover, anyone can be a proxy for people “registering” before an election, and can do paperwork on their behalf. In one case, an agent changed the addresses of 128 people in a day.Footnote 10 It is important to note that candidates can monitor whether those who are asked to engage in preelectoral residential registration did, indeed, do so because lists of eligible voters for specific elections are publicly available.
How do those “relocaters” then vote? Do they actually cast their own ballots? Based on the residence registry, the electoral commission office of a corresponding municipality mails the correct number of voting tickets (i.e., tickets to the polling stations) for all voters at a particular address. On behalf of allegedly “new” voters, actual residents may pass the tickets to other supporters in the municipality who may illegally cast more than one ballot by impersonating.Footnote 11Alternatively, those who are mobilized but still live in other municipalities may travel to the district, receive tickets from someone actually residing in the “moved-in” address, and utilize early voting or vote on Election Day.Footnote 12
When does preelectoral residential registration commonly take place? In many cases, “relocaters” change their addresses just before the deadline of eligibility, three months before the election. (We will explain the timing of preelectoral residential registration more in detail in a later section.) Usually, after the election, they move their residential registration back to where they actually live.Footnote 13
Politicians and government officials might argue that these cases are exceptions, but numerous newspaper reports imply that illegal preelectoral residential registration is common in some communities and, therefore, an open secret: Residents have no sense of guilt in the first place and public officials—who process paperwork and send multiple (even numerous) voting tickets to a single address—pretend not to know about (or, rather, are sometimes complicit in) illegal residential registration. An intriguing and extreme example is a case in the town of Torahime, Shiga prefecture. In August 1981, four months before the assembly election, as many as 412 people—10% of its population or 20 times as many as the average number of monthly newcomers—brought their addresses to this small town. After the case was remanded by the Supreme Court, the Osaka High Court declared this election void in April 1985 and criticized the election committee of the town for not suspecting illegal preelectoral residential registration and not investigating the veracity of residential registration.Footnote 14
Close Competition in Municipal Elections
There remains an important question: Why do candidates, particularly those in municipal elections, promote this type of electoral fraud? The literature points out that the higher the level of political competitiveness, the more likely it is that politicians will engage in electoral fraud. For example, Birch (Reference Birch2007) writes, “[c]andidates in marginal positions are most likely to benefit from electoral malpractice, for their expected gain is highest in relation to their expected loss in terms of potential damage to reputation” (1538–39).Footnote 15 Because a small number of votes may change the outcome of an election, local elections, like close national elections, are an all too common locus of electoral fraud (Alvarez, Hall, and Hyde Reference Alvarez, Hall and Hyde2008, 12). Some studies suggest that the degree of intraparty competition also affects the likelihood of candidates engaging in fraudulent activities. Where candidates from the same party compete with one another, they seek to acquire “personal votes” distinguishing them from others running for office with the same party label and, therefore, have incentives to engage in electoral fraud (Chang and Golden Reference Chang and Golden2006). “Intraparty competition is less likely to involve competition over issues and government responsibility and more likely to involve pork-barrel politics and expensive personalistic appeals, increasing demand for illegal campaign activities” (Nyblade and Reed Reference Nyblade and Reed2008, 929).
Japanese municipality elections satisfy both of these common conditions for electoral fraud; they are highly competitive and electoral competition is not only between but also within parties. This is a product of the Japanese electoral system; namely, in assembly elections, each municipality in principle constitutes an at-large electoral district (i.e., one district for one municipality) and the number of seats ranges from 12 to 96, depending on the population size. Every voter has a single vote; that is, he or she votes for only one candidate. Winners are decided simply based on the total number of votes each candidate garners, and redundant or futile votes are not transferred to other fellow candidates (e.g., candidates from the same party).Footnote 16 Under this single nontransferable vote system, the vote margins between candidates tend to be extraordinarily small and dozens of candidates run from the same party or camp.Footnote 17
Figure 1 illustrates an example of the distribution of votes in an assembly election in a municipality with the median population size (about ten thousand), the town of Taneichi in Iwate prefecture. Twenty-two candidates competed for 18 seats in the election on April 27, 2003. The last winner (the 18th candidate) obtained 351 votes, whereas the runner-up (the 19th candidate) got 338 votes. The vote margin is only 13, or 0.01% of the total number of eligible voters. Even the fourth to last winner (the 15th candidate) maintained as small a margin as 35 votes compared to the first runner-up.
Sample Distribution of Votes in a Municipal Assembly Election

According to a more extensive study on municipal assembly elections held between 1987 and 1998 in two prefectures (Saga and Fukuoka), the vote margin between the last winner and the runner-up is less than 50 votes in two-thirds of these municipalities and less than 10, including zero, in about 20% of them (Horiuchi Reference Horiuchi2005, Table 5.4, 86).Footnote 18 Political scientists and economists have long assumed that “[t]he probability of being decisive . . . in an election with more than a handful of voters is always small, usually very small, and sometimes infinitesimally small” (Fisher Reference Fisher1999, 267; see also Riker and Ordeshook Reference Riker and Ordeshook1968). The literature of electoral fraud also has not previously found any evidence that fraud changes electoral results (Lehoucq Reference Lehoucq2003), although competitiveness is the main driver for it. In Japanese municipal elections, however, even a small increase in the number of votes can affect who gets elected. Not surprisingly, such extraordinarily small vote margins give a strong incentive for candidates and their core supporters to mobilize voters, even from outside the district.
Voting from Nonresidential Addresses
Before shifting from qualitative to quantitative analysis to obtain systematic evidence of preelectoral residential registration, we want to emphasize that preelectoral residential registration is a variant of a classic electoral fraud—voting from nonresidential addresses, which has been, and still is, found in many countries. Campbell (Reference Campbell2005) reports abundant examples in the United States. In antebellum America, electoral machines notoriously and illegally imported voters, such as “‘floaters’ [who] voted several times, usually going from one precinct to another” (p. 19) and “‘colonizers’ . . . residing in another city or state” (p. 19). After the introduction of a voter registration system, “‘hundreds’ of names could not be found residing at the listed addresses, which were often abandoned buildings and vacant tenements” (171–72). “Ward and precinct heelers collect[ed] persons from rooming houses and boarding houses” and gave them (fictitious) names, (fictitious) addresses, and a few dollars (173–74). The following example in 1936 is particularly similar to our story:
[A] resourceful ward heeler would have his relatives residing in neighboring counties or states come to St. Louis on registration day, swear that they were residents of the city, and register to vote, providing the address of the ward heeler as their place of residence. . .. On Election Day, then, those who had registered under the process could go to the polls, or repeaters hired for this purpose could then vote as the individual registered illegally (174).
There are many other stories outside the United States. In Britain, the residency requirement for electors was not enforced from the 15th to the 18th century even before it was formally repealed in 1773 (Hutcheson Reference Hutcheson, Newman and Ellen Brown1997). In the first half of the twentieth century, Costa Rican parties allegedly “packed the electoral registry with dead or nonexistent individuals” or those who “lacked a permanent residence” (Lehoucq and Molina Reference Lehoucq and Molina2002, 40, 99). They also transported railroad employees to districts where the employees were not registered and forced them to vote (Lehoucq and Molina Reference Lehoucq and Molina2002, 185–88). In postwar Malaysia, the governing party, UMNO, legalized illegal immigrants from the Philippines and Indonesia by way of document fraud, so that they could vote for UMNO (Sadiq Reference Sadiq2005). Similarly, some illegal immigrants from Afghanistan were registered to vote in Pakistan, and similar movements occurred from Bangladesh to India, from Nigeria to Cameroon, from Togo to Ghana, and from Burkina Faso to the Ivory Coast (Sadiq Reference Sadiq2005, 103). Preelectoral residential registration is reportedly found in Korea as well.Footnote 19 In the Solomon Islands, many residents were allegedly imported from island to island to be registered and vote.Footnote 20 In Australia, the Electoral Commission compiled a list of all suspected cases of electoral fraud for the decade 1990–2000 and found that one of the major types of fraud was false enrollment transferring the principal place of residence, aimed at affecting election outcomes.Footnote 21
NATURAL EXPERIMENTAL DESIGN AND HYPOTHESES
The previous section suggests that preelectoral residential registration or voting from nonresidential addresses may be rampant, whereas we suspect that the crime statistics underrepresent reality. Then how do we know how many people actually are engaged in this behavior? To answer this, we need to cross an important hurdle—the difficulty of identifying whether changing one's address (regardless of actual residence) is motivated by electoral fraud or not. Thanks to a natural experimental setup in Japan, we can cope with this problem and make valid causal inferences.
In this section, we first review some existing statistical studies to detect electoral fraud and argue the advantages of natural experimental design. We then explain why we assume that our treatment variable is an as-if random assignment. The third part derives a hypothesis about the timing of preelectoral residential registration. Finally, we propose another hypothesis about how competitiveness affects its magnitude.
Existing Approaches to Detecting Electoral Fraud
In the literature on detecting electoral fraud, scholars have traditionally relied on qualitative sources, as we mentioned in the Introduction. These provide useful indications, but are presumably the tip of the iceberg and are insufficient for us to draw a comprehensive picture.
A handful of recent studies try to detect only partially observable fraudulent activities using various methods of statistical inference. One is a model-based approach, where scholars estimate some statistical (e.g., regression) models and examine irregularities, anomalies, or outliers (Myagkov, Ordeshook, and Shakin Reference Myagkov, Ordeshook and Shakin2009; Wand et al. Reference Wand, Shotts, Sekhon, Mebane, Herron and Brady2001). For example, Alvarez and Katz (Reference Alvarez, Katz, Michael Alvarez, Hall and Hyde2008) fit a regression model with two independent variables to explain vote share and then predict the vote share of the next election (where suspicious voting machines were in use) by using the parameter estimates obtained from the analysis of the previous election. If most of the observed vote shares are outside the 95% confidence intervals of the predicted vote shares, one suspects that electoral fraud could have occurred. These model-based studies have succeeded in reasonably calling attention to doubtful cases that require further investigation. Once readers consider, however, the existence of relevant omitted variables,Footnote 22 the misspecification of functional form, or the wrong distributive assumption of an error term, the validity of any model-dependent analysis can be called into question. This approach also “ignores the fraud that can occur regularly” (Campbell Reference Campbell2005, 26, emphasis added).
An alternative is a design-based approach, in particular, a natural experiment, which we consider a more convincing method offering valid and robust causal estimates.Footnote 23 For example, Hyde (Reference Hyde2007) focuses on the 2003 Armenian presidential election and compares the incumbent's vote shares at polling stations that international election observers visited (the treatment group) with those at the other polling stations they did not visit (the control group). If we assume, as Hyde does, that the observers were randomly assigned to polling stations, there should be no systematic difference between the two groups except for the presence or absence of observers (i.e., treatment). Therefore, a reduction in the average vote share of the treatment group compared with the control group can be safely regarded as the effect of monitoring on voting behavior: namely, that international observers reduce electoral fraud.
It is crucial for a natural experiment, however, that the assignment of a treatment variable be as-if random (Dunning Reference Dunning2008). For instance, in search of a reason for the unnatural surge of votes for Buchanan in Palm Beach County, Florida during the 2000 U.S. Presidential election, Wand et al. (2001, 799) compare election day voting (which used the notorious butterfly ballot) with absentee voting (which did not) as a natural experiment, though this treatment variable is “not random assignment,” as the authors themselves admit.Footnote 24 In our case, however, treatment is an as-if random assignment, to which we turn next.
Treatment: Simultaneous Local Elections
In Japan, as of April 27, 2003, there were 3,210 municipalities (i.e., cities, special wards, towns, and villages) in 47 prefectures and each municipality votes for both a unicameral legislative assembly and a popularly elected mayor. Just before the current Constitution came into force, all municipalities held their elections of assembly members and mayors simultaneously in April 1947. Because their terms were four years, subsequent elections were scheduled, in principle, every fourth year (i.e., 1951, 1955, 1959, . . ., 2003, 2007, 2011) on the fourth Sunday in April.
Today, however, a significant proportion of municipalities do not hold their elections during these simultaneous local elections (hereafter SLE). Once an election is held off the SLE cycle for whatever reason, the following elections usually remain off the SLE cycle, because the length of the subsequent term is always four years, not the remainder of the previous term. In our analysis, we focus on timing and reasons for the last deviation from the cycle for each control municipality.
Specifically, in the case of the 2003 SLEs, among 3,105 municipalities that we study, 51.6% of municipalities held assembly and 21.4% mayoral elections on April 27, 2003.Footnote 25 We call whether or not each municipal assembly or mayoral election was held on April 27, 2003 the “legislative treatment” or the “executive treatment,” respectively. This cross-municipality variation provides a unique opportunity to study the effects of a municipal election.
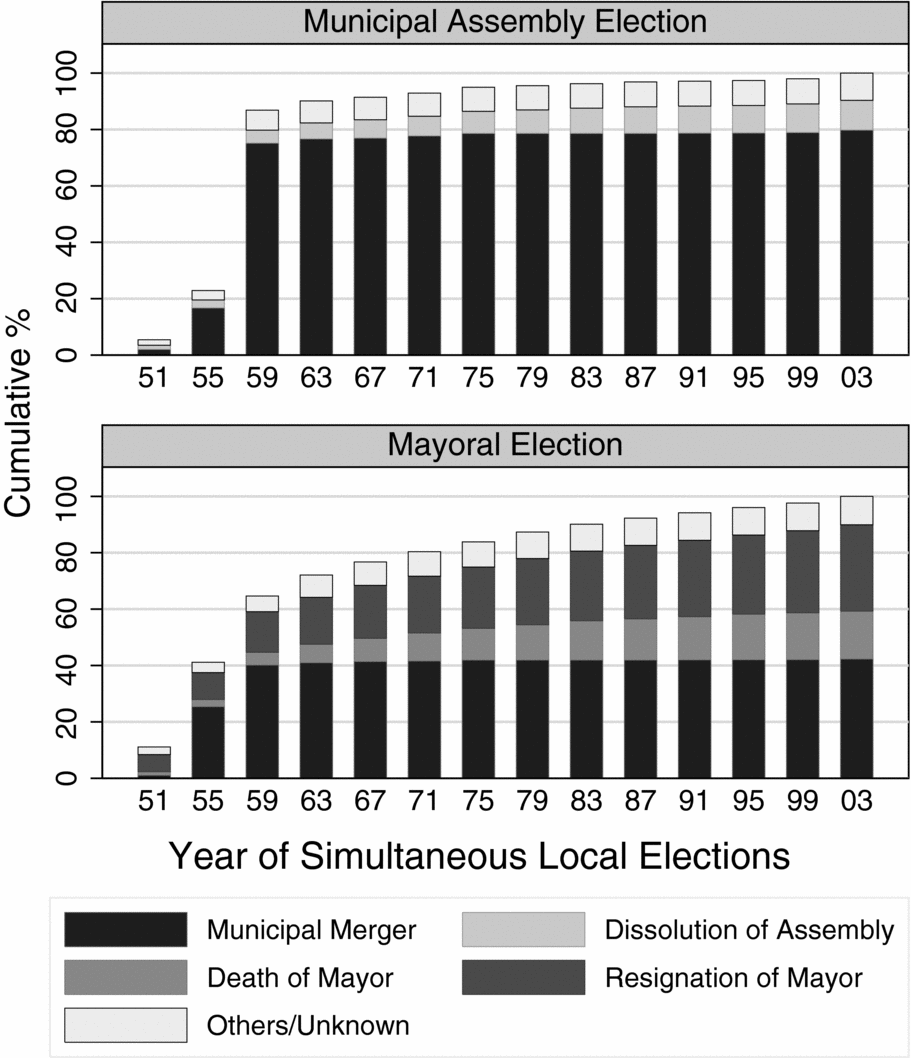
Figure 2 displays the cumulative percentages of municipalities in the “legislative control” group, which did not hold an assembly election on April 27, 2003, or the “executive control” group, which did not hold a mayoral election on the same day, by years and reasons for deviation from SLEs. The denominator of each bar graph is the total number of control municipalities whose timing of deviation is identified (N = 1,438 for municipal assembly elections and 2,398 for mayoral elections).Footnote 26 Figure 2 shows that more than 60% of those municipalities (86.9% for municipal assembly elections and 64.6% for mayoral elections) dropped out of the cycle of SLEs by the 1950s, when the national government strongly encouraged municipal mergers by way of special laws and budgetary incentives. Newly established municipalities usually hold their elections before four years have passed since the previous SLEs.Footnote 27 Indeed, municipal merger is the most common reason for municipalities to drop out of the SLE cycle (79.8% and 42.4% for the legislative and executive control groups, respectively).We cannot imagine, however, that municipal mergers five decades ago, or factors affecting them, still have any substantial influence on citizens’ and candidates’ behavior in 2003. In particular, it is unreasonable to assume that factors behind municipal mergers in the 1950s affect any short-term change during the 2000s, which is our outcome variable. We revisit this important point in the next section.
When and Why Did Municipalities Drop from the Simultaneous Local Elections?

The other major reasons for deviation are assembly dissolution (10.5%), mayoral resignation (30.6%), and the death of an incumbent mayor (16.9%).Footnote 28 It is extremely unlikely that these long-past events, or the factors that caused them, could affect the difference in population movement in a given month compared to the previous year.
In sum, all pretreatment variables (i.e., reasons for deviation) that affect our treatment variable (i.e., election timings) are unlikely to affect our outcome variable (i.e., the short-term change in population movement) regardless of whether these pretreatments are observed, unobserved, or unobservable. At least, we have no theory that predicts the direction of the effects of merger, death, resignation, or dissolution on short-term political behavior. Thus, we regard whether or not each municipal assembly or mayoral election was held on April 27, 2003 as an as-if randomly assigned treatment.Footnote 29
Hypothesis 1: Timing
We suspect that preelectoral residential registration occurred in January 2003 for an April election because of the following two institutions. First, all eligible voters need to have their addresses registered in a district for more than three consecutive months before the election. In the case of the 2003 SLE, which was held on April 27, 2003, in order to vote in elections, people had to change their residential registration before January 19 (in cities) or 21 (in towns and villages), 2003.Footnote 30 Second, residents must pay a residential tax to the municipalities of their residential addresses (at least in the public record) as of January 1 in each year. Any change of their registered addresses is reported to the tax office and their employer, who withholds taxes from their salary and pays them on their behalf. Because “relocaters” may not like the tax office and their employer to become suspicious of their unnatural moving, they are expected to change their residential registration after January 2, 2003 (and move it back to the original address before December 31, 2003).
Given these rules, we hypothesize a noticeable surge in the number of people registering their residential addresses in municipalities with an election (i.e., in the treatment group) only in January 2003.
H1: The treatment effects are positive only in January 2003.
Clearly, we do not argue that all movement to the treatment group in January 2003 is fraudulent. If we observe, however, a significant difference between the treatment and control groups only in January 2003, we are inclined to believe that it is due to preelectoral residential registration.
Hypothesis 2: Competitiveness
In the previous section, we argued that electoral competitiveness encourages preelectoral residential registration. One way to confirm this is to compare the size of treatment effects by municipality population size, according to which electoral competitiveness varies. Article 91 of the Local Autonomy Act stipulates that the maximum municipal assembly size is a nonlinear step function of municipal population size, which can be roughly approximated by a natural log of the population size. For example, the maximum number of seats is 12 for municipalities with less than 2,000 residents, whereas it is 34 for municipalities with more than or equal to 100,000 but less than 200,000 residents. Thus, the assembly size rises only around threefold, even when the population size centuplicates. The typical number of candidates is slightly larger than the number of seats.
Therefore, as the population size decreases, the vote margin between candidates, which is correlated with the average number of votes each legislator represents, tends to decrease (Horiuchi Reference Horiuchi2005, Table 5.4, 86).Footnote 31 A similar logic applies to mayoral elections; namely, the difference in votes between a winner and a runner up tends to be smaller in smaller municipalities. Thus, we also test the following hypothesis by splitting municipalities into two subsamples: towns and villages, and cities.Footnote 32
H2: The treatment effects are larger in towns and villages than in cities.
STATISTICAL METHOD
This section introduces our statistical method for detecting preelectoral residential registration. We first specify a differences-in-differences model and give a rationale for applying this model to our analysis. Second, we clarify the prediction of coefficient estimates. Finally, we create four different data sets to address heterogeneous treatment effects.
Differences-in-differences Model
In estimating the legislative treatment effect, we set the following baseline model:

The unit of observation is municipality i in month m, year t (January 2001 to December 2004).Footnote 33 Yi,t,m is the natural logarithm of the number of relocated residential registrations (W) plus one (i.e., log(W + 1)).Footnote 34 The dummy variable Dt,m indicates whether the observation is for month m in year t, whereas its coefficient ft,m represents that month's fixed effect. These month–year fixed effects control the national average number of relocated residential registrations, which varies substantially across months during the period of investigation. For example, the nationwide total is always more than three million in March or April—just before and after the new fiscal/school year begins on April 1. In other months, it is always less than two million. This number is typically lowest in January (i.e., 1.2–1.3 million). Another observable pattern is that the number of movers in each month gradually declined from 2001 to 2004.
The legislative treatment variable LTi is 1 if a municipality assembly election was held on April 27, 2003 and 0 otherwise, and it is interacted with the month–year dummy. Its coefficient gt,m shows, on the average, how many additional residential registrations are transferred to treatment municipalities (with a legislative election) in month m in year t, as compared to control municipalities (without a legislative election) in the same month in the same year. Note that the control municipalities’ average number of relocated residential registrations is equal to ft,m.
ci is the municipality-specific time-invariant fixed effect. It includes, for example, which district for prefecture-level and national-level elections each municipality belongs to and geographical attributes of each municipality. More importantly, a range of political and historical factors that caused the treatment assignments (e.g., whether or not a municipality experienced a merger with other municipalities in the 1960s) are obviously constant for each municipality during the period of investigation (i.e., January 2001 to December 2004). Therefore, by adding municipality-specific fixed effects, we can control any observable and unobservable determinants of why some municipalities dropped off from the election cycle and thus raise the level of our confidence that the treatment assignment is as-if random.
bi,m is the municipality-specific and month-specific effect. There exist some seasonal effects on moving; for example, as a nationwide pattern, more people move to other municipalities in March and April, as we explained. The number of relocated residential registrations in March/April, however, may be different depending on each municipality's geographical location, population size, etc. Specifically, larger urban municipalities surrounded by smaller rural municipalities are likely to have a larger number of “spring movers” than smaller municipalities.
ei,t,m is the error term, namely, a vector of all the remaining observable and unobservable variables specific to municipality i in month m, year t. Some time-variant and municipality-specific economic variables, such as monthly inflation and unemployment rates, may explain why people move into a particular municipality at a particular time.
In the case of the same month m of the previous year t − 1, it follows that

By subtracting the second equation from the first, we obtain

where Δ is the difference operator, ΔVi,t,m = Vi,t,m−Vi,(t−1),m. We assume that Δei,t,m independently follows the identical normal distribution. An important merit of this differences-in-differences model is that it controls all time-invariant municipality-specific characteristics (ci) as well as all municipality-specific seasonal effects (bi,m).Footnote 35 Moreover, it is extremely unlikely that any short-term changes in demographic, economic, and social characteristics during the 2000s that may affect the outcome variable (i.e., Δei,t,m) have any effect on our treatment variables, which are assigned causally prior to them, as documented in the previous section. This is the crux of our natural experiment. Therefore, we can safely assume that the treatment variable (LTi) is independent of the differentiated error term (Δei,t,m); that is, it is as-if randomly assigned. This assumption leads to E(LTi · Δei,t,m) = 0 (where E(.) is the average function), and we obtain unbiased estimates of the causal effects (Δ(gt,m)) by using only 36-month dummies (Dt,m) and their 36 interaction terms with our treatment variable (LTi) as regressors.Footnote 36
In a similar fashion, we derive the model of the executive treatment effect,

where the executive treatment variable ETi is a dummy for whether a mayoral election was held on April 27, 2003, and ht,m is the executive treatment effect in month m in year t.
Prediction
We focus on 36 (= 12 months × 3 years) Δ(gt,m)'s and Δ(ht,m)’s. Because the 2003 SLEs were held at t = 2003 and m = 4, Hypothesis 1 implies that only g2003,1 and h2003,1 (three months before the elections) are positive and all the other gt,m's and ht,m's are zero. Consequently, we predict the following:

and all the other Δ(gt,m)'s and Δ(ht,m)'s are zero.Footnote 37
To test Hypothesis 2, we split the whole sample into a town and village subsample and a city one, and estimate the treatment effects using each subsample. Our anticipation is that the sizes of Δ(g2003,1), Δ(g2004,1), Δ(h2003,1), and Δ(h2004,1) are larger in the town and village subsample than in the city one.
Four Data Sets
We assume that each treatment effect is conditional on the value of the other treatment. For example, the legislative treatment effect might be larger when there is no mayoral election (i.e., ETi = 0), compared to when there is a mayoral election (i.e., ETi = 1). As core supporters of legislative and mayoral candidates may overlap, legislative candidates can mobilize more voters when a mayoral election is not held than when mayoral candidates are also eager to mobilize the voter pool.
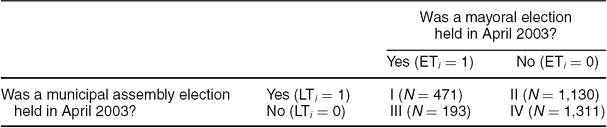
Given this possibility of treatment effect heterogeneity, we divide the data set in two in two ways and estimate average treatment effects for four data sets; (1) the legislative treatment effect in the executive control group (municipalities II (N = 1,130) against IV (N = 1,311) in Table 1, total N = 2,441), (2) the legislative treatment effect in the executive treatment group (municipalities I (N = 471) against III (N = 193), total N = 664), (3) the executive treatment effect in the legislative control group (municipalities III against IV, N = 1,504), and (4) the executive treatment effect in the legislative treatment group (municipalities I against II, N = 1,601).
Four Types of Municipalities

More formally, we estimate the following:


RESULTS
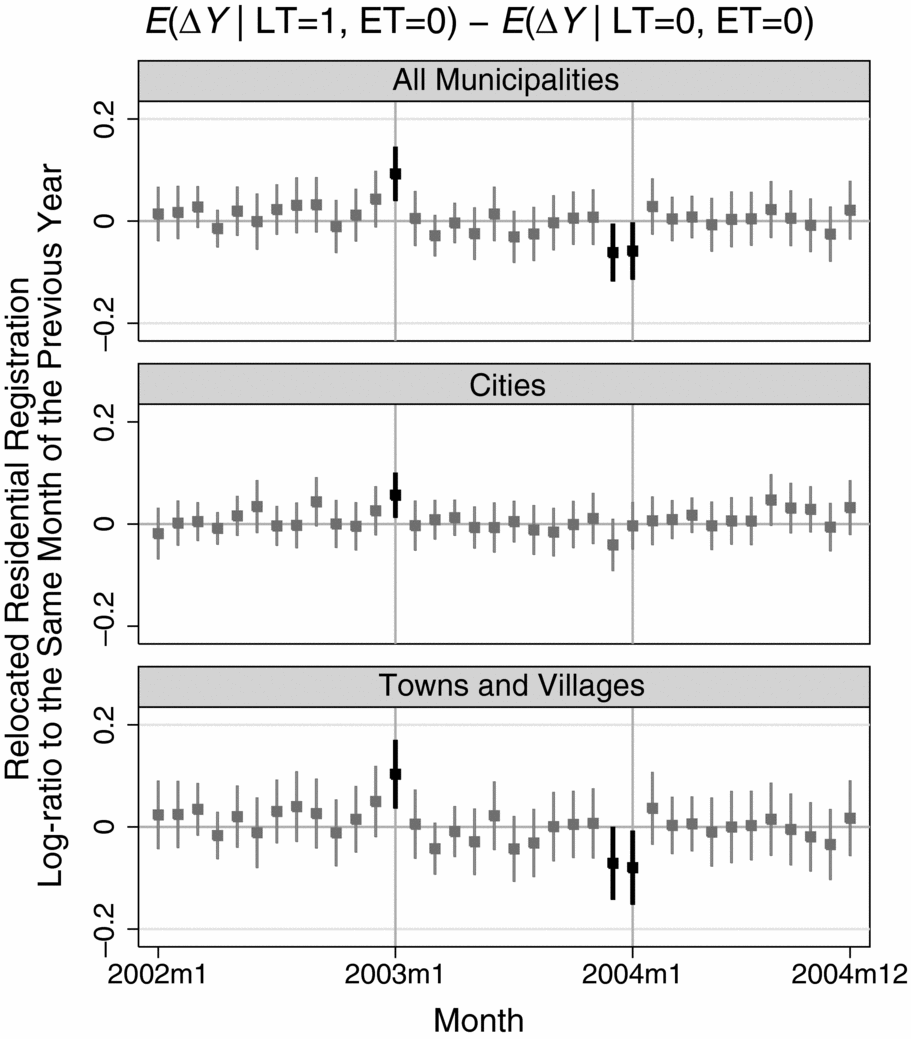
Figure 3 shows estimates of the differentiated legislative treatment effects in the executive control group (the first of the four data sets), Δ(gt,m) | ETi = 0, for every month from January 2002 to December 2004. Each dot represents our point estimate, whereas each bar shows its 99% confidence interval. Thus, when this bar does not reach the horizontal line at zero, the differentiated legislative treatment effect is statistically significant at the 1% level. These cases are highlighted in black. For all municipalities (the top panel), Δ(g2003,1) is positive and Δ(g2004,1) is negative (both are significant), whereas most of the other thirty-four Δ(gt,m)'s are not significant.Footnote 38 We can thus infer that g2003,1 is positive whereas others are zero, which is consistent with Hypothesis 1. Comparison between the middle and bottom panels demonstrates that the absolute values of Δ(g2003,1) and Δ(g2004,1) are larger in towns and villages than in cities. This fits with Hypothesis 2. Moreover, Δ(g2003,1) and Δ(g2004,1) are both significant in towns and villages, but only Δ(g2003,1) is significant in cities.
Legislative Treatment Effects in Executive Control Municipalities

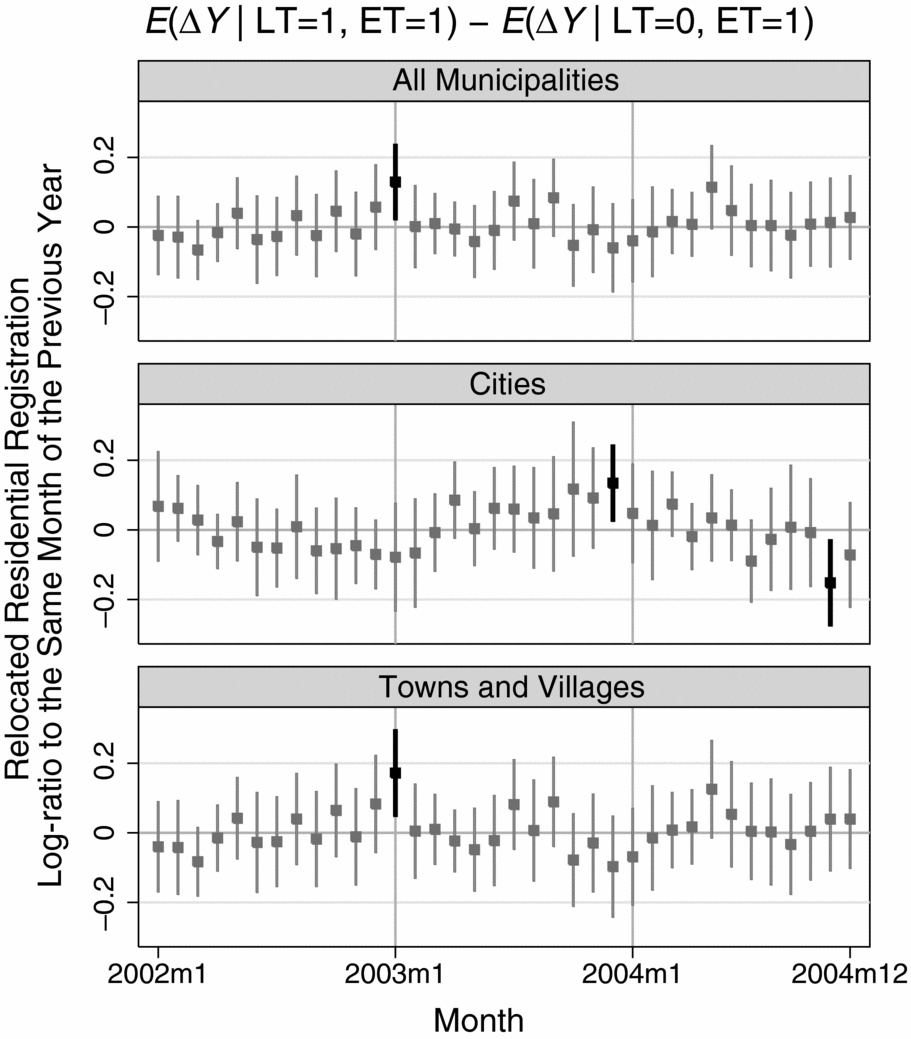
Figure 4 illustrates the corresponding estimates for the executive treatment group (the second data set), Δ(gt,m) | ETi = 1. Compared to Figure 3, Figure 4 shows larger confidence intervals. This is because of the small size of the executive treatment group (N = 664 vs. N = 2,441). For all municipalities (the top panel), Δ(g2003,1) is positive and significant, though all the other Δ(gt,m)'s are not significant. Δ(g2004,1) is negative but insignificant (the top panel). The middle panel displays no systematic pattern in the estimates across months for the city subsample. For the town and village subsample (the bottom panel), however, we obtained a positive, large, and highly significant effect for January 2003. The estimate for January 2004 is negative but not significant. These three panels in Figure 4, thus, also suggest the validity of Hypothesis 1 and Hypothesis 2, at least to some degree.
Legislative Treatment Effects in Executive Treatment Municipalities

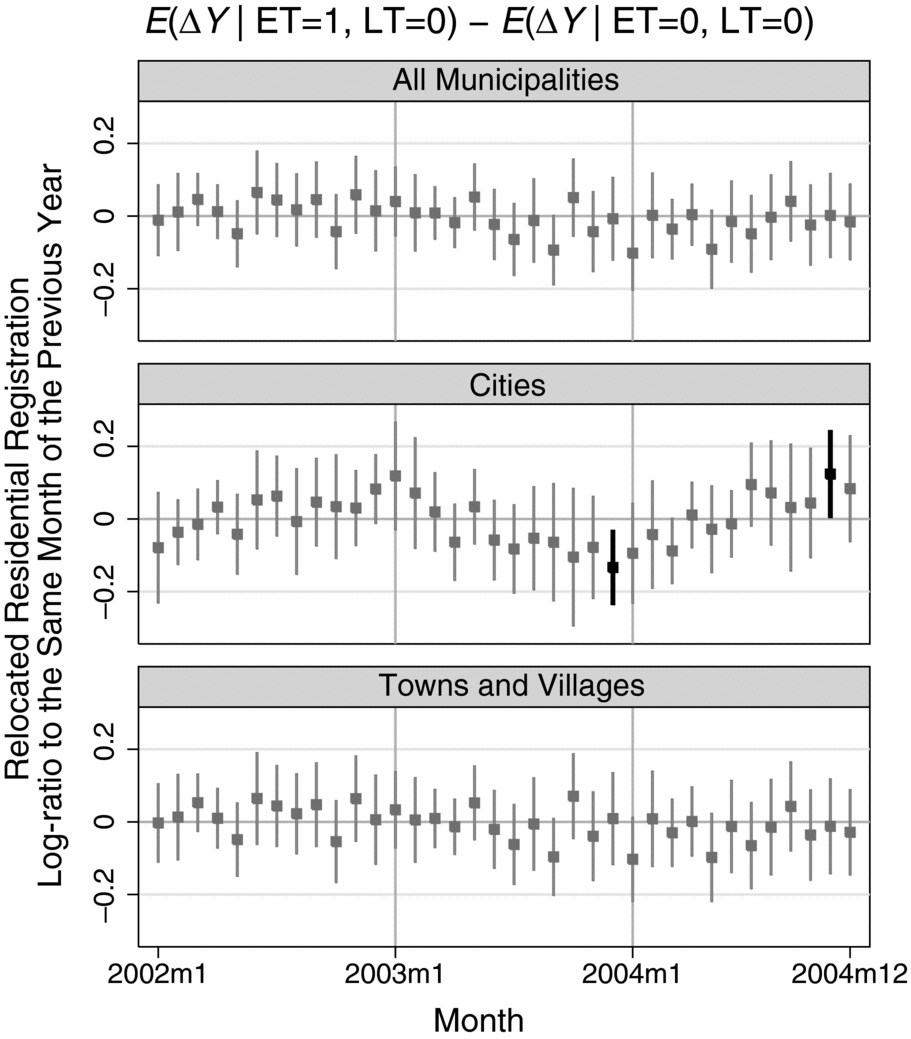
Figure 5 indicates the estimates of the differentiated executive treatment effects for the legislative control group (the third data set), Δ(ht,m) | LTi = 0. For the whole group (the top panel), Δ(h2003,1) is positive and Δ(h2004,1) is negative, but all months are insignificant at the 1% level. For both the city subsample (the middle panel) and the town and village subsample (the bottom panel), most months are insignificant and there is no systematic pattern, although the coefficients for January 2003 are positive and the coefficients for January 2004 are negative (for the town and village subsample, significant at the 5% level and larger than the city subsample). Although these effects are less distinctive than those shown in other figures because of the small size (N = 193) of the treatment group in this data set, the patterns may suggest some validity of Hypotheses 1 and 2.
Executive Treatment Effects in Legislative Control Municipalities

Figure 6 shows the differentiated executive treatment effects of the legislative treatment group (the fourth data set), Δ(ht,m) | LTi = 1. For all municipalities (the top panel), the estimates are positive and significant for January 2003 and negative and significant for January 2004. The coefficients for all other months are insignificant. This is consistent with Hypothesis 1. Whereas the coefficients are nearly zero in most months for the city subsample (the middle panel), the only significantly positive effect for the town and village subsample is in January 2003. The negative coefficient for January 2004 is significant at the 5% level. These results are consistent with Hypothesis 2.
Executive Treatment Effects in Legislative Treatment Municipalities

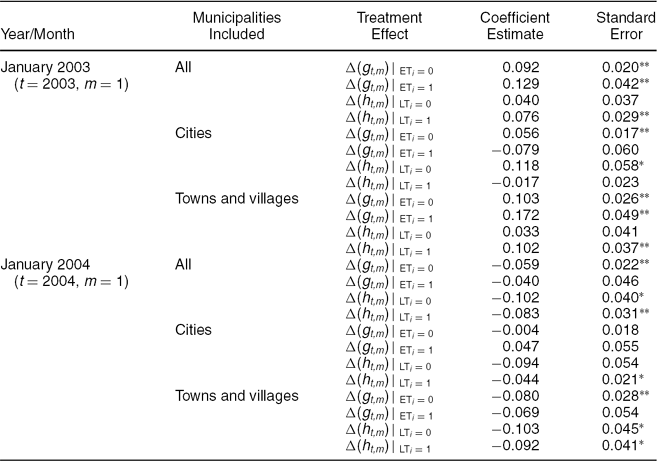
Overall, the estimates largely support the validity of our two hypotheses. The differentiated legislative and executive treatment effects tend to be significant in January 2003 and 2004, as summarized in Table 2. An equally important finding shown in Figures 3–6 is that the effects are not significant in most other months. Specifically, for all municipalities (top panels in Figures 3–6), there is only one significant (at the 1% level) coefficient (December 2002) among 136 (i.e., 34 months—excluding January 2003 and January 2004—times four data sets) estimates. A combination of these suggests the validity of Hypothesis 1.
Summary of Estimated Treatment Effects

Note: Δ(gt,m) | ETi = j, a conditional legislative treatment effect. Δ(ht,m) | LTi = j, a conditional executive treatment effect. The outcome variable is the log-ratio of relocated residential registration to the same month of the previous year.
**Significant at the 1% level; *significant at the 5% level (two-sided).
Table 2 also shows that the legislative and executive treatment effects tend to be larger in towns and villages than in cities. Most of the coefficients are significant for the town-and-village subsample. The estimated effects for other months are mostly insignificant for both subsamples. These results suggest that preelectoral residential registration is more common in smaller municipalities. This supports our Hypothesis 2.
DISCUSSION
Some might be afraid that the estimated treatment effects are not large enough to be decisive in an election. As noted earlier, however, in Japanese municipality assembly elections, single-digit votes can be pivotal in determining who gets elected. In our sample, the monthly average number of relocated residential registrations from January 2001 to December 2004 is 111. The point estimate of the differentiated legislative treatment effect in January 2003 is, for example, about 9.6% (= 100 × exp(0.092) − 100) if a mayoral election is not held (the top panel in Figure 3). Thus, as many as an extra 11 (= 111 × 0.096) people moved into legislative treatment municipalities as compared to legislative control municipalities. This is large enough to switch the last winner and the runner-up in nearly a quarter of municipal assembly elections, as noted earlier, and a small enough number of votes for candidates to mobilize. We emphasize that the effect does exist and we can detect such a small electoral trick using this natural experiment.
Skeptical readers might also argue that the estimated sharp increase in the number of residential registrations in January 2003 reflects an increase in the number of “early movers” (who changed their actual residence before that month but did not transfer their registered address until an election in April 2003 prompted them to do so) and/or an increase in the number of “real movers” (who changed their actual residence in that month),Footnote 39 rather than “paper movers” (who did not change their actual residence by that month). Subsequently, we show some evidence that substantial numbers of paper movers are likely, whereas early and real movers are highly unlikely to occur. We also explain that early and real moving are costly scenarios and early moving is even illegal.
When municipalities are suspicious of an abnormal increase in the number of residential registrations before an election, they sometimes investigate whether (all or suspicious) “new residents” actually reside in their municipalities. We find eight cases where a substantial portion (33% to 84%) of them turned out to be paper movers.Footnote 40 By contrast, no news articles listed in the Appendix mention the existence of early or real movers. Some even report that most suspect citizens changed their residential registrations back to the original municipalities they came from, as soon as the municipal authorities started conducting in-depth interviews and sent a warning. These “quick returners” as good as admitted that they were paper movers.
Early and real movers would have to incur many direct and indirect costs. Depending on where people are registered to live, rather than where they physically reside, they send their children to public schools and child care centers, receive allowances for dependent children, have claims for health insurance if self-employed, have claims for nursing care insurance, and access public health care, etc.Footnote 41 Therefore, early moving would be enormously inconvenient and expensive. Real movers would have to physically move their belongings, as well as cancelling and setting up all public services and utility contracts during one of the most important holiday seasons for Japanese people (and they would then have to repeat the same actions again if they returned to their previous addresses after the election). They could well have to take a three-month leave from their work/school and/or find a temporary job/school in the relocated municipality as well. Considering how rarely preelectoral residential registration is caught, these scenarios are highly unlikely.
We also call attention to the fact that early moving would be illegal. Because they are late for the deadline of registration, they have violated the registration law.Footnote 42 Moreover, we strongly doubt that they honestly report their actual dates of moving and pay the fine (up to 50,000 Japanese yen, equivalent to about 600 U.S. dollars), because the burden of proof rests with the applicants. We thus expect that they lie about the dates, but if they do so, they commit the criminal offence of making false public records as well.Footnote 43
In sum, we argue that paper movers are most likely to exist, whereas early and real movers are possible but highly unlikely. It is important to remember that early moving is in fact illegal. And if real moving were to exist by any chance, it would be indeed very curious and unusual behavior.
CONCLUSION
Based on Japan's institutional settings, which produce an as-if random assignment of election timings, we estimated the impacts of having an election on what we call preelectoral residential registration—the cross-municipality change of registered address for the purpose of voting. Our differences-in-differences estimates suggest that people do, indeed, move (most likely, only on paper) before an election and the magnitude of the effect of this is substantial, particularly in small towns and villages where assembly elections tend to be highly competitive. As argued, this pattern of voting behavior is a variant of a classic type of electoral fraud. The practice is common in many countries, though we are the first to provide robust inference of this fraudulent behavior.
We believe that our study, with a focus on Japan, paves the way for further development of comparative studies on electoral fraud, which we believe is an effective way to advance a longstanding policy debate—how to design an optimal registration system to discourage fraudulent behavior while still encouraging genuine electoral participation. To balance costs (illegal participation) and benefits (legal participation), we need to investigate both types of behavior, whereas previous endeavors have focused predominantly on the latter. For systematic and comparative inquiry into fraudulent behavior in elections, we argue that our approach—electoral timing as treatment—may serve as a useful tool that can be applied to a number of other contexts.
One example is local elections. In G7 countries, except France, not all subnational governments of the same level hold elections concurrently. To examine the United States in detail, 40 gubernatorial elections have departed from the presidential cycle in various years (Moore, Preimesberger, and Tarr Reference Moore, Preimesberger and Tarr2001, 1378–79 and chap. 30). Four states have their state legislative elections in odd-numbered years (Dubin Reference Dubin2007). Around 60% of U.S. cities hold their elections separately from either the presidential or gubernatorial contests (MacManus Reference MacManus, Weber and Brace1999, 175). Another example is staggered-term chambers, where not all districts are up for election at the same time.Footnote 44 This is the case for the senates of the United States, France, the Czech Republic, and 26 American states, as well as some American city councils and French department assemblies.Footnote 45 If we can regard the election timing as an as-if randomly assigned treatment, as we do in this article, the setup becomes a natural experiment. The senates of the United States and France are promising examples. Even if not, however, electoral timing is still worth exploiting as long as we can control relevant pretreatment variables by matching or any other proper statistical method. We also emphasize that the outcome variables that can be explained by the timing of elections are not only (abnormal) population movements. The timing of elections can explain many other variables that politicians’ mobilization efforts might affect. They include pork-barrel expenditures and voter turnout in other levels of elections (Fukumoto and Horiuchi Reference Fukumoto and Horiuchi2009; Fukumoto, Horiuchi, and Tanaka Reference Fukumoto, Horiuchi and Tanaka2011).
To conclude, we hope that future scholars will estimate, with the help of appropriate statistical tools, how many people are engaged in electoral fraud and how much (and in what situations) their behavior affects election outcomes in many other electoral contexts. “The internationalization of research on electoral fraud” (Alvarez, Hall, and Hyde Reference Alvarez, Hall and Hyde2008, 240) provides us with various situations, which enable scholars to examine institutional (and cultural) causes of not only legal participation (voting) but also illegal participation (fraud), and consider an optimal electoral registration system that balances both.
APPENDIX: NEWSPAPER REPORTS

L = municipality assembly, E = mayor, P = prefecture assembly, G = governor, N = national Diet.





Comments
No Comments have been published for this article.