Introduction
Thyroid nodules are very common, with a prevalence of 3–7 per cent based on palpation.Reference Tunbridge, Evered, Hall, Appleton, Brewis and Clark1, Reference Hegedűs2 Ultrasonography of the neck and upper chest has been reported to detect incidental thyroid nodules in 10–67 per cent of adults,Reference Tan and Gharib3, Reference Brander, Viikinkoski, Nickles and Kivisaari4 and a prevalence of 50 per cent is reported from autopsy data.Reference Mortensen, Bennett and Woolner5
Ultrasonography is useful in distinguishing the characteristics of malignant and benign thyroid nodules. Though only 5–9 per cent of thyroid nodules are malignant, it is vital to detect these.Reference Bastin, Bolland and Croxson6
Many patients with a palpable thyroid nodule are asymptomatic, and there is no correlation between histopathological features and reported symptoms. Guidelines therefore recommend ultrasonography in: patients at risk of thyroid malignancy, those with palpable thyroid nodules or multinodular goitres, and patients with lymphadenopathy suggestive of a malignant lesion.Reference Gharib, Papini, Valcavi, Baskin, Crescenzi and Dottorini7
Ultrasound-guided fine needle aspiration (FNA) biopsies are typically performed on suspicious nodules detected by ultrasonography. Ultrasound evaluation and cytology results should be used in combination to determine the management of thyroid nodules.
Modern, high-resolution ultrasound equipment can detect non-palpable thyroid nodules as small as 1–2 mm in diameter. Even if the diameter of the thyroid nodule is less than 10 mm, if ultrasonography shows features suspicious of malignancy, ultrasound-guided FNA is recommended.Reference Gharib, Papini, Valcavi, Baskin, Crescenzi and Dottorini7 Papini et al. concluded that there was no significant difference in the prevalence of malignancy in nodules greater or smaller than 10 mm.Reference Papini, Guglielmi, Bianchini, Crescenzi, Taccogna and Nardi8 The same series, involving non-palpable thyroid nodules, demonstrated extracapsular growth in 35.5 per cent and nodal involvement in 19.4 per cent of thyroid cancers. The prevalence of extracapsular and metastatic growth was similar in nodules greater or less than 10 mm.Reference Papini, Guglielmi, Bianchini, Crescenzi, Taccogna and Nardi8
Studies have reported no difference in the risk of malignancy between a thyroid gland with a single thyroid nodule and one which is multinodular.Reference Hegedűs2, Reference Ross9, Reference Frates, Benson, Doubilet, Kunreuther, Contreras and Cibas10
The majority of studies to date have analysed single ultrasonographic features to test how predictive they are for malignancy. Features that have been associated with an increased risk of malignancy are: a predominately solid nodule, hypoechogenicity, microcalcification, macrocalcification, ill-defined margins, intranodular vascularity, a taller-than-wide shape, extracapsular invasion and abnormal lymph nodes.Reference Bastin, Bolland and Croxson6
Around 90 per cent of malignant thyroid nodules are solid and hypoechoic, with decreased echogenicity compared to surrounding thyroid parenchyma and similar echogenicity to the anterior strap muscles.Reference Bastin, Bolland and Croxson6 However, a solid hypoechoic nodule is still nine times more likely to be benign than malignant.Reference Papini, Guglielmi, Bianchini, Crescenzi, Taccogna and Nardi8, Reference Frates, Benson, Doubilet, Kunreuther, Contreras and Cibas10 A honeycomb or spongiform appearance is due to multiple cystic spaces separated by thin septations within the nodule, and is associated with a very low risk for malignancy.Reference Moon, Jung, Lee, Na, Baek and Lee11, Reference Reading, Charboneau, Hay and Sebo12 Microcalcifications had a relatively high specificity (54–99 per cent), but low sensitivity (19–89 per cent) for thyroid malignancy in 20 studies included in the systematic review by Bastin et al.Reference Bastin, Bolland and Croxson6 Ill-defined, blurred or lobulated margins have a moderate specificity (22–98 per cent) but low sensitivity (8–89 per cent).Reference Bastin, Bolland and Croxson6 A nodule that is a taller-than-wide shape is known to be a marker for malignancy on breast ultrasonography; for thyroid ultrasonography, this characteristic has been shown to have high specificity (60–93 per cent) and low sensitivity (32–84 per cent) for thyroid cancer.Reference Bastin, Bolland and Croxson6 With regard to intranodular vascularity, sensitivities (57–100 per cent) and specificities (35–90 per cent) are moderate.Reference Bastin, Bolland and Croxson6
Ideally, a single ultrasonographic feature should have high sensitivity and high specificity for the diagnosis of thyroid cancer, but as this is not the case, several authors have proposed combinations of ultrasonographic features that might indicate a high risk of malignancy. The most impressive is the presence of taller-than-wide shaped nodules plus at least two of the following features: hypoechogenicity, blurred margins, calcification or intranodular vascularity. This combination identified 99 per cent of thyroid cancers (confirmed by ultrasound-guided FNA) in 72 per cent of nodules.Reference Cappelli, Castellano, Pirola, Gandossi, De Martino and Cumetti13 Another proposed combination is the presence of at least two of the following features: hypoechogenicity, size greater than or equal to 10 mm, blurred margins or microcalcification. This combination identified 93 per cent of cancers (confirmed by ultrasound-guided FNA) in 57 per cent of nodules.Reference Cappelli, Castellano, Pirola, Gandossi, De Martino and Cumetti14
Follicular nodules are difficult to diagnose as malignant or benign using ultrasonography. Koike et al. compared ultrasonographic characteristics to pathological results, and the overall sensitivity of pre-operative ultrasonography for the diagnosis of follicular nodules was extremely low, at 18.2 per cent, compared with 86.5 per cent for non-follicular nodules.Reference Koike, Noguchi, Yamashita, Murakami, Ohshima and Kawamoto15 Their study highlighted that ultrasonography was unreliable for the diagnosis of follicular nodules.
One can look to the specialty of breast surgery for further inspiration. The American College of Radiology has designed a staging system called the Breast Imaging Reporting and Data System (‘BI-RADS’), which is successfully used worldwide to categorise ultrasonographic features of breast masses.16 It was developed to help standardise breast imaging reporting. The Breast Imaging Reporting and Data System categories range from 1 (negative findings) to 6 (known, proved malignancy). The level of suspicion for malignancy increases from category 1 through to category 6. The cut-off point for deciding whether to assign the patient to imaging follow up or to send them for biopsy is between categories 3 and 4. Category 4 was further divided into subcategories 4a–c (wherein 4a = low suspicion, 4b = intermediate suspicion and 4c = moderate suspicion), to allow better communication between clinicians and patients.
Some have tried to develop an ultrasonographic staging system for thyroid nodules modelled on the Breast Imaging Reporting and Data System; these have been referred to as ‘thyroid imaging reporting and data systems’ (‘TIRADS’).
Reluctance to design a thyroid imaging reporting and data system has stemmed from the impression that ultrasonography is a very subjective method for assessing the risk of malignancy in thyroid nodules. Few studies have analysed the observer variability of ultrasonography. Choi et al. reviewed 204 ultrasound images and Cohen's kappa statistics were used to evaluate variations.Reference Choi, Kim, Kwak, Kim and Son17 Inter-observer variations ranged from slight agreement for echogenicity (κ = 0.34) to substantial agreement for vascularity (κ = 0.64). Nearly all showed substantial agreement (κ > 0.61) for intra-observer variability. Accuracy was high for all four radiologists, at 82.8 per cent. These experienced radiologists showed more than a moderate degree of agreement in ultrasonography of thyroid nodules, and their interpretation of ultrasound images were highly accurate. This demonstrates that experienced radiologists should be able to use a thyroid imaging reporting and data system relatively accurately with reproducibility.
The current study aimed to: classify and structure the ‘R staging’ (sonographic scoring) system, examine the relationship between R staging and the eventual histopathological diagnosis, and define the clinical utility and applicability of R staging.
Materials and methods
The study (supervised by GM) comprised patients who underwent partial or total thyroidectomy between 14 November 2008 and 16 September 2011. A total of 112 thyroid operations were performed on 104 patients. Eight patients underwent two operations (e.g. completion thyroidectomy) for malignancy.
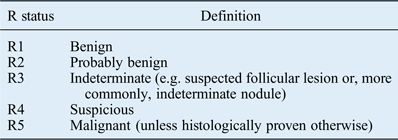
Sonographic scoring (R staging) was used for reporting sonographic risk of malignancy. The R staging system, designed by our specialist radiologist, is illustrated in Table I.
R staging system for thyroid nodules

An R status was assigned to the pre-operative ultrasound scan of each patient (based on a combination of the features listed below) by our experienced head and neck radiologist (GO). The radiologist was blinded to the surgical procedure and eventual pathology at the time of classification.
Features suspicious for malignancy included: a solid, hypoechoic nodule (darker than adjacent thyroid parenchyma) – suspicion is increased for hypoechoic nodules that are more hypoechoic (darker) than strap muscle; an irregular margin; microcalcification (small, hyperechoic foci); an anterior–posterior diameter exceeding the transverse diameter; and hypervascularity on Doppler sonography.Reference Kim, Park, Chung, Oh, Kim and Lee18
Features suggesting benignity included: the presence of comet-tail artefacts; spongiform configuration; cyst with colloid clot; giraffe pattern; diffuse hyperechogenicity; and a solid, isoechoic nodule, which is thought to indicate suspicion of a follicular lesion.Reference Ahuja, Chick, King and Metreweli19, Reference Bonavita, Mayo, Babb, Bennett, Oweity and Macari20
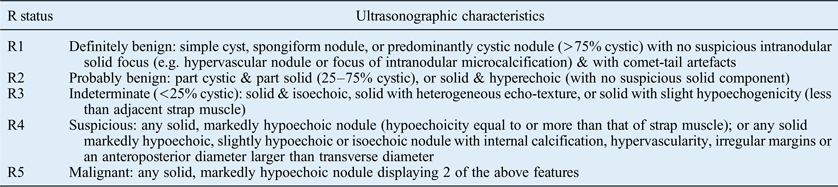
Table II shows the ultrasonographic characteristics for each R status.
Ultrasonographic characteristics of thyroid nodules in each R category
Exclusion criteria for the study were as follows: ultrasonography report or suitable hard copy of ultrasound images unavailable, or an incomplete report; ultrasonography not originally performed by our head and neck radiologist; no definite thyroid nodule on the ultrasound image; repeat ultrasound for the same patient; follow-up ultrasound for histologically proven thyroid cancer; and pathology report unavailable.
The final histopathological diagnosis was used as the ‘gold standard’ for analysis.
A total of 78 patients met the inclusion criteria. Data regarding the type of surgical procedure and the date it was performed were obtained from operating theatre records. Clinical Portal (NHS Greater Glasgow and Clyde's web-based electronic patient record system) was used to access patient details, which included age at diagnosis, gender and the final histopathology report. Pathological factors, including histological type, lymph node involvement and evidence of metastases, were recorded.
The data were entered into a Microsoft Excel spreadsheet and stored securely in a password-protected folder on the NHS Greater Glasgow and Clyde server.
Statistical analysis was performed using Minitab® 16 software. Subgroup analyses were performed in which follicular thyroid nodules were compared with non-follicular thyroid nodules. Statistical significance was assessed using Fisher's exact test.
Results
A total of 112 pre-operative ultrasound scans were performed on 104 patients over the 34-month study period. Following exclusion, 78 patients (75 per cent) were eligible for inclusion in the study.
Demographics
The median age of diagnosis was 51 years (range, 17–80 years). Fifteen patients (19 per cent) were male and 63 (81 per cent) were female.
Histopathology
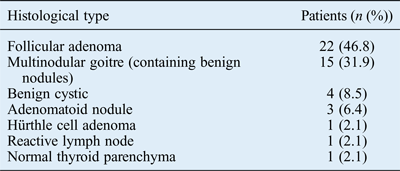
Forty-seven (60.3 per cent) of the thyroid nodules were benign, and 31 (39.7 per cent) were malignant. A breakdown of benign tumour types is shown in Table III.
Benign tumour types
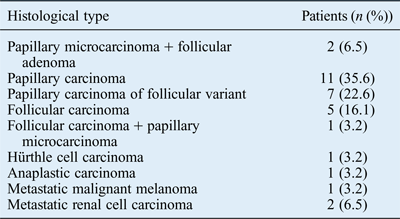
Papillary carcinoma was present in 21 malignant thyroid nodules (67.9 per cent), as seen in Table IV. Seven cases (22.6 per cent) were follicular variants of papillary carcinoma.
Malignant tumour types
Three patients had more than one thyroid nodule. Papillary microcarcinoma was found in combination with follicular adenoma in two patients (6.5 per cent) and follicular carcinoma in one patient (3.2 per cent). Patients with two nodules were assigned an ultrasonographic score (R status) based on the lesion with the ultrasonographic malignant features.
Metastatic deposits from malignant melanoma and renal cell carcinoma presented as thyroid nodules.
Ultrasonographic staging
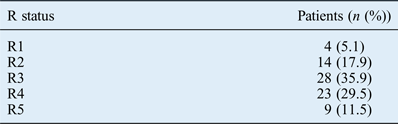
Table V shows the number of patients assigned to each R stage. The ultrasound images were most frequently assigned an R3 status.
Patient distribution according to R status
The probability of malignancy (based on histopathology) in thyroid nodules assigned an R status of 1, 2, 3, 4 or 5 was 25 per cent, 21.4 per cent, 14.3 per cent, 60.9 per cent or 100 per cent respectively.
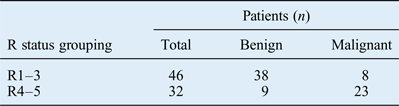
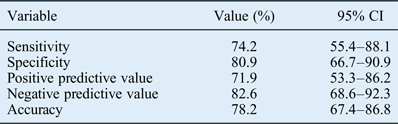
Thyroid nodules were re-classified as low or high risk for malignancy, as shown in Table VI. The initial cut-off points were R1–3 (low risk) and R4–5 (high risk), as it is clear from Figure 1 that the majority of thyroid nodules staged as R1–3 were benign and most classified as R4–5 were malignant. Table VII demonstrates the sensitivity, specificity, positive predictive value, negative predictive value and accuracy of R staging using these cut-off points.
Relationship between R staging and final histopathological diagnosis.
Low risk (R1–3) versus high risk (R4–5) R staging

Sensitivity, specificity, positive predictive, negative predictive and accuracy values of R staging*
* Using the cut-off points R1–3 (low risk) and R4–5 (high risk). CI = confidence interval
A range of cut-off points on the R scale can be used to define low risk and high risk for malignancy in thyroid nodules. By changing the cut-off point on the R scale, as shown in Table VIII, it is possible to explore what happens to sensitivities, specificities, positive predictive values, negative predictive values and accuracy.
Diagnostic index for different low and high risk R staging cut-off points
PPV = positive predictive value; NPV = negative predictive value
Subgroup analysis
Patients were allocated to one of two groups: a follicular thyroid nodule group or a non-follicular thyroid nodule group.
The follicular thyroid nodule group comprised 22 cases of follicular adenomas, 5 follicular carcinomas, 2 follicular adenomas plus papillary microcarcinoma, and 1 follicular carcinoma plus papillary microcarcinoma. The seven patients with papillary carcinoma of the follicular variant were included in the non-follicular thyroid nodule group.
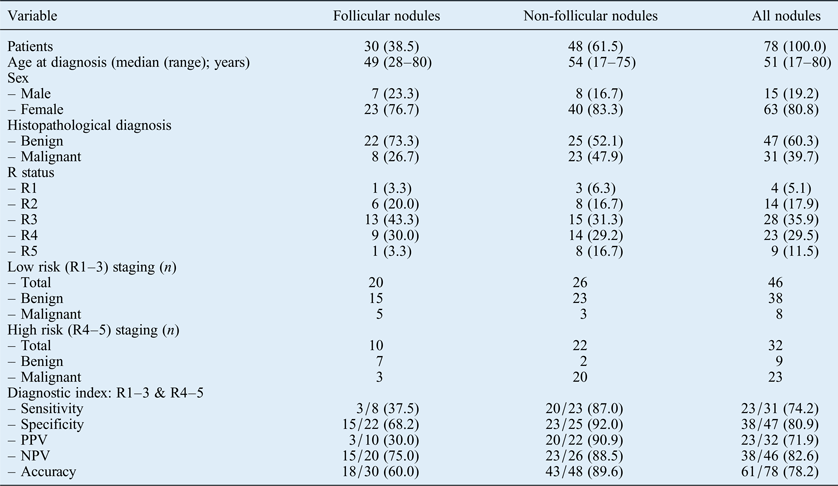
The groups were compared according to patient factors, sensitivities, specificities, positive predictive values, negative predictive values and accuracies, as shown in Table IX.
Comparison between follicular and non-follicular thyroid nodule groups
Data presented as n (per cent) unless otherwise stated. PPV = positive predictive value; NPV = negative predictive value
There was a significant difference found between the follicular and non-follicular groups when compared for sensitivity (p = 0.013), positive predictive value (p = 0.001) and accuracy (p = 0.004). There were no significant differences between the specificities (p = 0.063) and negative predictive values (p = 0.267).
Discussion
Ultrasonography is the most sensitive technique for identifying thyroid nodules, and can be used to differentiate malignant from benign lesions. A standardised ultrasound reporting system for thyroid nodules has yet to be developed in the UK. This study confirms that when using a combination of sonographic characteristics, ultrasonography is highly predictive of eventual histopathological diagnosis.
The majority of patients in this study were female, and the median age was 51 years. Forty-seven thyroid nodules (60.3 per cent) were benign and almost half of these were follicular adenomas. Papillary carcinoma was present in 21 malignant thyroid nodules (67.9 per cent), though in some cases it was in combination with follicular adenoma or carcinoma, or even classified as a follicular variant of papillary carcinoma.
The majority of thyroid nodules histopathologically confirmed as benign were assigned an R1, 2 or 3 status. A few benign nodules were assigned an R4 status, but the majority of thyroid nodules staged as R4 were malignant. An R5 status was 100 per cent predictive of malignancy. It would have been easier for our radiologist to correctly classify thyroid nodules as R5 because on ultrasound some nodules were obviously malignant, with extra-thyroidal extension and metastatic spread to lymph nodes. The sensitivity values in this study may have been lower if the three cases of metastatic deposits had been excluded, as they will have been easy to classify as R5 based on ultrasound.
Patients were most frequently assigned an R3 status. This is probably because 30 patients (38.5 per cent) had follicular thyroid nodules, which can be indeterminate on ultrasound. This can be explained by the fact that all patients underwent surgery in this study. It is therefore unlikely that many of the patients had thyroid nodules which appeared definitely benign on ultrasound. This is a limitation in the design of the study which cannot be avoided as eventual histopathological diagnosis is required to act as a gold standard for comparison.
There was a higher than expected percentage of malignant thyroid nodules staged as R1. This is probably because of the small number of patients assigned to this stage.
All possible combinations of cut-off points on the R scale were used to define low risk and high risk for malignancy. We found that from the R1 (low) and R2–5 (high) combination up to the R1–4 (low) and R5 (high) combination, sensitivity values decreased and the specificity and positive predictive values increased. The most favourable sensitivity, specificity, positive predictive, negative predictive and accuracy values arose when we defined low risk thyroid nodules as R1–3 and high risk as R4–5.
The positive predictive value indicated that patients assigned an R4–5 (high risk) status (based on ultrasound) had a 71.9 per cent chance of having thyroid cancer.
Few studies have ventured to design their own radiological staging system, especially within the UK. As a result, there are a limited number of studies to compare our results against. This is probably because of the considerable overlap of characteristics in benign and malignant lesions.Reference Watters, Ahuja, Evans, Chick, King and Metreweli21–Reference Brkljacić, Cuk, Tomić-Brzac, Bence-Zigman, Delić-Brkljacić and Drinković25
Most studies have only statistically analysed individual sonographic features suggestive of benign or malignant thyroid nodules. Bastin et al. published a systematic review of the role of ultrasonography in the assessment of nodular thyroid disease in 2009.Reference Bastin, Bolland and Croxson6 The review included 20 studies with reported sensitivities and specificities for 7 single ultrasound features. The authors concluded that no single characteristic on ultrasound can accurately predict malignancy, but a combination of features can be used to stratify risk. A consensus statement by the Society of Radiologists in Ultrasound concurs that no ultrasound feature has both a high sensitivity and a high positive predictive value for thyroid cancer, and values are extremely variable between studies.Reference Frates, Benson, Charboneau, Cibas, Clark and Coleman26 It is reported that a combination of ultrasonographic features can sometimes improve the positive predictive value to some degree.
‘R staging’ versus thyroid imaging reporting and data systems
Three studies developed standardised ultrasonographic characterisation and reporting data systems for thyroid nodules (referred to as ‘thyroid imaging reporting and data systems’).Reference Horvath, Majlis, Rossi, Franco, Niedmann and Castro27–Reference Kwak, Han, Yoon, Moon, Son and Park29 Each was different, but all were based on the concept of the Breast Imaging Reporting and Data System.
The thyroid imaging reporting and data system developed by Horvath et al. (Reference Horvath, Majlis, Rossi, Franco, Niedmann and Castro2009), utilised in a study of 1097 nodules, involves grouping the nodules into categories 1 to 6.Reference Horvath, Majlis, Rossi, Franco, Niedmann and Castro27 Based on defined ultrasonographic patterns, category 1 represents a normal thyroid gland, category 2 benign conditions, category 3 likely benign nodules (less than 5 per cent risk of malignancy), category 4 suspicious nodules (5–80 per cent risk of malignancy), category 5 likely malignant nodules (risk of malignancy over 80 per cent) and category 6 biopsy-proven malignant nodules. Category 4 nodules were further subdivided into: 4A, which represented undetermined nodules; and 4B, which represented suspicious nodules. Horvath et al. reported a sensitivity of 88 per cent, specificity of 49 per cent, positive predictive value of 49 per cent, negative predictive value of 88 per cent and accuracy of 94 per cent, which were comparable with our results. Horvath et al. also proved that the probability of a malignant ultrasound-guided FNA increased from category 1 through to 6. Evidently, using ultrasound-guided FNA biopsy results as the gold standard is a limitation, as this is not as accurate as comparing the ultrasound findings with the eventual histopathological diagnosis. Overall, the Horvath et al. study showed that the thyroid imaging reporting and data system was beneficial, as it allowed the department to reduce the number of unnecessary ultrasound-guided FNA biopsies, which reduced costs.
Park et al. (Reference Park, Lee, Jang, Kim, Yi and Lee2009) were the second to develop a thyroid imaging reporting and data system, and their study included 1694 patients.Reference Park, Lee, Jang, Kim, Yi and Lee28 The authors proposed an equation for predicting the probability of malignancy in thyroid nodules on the basis of 12 ultrasonographic features. As in our study, their system comprised five categories: category 1 = benign, 2 = probably benign, 3 = indeterminate, 4 = probably malignant and 5 = malignant. The results are not comparable with those of our study as the data were analysed differently. The authors noted a significant correlation between the cytological categories and the ultrasonographic categories (r = 0.491, p < 0.001). There was a clear limitation in their gold standard for analysis, as both cytology and histopathology were used for information regarding malignancy in the thyroid nodules. The main problem is that the system is not user-friendly for the radiologist performing the ultrasound. It is not practical in clinical practice to assign every thyroid nodule using the equation suggested.
Kwak et al. (Reference Kwak, Han, Yoon, Moon, Son and Park2011) included 1658 thyroid nodules in their study.Reference Kwak, Han, Yoon, Moon, Son and Park29 The diagnoses of only 298 thyroid nodules were confirmed by histopathology; the remaining 1360 were confirmed by cytology, which is a less accurate standard for comparison. The statistical tests used in that study were not suitable for the data in our study, which makes comparison between the two studies difficult. Kwak et al. used univariate analysis to show that six ultrasonographic features had a significant association with malignancy. Multivariate analysis demonstrated that the risk of malignancy increased as the number of suspicious features increased. The thyroid imaging reporting and data system developed by Kwak et al. was different in that the categories were based on the number of suspicious ultrasonographic features: category 1 = negative, 2 = benign, 3 = no suspicious ultrasonographic features, 4a = one suspicious feature, 4b = two suspicious features, 4c = three or four suspicious features, and 5 = five suspicious features. The risks of malignancy in each category of this system are identical to those in the Breast Imaging Reporting and Data System. The system designed by Kwak et al. is superior in that it can be easily used by clinicians. It is not difficult for those who perform ultrasonography to count the number of suspicious features. In contrast, the system designed by Horvath et al. uses 10 stereotypical ultrasonographic patterns that are not applicable to all thyroid nodules and is difficult for radiologists to use.Reference Horvath, Majlis, Rossi, Franco, Niedmann and Castro27
To the best of our knowledge, ours is the only study in the UK investigating the predictive value of ultrasonographic staging for thyroid nodules using a structured thyroid ultrasonographic classification system.
Current ultrasonographic classification systems mainly focus on non-follicular lesions, and exclude benign cystic thyroid nodules. The R staging system, like the thyroid imaging reporting and data systems, is useful for assessing all types of ultrasound-detected thyroid nodules, including both benign nodules and follicular lesions.
• Thyroid nodules are common
• Ultrasonography is the most sensitive technique for identifying thyroid nodules and can be used to differentiate malignant from benign lesions
• ‘R staging’, developed by our head and neck radiologist, is a new ultrasound-based reporting system for thyroid nodules
• When using a combination of sonographic characteristics, ultrasonography can be highly predictive of eventual histopathological diagnosis
• There is potential for a standardised ultrasound reporting system of thyroid nodules to be developed in the UK
Another important aspect of this study is that all ultrasound-based R staging of nodules was performed by a single specialist head and neck radiologist. This is advantageous in that there was no inter-observer bias (one would expect some variation among different radiologists in the interpretation of ultrasound examinations).
As this was a retrospective study, there was a degree of selection bias and a larger sample size would have provided superior results. Another limitation was that we included only those patients with thyroid nodules who had undergone surgery. This suggests that at the time of diagnosis, clinicians and radiologists suspected that the thyroid nodules may have been malignant. This selection bias may have influenced the reported risk of cancer, with more malignant thyroid nodules included in the study than would be representative of the general population. Furthermore, we did not take into account the fact that a few patients had multiple nodules and did not analyse these nodules separately. These patients could therefore have fallen into either the benign or malignant histopathological diagnosis groups, which would have affected the results. However, the American Association of Clinical Endocrinologists, Associazione Medici Endocrinologi, and European Thyroid Association guidelines do recommend that where multiple thyroid nodules are present, the nodule bearing the ultrasonographic characteristics associated with malignancy should be detailed.
Having completed this work, we can now ask other specialist head and neck radiologists to interpret the same ultrasound images using our proposed R staging system. A follow-up study could be conducted to test inter-observer reliability and reproducibility of the R staging system findings. More studies, in which R staging is prospectively applied at different institutions, are needed to validate our ultrasonographic staging system. Head and neck radiologists who have designed their own staging systems in the UK need to publish their results, and a systematic review needs to be carried out to compare the various ultrasonographic staging systems so that a nationally accepted thyroid imaging reporting and data system can be implemented.
Conclusion
An R staging (ultrasonographic scoring) system was developed to help standardise thyroid imaging reporting. This should result in better communication between clinicians and radiologists, and improve management of thyroid nodules.
This study shows that the use of R staging by a trained radiologist could significantly enhance the diagnostic process for thyroid lesions. The adoption of the R staging system in tandem with Thy staging of simultaneously obtained thyroid cytology is another step towards standardising and objectifying the diagnostic pathway.
Further studies focusing on validity and inter-observer consistency in ultrasonographic staging applied across multiple centres, along with feedback from radiologists in the thyroid imaging community, could enable a nationally accepted thyroid imaging reporting and data system to be implemented.
Acknowledgement
The authors would like to thank Mr Harper Gilmour for his assistance with the statistical analysis of the data.