INTRODUCTION
Pasture-based dairy production has expanded internationally over the past decade, particularly throughout North America and Western Europe (Gillespie et al. Reference Gillespie, Nehring, Hallahan and Sandretto2009; Mayne et al. Reference Mayne, McCaughey, Ferris, Fuquay, Fox and Sweeney2011). Primary causes have been the perceived negative environmental and animal welfare impacts of confined systems and their high costs relative to grazing systems, particularly for labour and imported feed (Dillon et al. Reference Dillon, Roche, Shalloo, Horan and Murphy2005). For example, the cost of producing a litre of milk in a confined system in the USA has been estimated to be around three times higher than that within pasture-based systems in Australia and New Zealand (NZ) (Dillon et al. Reference Dillon, Hennessy, Shalloo, Thorne and Horan2008). Low costs of milk production in NZ dairy systems underpin an industry of substantial importance to the national economy. Indeed, this is the primary agricultural industry of this nation, constituting about 0·25 of merchandize exports, nearly 2·5 times more than the second-placed commodity (meat products) (Statistics New Zealand 2012).
Despite the cost advantages associated with pasture-based (mostly Ryegrass and white clover) dairy farming, there has been substantial intensification of NZ dairy systems over the last 15 years in response to nominal milk prices that are higher than historical averages and high land prices. Between 1998/99 and 2008/09, herd size and milk production on NZ dairy farms increased, on average, by 59 and 91%, respectively (Grieg Reference Grieg2012). Intensification has been broadly achieved through increases in the amount of nitrogen (N) fertilizer application and feed supplement use, which have allowed constraints imposed by seasonal pasture growth patterns to be overcome. In particular, increased use of supplementation has allowed lactation lengths to be extended and higher stocking densities to be supported, resulting in greater rates of pasture utilization (Doole Reference Doole2014). The number of dairy systems that used no imported supplement to feed dairy cows decreased by 75% from 2000 to 2010, whereas those that fed 0·1–0·2, 0·2–0·30 and 0·3+ (kg/kg) of a cow's total diet with imported supplement increased by 111, 63 and 300%, respectively, over this time (Grieg Reference Grieg2012). Moreover, recent research indicates that N fertilizer application increased by more than seven times between 1990 and 2010 (Parfitt et al. Reference Parfitt, Stevenson, Dymond, Schipper, Baisden and Ballantine2012).
The use of forage crops grazed in situ by dairy cows has increased throughout NZ over the past decade. Turnip (Brassica rapa) crops are typically planted in October–November for grazing in February–March to support lactation through the provision of high-quality feed in late summer when pasture growth is limited. Turnip crops are now widely used throughout NZ, particularly in the Waikato region. In contrast, kale (Brassica oleracea) crops are typically planted in November–December for grazing dry cows when pasture growth slows in May–July. These crops are used in the South Island in particular, where winters are generally colder than in the North Island. Apart from their feed value, these forage crops also provide general rotational benefits through breaking pest and disease cycles and allowing the subsequent establishment of new pasture species (Doole & Pannell Reference Doole, Pannell and Berklian2008). Chicory (Cichorium intybus L.) is an alternative summer crop that NZ dairy farmers may use to support lactation in drier months (Brown et al. Reference Brown, Moot, Pollock and Moot2003). This crop is typically sown in October and grazed in December–March when summer pasture growth is depressed and pasture quality is declining due to soil water deficit (Clark Reference Clark and Lomas1995; Chapman et al. Reference Chapman, Nichol, Stevens, Lee and Minnee2012).
Field evidence has broadly indicated the value of chicory as a summer crop (e.g. Waugh et al. Reference Waugh, Clark, Harris, Thom, Copeman and Napper1998; Brown et al. Reference Brown, Moot, Pollock and Moot2003; Tozer et al. Reference Tozer, Cameron, Thom and Mercer2011). However, little knowledge pertaining to the value of chicory within NZ dairy farms exists, given an apparent dearth of economic analysis relating to its role and value within these systems. A major reason for this deficiency is that it is difficult to evaluate different components of the feed base within a given farm. The value of alternative feeds is a complex function of pasture growth and senescence, supplement availability and use, individual animal intake and efficiency, herd size and structure, and relationships between pasture utilization and livestock intensity (Doole et al. Reference Doole, Romera and Adler2013). Typically, the introduction of a new farming practice requires the whole system to be adapted, at least to some degree, to fully capture the benefits of the new practice. Thus, a meaningful evaluation of a new addition to a feed base ideally requires a system-level analysis to consider these factors in an integrated manner (Pannell Reference Pannell1995; Bell et al. Reference Bell, Robertson, Revell, Lilley and Moore2008).
The primary objective of the present paper is to explore the value of chicory crops to pasture-based dairy farms in the Waikato region of NZ. A comprehensive, non-linear optimization model of a pasture-based Waikato dairy farm – the Integrated Dairy Enterprise Analysis (IDEA) (Doole et al. Reference Doole, Romera and Adler2013) framework – is used to describe three farms that differ according to the degree to which they use imported supplement. The IDEA model has been shown to predict reliably when validated against data from system-level trials (Doole et al. Reference Doole, Romera and Adler2013). Moreover, it allows the interdependency between multiple components of a farming system to be considered simultaneously through the process of optimization (Doole & Romera Reference Doole and Romera2013).
METHODS
Description of the Integrated Dairy Enterprise Analysis model
This section provides a concise overview of the IDEA model, closely following Doole (Reference Doole2014); more detail is also provided in Doole et al. (Reference Doole, Romera and Adler2013). IDEA incorporates the basic structure of the farm-level model used by Doole (Reference Doole2010). However, it has been expanded to provide a closer description of real systems. Key additions are as follows: firstly, grazing decisions involve the selection of both rotation length and post-grazing residual herbage mass as variables. Secondly, these grazing decisions impact both subsequent pasture growth and digestibility. Thirdly, cows can be fed below potential to different degrees. Fourthly, the body condition of individual cows influences feed intake, milk production and conception rate. Finally, a notable feature of the model is its representation of interdependency between stocking rates and system functioning as a whole. For example, higher stocking rates decrease herbage allowance and, therefore, total ingestion per cow. This reduces the amount of feed available per cow, which is a key determinant of milk production.
IDEA identifies the feeding strategy that maximizes annual profit. The model is defined over 26 fortnights to provide comprehensive insight into this feeding strategy across a typical management year. There are six primary sources of feed: grazed pasture, pasture silage, maize silage, palm kernel expeller (PKE), maize grain and turnips. IDEA determines how much of each of these feeds is provided to the cow herd in a given period. Grazed pasture is the primary source of feed in NZ dairy systems, often comprising more than 0·7 of total feed eaten. Surplus pasture is ensiled on-farm during periods when feed supply exceeds feed demand, especially in spring. Maize silage can be purchased or harvested from a crop grown on-farm. PKE and maize grain are purchased, whereas turnips are grown as a crop on-farm and eaten directly, in situ, by the cows. Nitrogen fertilizer application promotes pasture growth, with the rate and timing of pasture response derived from the decision tree of Zhang & Tillman (Reference Zhang and Tillman2007). Silage, PKE and turnips complement pasture intake, and losses during harvesting and feeding are accounted for in the model. Moreover, their feeding compromises pasture intake by substitution (replacement of pasture by supplement), to a degree determined by the season, supplement type, cow liveweight and level of pasture intake (Stockdale Reference Stockdale2000). However, turnip and maize crops are not studied in the current analysis.
NZ dairy farms are rotationally grazed, with areas of the farm grazed at very high stocking densities (cows/ha) and then rested for periods of 20–100 days depending on the season. Grazing management is guided by observations of residuals (post-harvest pasture biomass levels). The primary set of decision variables that describes the grazing rotation in IDEA determines the area grazed or cut for silage to a given residual in each period. Accounting for the duration of rest since the last grazing and the residuals at the previous and current grazing or cutting events allows management to impact pasture digestibility (and therefore energy content) and growth. The model includes 26 periods, with ten alternative levels of pasture residuals. The pasture residuals range from 0·8 to 2·6 t dry matter (DM)/ha, in 0·2 t DM/ha increments. Ten levels of pasture residual are defined since this provides detailed insight into residual choice as a management decision, while keeping the model small enough to solve with the available computer resources.
Pasture growth and digestibility input for IDEA could not be taken from trial data because of the large amount of information required. Thus, a detailed simulation model of pasture dynamics (Romera et al. Reference Romera, McCall, Lee and Agnusdei2009) is extended to incorporate tissue age structure and used to compute pasture growth and digestibility. The pasture model generates pasture growth from each of the ten residuals (r i =[0·8,1, … , 2·6]) for each of the 26 periods across ten individual climate years (2000–2009) in the standard model. A mean pasture growth rate per fortnight per post-grazing residual is computed for this series of years to represent how pasture age structure (and therefore digestibility) and biomass growth can change across time due to climate conditions.
The way in which the model is used to explore the implications of fortnightly variability in relative yield between chicory and perennial ryegrass over the period 1993–2013 is described later in the current paper. This longer series of pasture growth data is only used for this sensitivity analysis, and not for any other model runs which retain the use of the 2000–2009 data. This decision is based on several judgements. Firstly, the IDEA model has been extensively calibrated using the pasture growth data for 2000–2009 (Adler et al. Reference Adler, Doole, Romera and Beukes2013; Doole & Romera Reference Doole and Romera2013; Doole Reference Doole2014): this research has been subject to peer review and hence provides greater confidence in the ability of the model to provide valuable insight into the farming systems. Secondly, the IDEA model has been validated using data for this period (Doole et al. Reference Doole, Romera and Adler2013), providing further confidence in its predictive capacity. Thirdly, use of a common time period for pasture across diverse applications increases comparability. Lastly, and most importantly, mean production in each month over 1993–1999 and 2010–2012 is not statistically different from that within the period 2000–2009, at P<0·1. This is verified using an unpaired two-sample t test with heteroscedasticity to compare the disparity in sample means (McDonald Reference McDonald2008).
A large number of cow types are defined in IDEA to allow a rich description of herd structure. Cows on NZ dairy farms are typically fed less than they can potentially consume during the year to conserve feed or allow higher stocking rates to be managed. Thus, six levels of intake regulation, in which cow intake during lactation is proportionally lower than potential, are defined in the model to help balance feed demand and feed supply. These are called underfeeding levels. Level 1 denotes that cow intake is only limited by her biophysical potential. Levels of 2, 3, 4, 5 and 6 each denote cows being fed to 0·9, 0·8, 0·7, 0·6 and 0·5 (kg/kg) of that intake used by Level 1 across lactation. There are also four age groups (1, 2, 3 and 4+lactations), nine alternative calving dates and seven lactation lengths. Cows are also defined as standard cows or those that are to be culled after lactation. Cows are culled primarily due to disease or their failure to become pregnant. The total number of these attribute combinations is 17 640 potential cow types, with each solution containing only a limited number based on the objective function of the optimization and the characteristics of the simulated scenario (e.g. calving date, milk price and level of imported feed).
The details of each attribute combination describing a given discrete cow type are determined in a large optimization model, external to IDEA. This external model is used to compute the potential intake, metabolizable energy (ME) requirement, liveweight, body condition and pregnancy rate of each cow type. The dynamic equations in this cow model are based on information from existing simulation models (e.g. Johnson et al. Reference Johnson, Chapman, Snow, Eckard, Parsons, Lambert and Cullen2008; Freer et al. Reference Freer, Moore and Donnelly2010), but are calibrated to represent NZ dairy cows. Cows are described by their liveweight and body condition in each period. Potential intake in each period for each cow type is computed as a function of age, lactation length and liveweight relative to a standard reference weight (Freer et al. Reference Freer, Moore and Donnelly2010). Energy intake is partitioned to body condition, growth, lactation, maintenance and pregnancy. Energy is obtained from feed intake and loss of body condition. The input variables for each cow type for each fortnight are used as an input into IDEA.
The number of cull cows depends on fixed rates of natural mortality and culling for disease – drawn from Villalobos-Lopez et al. (Reference Villalobos-Lopez, Garrick, Holmes, Blair and Spelman2000) – and the non-pregnancy rate computed in IDEA. Conception is based on output from the study of Roche et al. (Reference Roche, Macdonald, Burke, Lee and Berry2007). The time after calving at which a cow first starts exhibiting oestrus is based on age and body condition at calving. The empty rate is computed as a function of the number of heats exhibited during the mating period, which depends on age and changes in cow liveweight prior to mating. The age structure of the herd is determined in each solution, dependent on the cull rate and the number of calves born. The planned start of calving can either be selected by the model user or determined as an output of the optimization. Calving is distributed across an 8-week period following the start of calving.
Feed demand and supply is reconciled by two constraints. A ME constraint is defined in each period and requires total energy supply to exceed energy demand. Also, an intake constraint ensures that cows cannot consume unrealistic amounts of feed. IDEA incorporates an intake function, loosely based on the formalism of Gregorini et al. (Reference Gregorini, Romera, Beukes, Rossi and MacDonald2009), to ensure that higher stocking rates result in lower intake per cow.
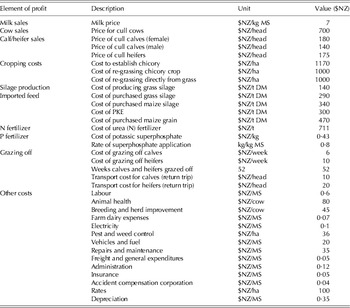
Operating profit (OP) consists of total revenue minus total cost. Total revenue is earned from the sale of milk, culled cows and excess calves and yearlings. Total cost involves the costs of silage production, cropping, re-grassing, supplements, fertilizer, labour and grazing off, among others. The elements of operating profit are presented in Table 1.
Prices for output and inputs employed within the IDEA model. All prices are specified in NZ dollars

IDEA is solved using non-linear programming in the General Algebraic Modelling System using the CONOPT3 non-linear programming solver (Brooke et al. Reference Brooke, Kendrick, Meeraus and Raman2012). The base model consists of 2000 constraints and 13 500 decision variables.
Definition of chicory in the farm-level model
The IDEA model is extended to incorporate chicory as a summer crop. All dollar values are reported in NZ dollars.
The farming year is divided into 26 fortnights, which are defined within the interval t=[1,2, … , 26]. The beginning of the farming year is July 1 (t=1).
The objective function of the model defines that the goal of the farmer is to maximize operating profit. The definition of operating profit in the current model is extended to incorporate the establishment cost of chicory ($NZ 1170/ha) and the cost of establishing pasture after the crop phase ($NZ 1000/ha).
A fixed area of the farm is allocated for pasture renovation at the start of each year. This is denoted AR. On this land, the farmer can sow turnips (TU), maize (MA), chicory (CH) or new ryegrass pasture without planting an intermediary crop (RG), where each decision variable denotes the number of hectares allocated to this land use. Growing a forage crop, such as chicory, between years of pasture is beneficial for breaking weed and disease cycles (Doole & Pannell Reference Doole, Pannell and Berklian2008) and also improves the chance that new endophytes can be established successfully in the subsequent pasture (Bluett et al. Reference Bluett, Thom, Dow, Burggraaf, Hume, Davies and Tapper2004). Pastures on a significant proportion of farms in the Waikato region are replaced each year. Bryant et al. (Reference Bryant, Lambert, Brazendale, Holmes and Fraser2010) gauged from anecdotal evidence that farmers replace pastures annually on around 0·12–0·25 of their farm area in this region, on average. However, in an extensive survey conducted in this region, Kelly et al. (Reference Kelly, Smith, Brazendale and Mercer2011) found, in a sample of 717 farmers that around three-quarters of respondents replace pastures on around 0·25 of their farm in each year. In the present paper, it is assumed that the producer renovates pasture on 20 ha (i.e. AR=20) of the 100 ha farm in each year; thus, a pasture renovation rate of 0·2 is represented. This is a sound assumption, given the range reported by Bryant et al. (Reference Bryant, Lambert, Brazendale, Holmes and Fraser2010), the survey results of Kelly et al. (Reference Kelly, Smith, Brazendale and Mercer2011), and because it allows a detailed examination of how the optimal management of chicory should change across a broad range of potential proportions of a farm being sown to this crop (0–20 ha). Indeed, chicory areas of 0, 0·05, 0·10, 0·15 and 0·20 of total farm area are evaluated in the present study.
The total area of land represented within the renovation programme in each year is partitioned among its potential uses through:
 $$AR = TU + MA + CH + RG$$
This states that the total land allocated for pasture renewal in each year must be planted in (a) turnips and then grass, (b) maize and then grass, (c) chicory and then grass or (d) go from degraded grass to renewed grass without a crop phase. Accordingly, Eqn (1) demonstrates the assumption that chicory is not grown outside of the pasture-renewal programme. Rather, any area planted to chicory displaces land planted to other crops (TU+MA) or that undergoes pasture-to-pasture renovation (RG). It is broadly understood that the costs of sowing pasture after a crop phase need not be included in the evaluation of the profitability of a new crop, if it displaces land in the pasture-renewal programme (DairyNZ 2013). The approach used in the present paper is consistent with this understanding. Indeed, because of the constraint defined in Eqn (1), it is ensured that the cost of pasture establishment is only counted once for each hectare within the total area allocated for pasture renewal (AR) in each year.
The focus of the present study is a one-season phase of chicory (i.e. sown in October and re-grassed at the end of March). This is the most common use of chicory in the Waikato region, as longer phases reduce the degree to which producers can support high stocking rates outside of the time during which chicory crops are available to stock. Also, one of the inherent problems with chicory is its lack of persistence over time; most crops are very sparse by the end of their first season (Tozer et al. Reference Tozer, Cameron, Thom and Mercer2011).
Pasture could be utilized before crops or new pasture were sown and after new pasture has successfully established following the removal of the crop(s) or degraded pasture. The area of pasture available within area AR in period t was defined through:
 $$PR_t^{} = TU_{t = [23,7]} + MA_{t = [23,7]} + CH_{t = [24,7]} + RG_{t = [23,18]} $$
where AR⩾PR t and subscripts on the right-hand side denote the periods that pasture was available on land allocated to a given crop or regrassing activity. Key dates for these activities were 5 May (t=23), 19 May (t=24), 26 August (t=5) and 23 September (t=7).
The net growth of chicory was defined through a series of equations. These involved the division of each fortnight into 14 individual days, defined across the series d=[1,2, … ,14]. Chicory was sown on 15 October (t=8) and grew for around 8 weeks before being available for grazing between 2 December (t=12) and 31 March (t=20). Pasture was re-sown on the crop area at the end of this fortnight and accessible for grazing again on 19 May (t=24).
The total stock of chicory available on the farm on day d in fortnight t was denoted CD t,dd (units of t/ha). The initial stock present on the day prior to when it could be first grazed was defined as:
 $$CD_{{\rm 11},{\rm 14}} = c_{\rm 1} CH$$
where c 1=3 denotes the initial yield (t/ha) of chicory.
The total chicory stock on the farm on the first day of any fortnight was computed through:
 $$CD_{t,1} = CD_{t - 1,14} + c_2 CH - \left[ {\displaystyle{{CF_t \left( {1 + c_3} \right)} \over {c_4}}} \right] - c_5 CD_{t - 1,14} $$
where c 2 is the daily growth of the chicory crop (t/ha), CF t is the amount (tonnes) of chicory eaten in fortnight t, c 3=0·1 is the wastage of chicory at feeding, c 4=14 is the number of days in a fortnight and c 5=0·05 is the rate of senescence, defined as a proportion of the total stock. This equation was defined for the fortnights during which chicory can be grazed (t=[12, … , 20]). The first term on the right-hand side of Eqn (4) is the stock of chicory from the previous day (the last day of the previous fortnight), the second term is the growth of the crop, the third term is the loss through grazing, and the fourth term is the loss through senescence.
Daily growth (c 2) was computed using the following process. A range of 8·8–13·8 t DM/ha for chicory production over October–March was first drawn from data arising from trials performed in the study region (Waugh et al. Reference Waugh, Clark, Harris, Thom, Copeman and Napper1998). Then, expert opinion was used to identify an appropriate estimate of production from this range, based on the assumptions that characterize the farm represented in IDEA. The assumed level of production was 12 t DM/ha. This value, higher than the midpoint of the 8·8–13·8 t DM/ha range, was chosen for several reasons. Firstly, IDEA represents the management of an above-average farmer. This is appropriate since farmlet studies typically represent above-average management and these were used extensively to provide data for the model and for validation (Doole et al. Reference Doole, Romera and Adler2013). This representation of an above-average farmer is also in line with other whole-farm models of this kind (e.g. Kingwell Reference Kingwell2011). Secondly, information regarding chicory management has developed further in the 15-year period since these trial data were obtained (e.g. Lee et al. Reference Lee, Hemmingson, Minnee, Clark and Jacobs2012). Thirdly, it was assumed that the farm has a Horotiu silt loam soil type (Hewitt Reference Hewitt1998), which is broadly distributed in the Waikato region and is also very productive. Lastly, the analysis below shows that it is not profitable to include chicory when imported feed is available, even at this higher level of assumed yield.
The daily change in the total chicory stock on the farm was computed through:
 $$\eqalign{CD_{t,d + 1} = CD_{t,d} + c_2 CH - \left[ {\displaystyle{{CF_t \left( {1 + c_3} \right)} \over {c_4}}} \right] - c_5 CD_{t,d} }$$
This equation was defined for all but the last fortnight during which chicory can be grazed (t=[12, … , 19]).
A minimum stock of chicory was maintained through the constraint:
 $$CD_{t,d} \geqslant c_6 CH$$
where c 6=1·4 is the minimum residual stock (t/ha) required to sustain the simulated growth rate.
The maximum proportion of total intake (TI, units of t per fortnight) that can consist of chicory was defined through:
 $$c_7 TI \geqslant CF_t $$
where c 7=0·6 is the maximum proportion of total intake that can consist of chicory.
The level of chicory eaten (CF t ) provides energy to the herd, subject to intake restrictions that define the physical constraints limiting the feed consumption of the herd. The energy of chicory is defined at 12 MJ ME/kg DM (Chapman et al. Reference Chapman, Nichol, Stevens, Lee and Minnee2012).
Scenarios
A number of model scenarios were used to explore the role and value of chicory in a Waikato dairy farm system. A farm area of 100 ha was used for all simulations and N fertilizer application was fixed at a typical rate of 170 kg N/ha for all simulations. Use of the same N rate introduces no bias between model runs, while also being consistent with the typical practice of farmers to apply a standard rate each year. The baseline milk price was $NZ 7·00/kg milk solids (MS).
DairyNZ (2013) defined the different production systems found in the NZ dairy industry based on the proportion of imported feed in the total diet. System 1 is a traditional pasture-based system in which no imported supplement is used. System 3 is the most common, with about 0·1–0·2 of intake (kg/kg) consisting of imported feed. System 5 is the most intensive, with about 0·25–0·4 of intake consisting of imported feed. The present study evaluates the inclusion of chicory on these three farm types, since imported feed can either replace or complement the use of a summer crop.
Five simulations were performed for Systems 1, 3 and 5. The five simulations for each system involved evaluating the impact of fixing chicory area on 0, 5, 10, 15 and 20 ha of the 100 ha farm. Throughout the present paper, the 0 ha chicory situation within each system is referred to as the baseline. Each simulation involved a planned start of calving on 15 July, unless stated otherwise.
A chicory crop is primarily a substitute for summer pasture. Thus, it is important to test how sensitive its value is to changes in its growth, relative to pasture, across time. The IDEA model studies a single year and uses average values as coefficients, in line with other whole-farm models of this kind (e.g. Kingwell Reference Kingwell2011). This is justified since it removes dependency on initial and terminal conditions, while maintaining mathematical tractability. However, plant growth can obviously vary over time. Accordingly, the value of including chicory was assessed for each year over the period 1993/94–2012/13, through varying the growth of this crop and perennial ryegrass according to predictions arising from complex simulation models describing their growth and senescence during this time. Thus, the present study provides insight into the value of chicory using both the standard approach – optimization of operating profit using temporal averages – and the derivation of operating profit based on data for individual years.
A simulation model of chicory growth (F. Li, personal communication Reference Li2012) and a simulation model of pasture growth (Romera et al. Reference Romera, McCall, Lee and Agnusdei2009) were used to estimate fortnightly rates of net growth for each species across 1993/94–2012/13. The chicory model was based on the generic PLANT module (APSIM 2014) within the APSIM program (Keating et al. Reference Keating, Carberry, Hammer, Probert, Robertson, Holzworth, Huth, Hargreaves, Meinke, Hochman, McLean, Verburg, Snow, Dimes, Silburn, Wang, Brown, Bristow, Asseng, Chapman, McCown, Freebairn and Smith2003). This implementation included estimation of a series of plant parameters and plant–environment relationships to quantify plant phenological development, canopy expansion, biomass assimilation and partitioning, tissue turnover and plant re-growth after defoliation (full model report available on request). The IDEA model was then solved for each year in the 1993/94–2012/13 period for a System 3 farm, without chicory and with chicory area fixed at 0·1 of farm area (10 ha). A System 3 farm was used because the availability of imported feed on farms is a key determinant of the value of chicory, and System 3 uses an intermediate amount of this.
Earlier calving dates can potentially improve the value of chicory by better matching the seasonal demands of lactating cows. Accordingly, the implications of an earlier (1 July) and a later (29 July) planned start of calving were explored for a System 1 farm. The same runs were also performed for Systems 3 and 5, but the optimal amount of chicory on these farms remained at 0 ha; thus, these results are not reported.
Potentially important economic drivers of the value of chicory are milk price and the cost of chicory establishment. Alternative milk prices of $NZ 6 and $NZ 8/kg MS were simulated. Moreover, the implications of changes to the cost of chicory establishment by −0·50, −0·40, −0·30, −0·20 and −0·1 ($NZ/$NZ) were computed. Only decreases in the cost of establishment were simulated because of the broad unprofitability of chicory shown in results reported in Tables 1–4. These runs were performed for Systems 1, 3 and 5 farms.
RESULTS AND DISCUSSION
Comparison between different production systems
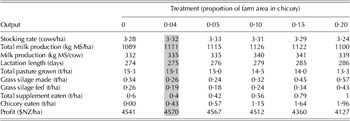
Table 2 presents key model output data for a System 1 farm in which no imported feed was used. The optimal area of chicory on the farm was 4 ha, with a stocking rate of 3·32 cows/ha and MS production of 1111 kg MS/ha, with profit declining below the baseline (no chicory) when this crop was planted on an area >0·05 of the farm (Table 2). However, the differences between key model output for a chicory area of 4 and 5 ha were minor, indicating a flat response curve in the vicinity of the optimum. This is discussed further below. The System 1 operation is the only situation in which the inclusion of chicory is profitable within the three farming systems considered. This highlights a strong level of complementarity between chicory and the existing feed base for areas of chicory planted on about 0·04–0·05 of the System 1 farm. This result is in line with the lack of imported feed in this system, as chicory can be used to promote milk production in late summer when pasture growth and quality are declining (Clark Reference Clark and Lomas1995).
Key model output data for a System 1 farm for chicory area fixed at 0 (baseline), 0·05, 0·10, 0·15 and 0·20 of the farm area. Feed quantities determined per hectare are computed through division by farm size (100 ha). The shaded column is the optimal level of chicory

Stocking rate and MS production increased as the proportion of the farm area under chicory increased from 0 to 0·05, after which point they declined. Stocking rate and MS production per hectare were about 1 and 2% higher than the baseline, respectively, at the optimal level of chicory. In comparison, stocking rate and MS production per hectare were 3 and 1% lower than the optimal level when 20 ha of chicory was planted. However, profit declined significantly, down by 10%, when moving from the optimal level of chicory (4 ha) to 20 ha. Increasing chicory area is associated with a steady increase in the total amount of supplement eaten, as more grass silage is produced and used to fill the feed gap created by the growing of chicory (Table 2). In October–November, the chicory crop is too young to be grazed, and in April–May, the new pasture following the crop is not ready for grazing. Thus, although chicory provides high-quality feed in summer–autumn, an additional cost of its use is that land allocated to chicory is unproductive for a third of the year. Accordingly, less pasture is eaten (Table 2), as crop area displaces pasture.
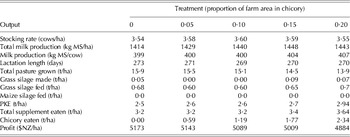
Table 3 presents key model output data for a System 3 farm in which 0·1–0·2 of the feed was imported. In this system, it was not optimal to plant chicory (i.e. baseline). Indeed, profit declined as greater areas of this crop were incorporated (Table 3). Instead, it was optimal to import feed, with about 2·5 t/ha of PKE and 0·6 t/ha of grass silage purchased in the absence of chicory. The benefit of feed importation for production is apparent, in that total MS production for the baseline (no chicory) on the System 3 farm was 30% higher than in the System 1 farm. Increasing the area of chicory from 0 to 20 ha increased both stocking rate and MS production per hectare by less than 2%. As with the System 1 farm, a higher simulated level of the chicory area increased the total level of supplement eaten, while decreasing the level of pasture eaten. Again, this demonstrates how chicory can create a feed gap while the area planted to this crop is unproductive, and requires this to be filled by costly imported feed.
Key model output data for a System 3 farm for chicory area fixed 0 (baseline), 0·05, 0·10, 0·15 and 0·20 of farm area. Feed quantities determined per hectare are computed through division by farm size (100 ha)

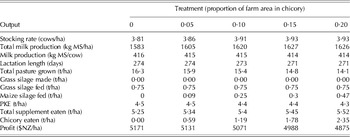
Table 4 presents key model output data for a System 5 farm in which >0·25 of feed was imported. In this system, it was not optimal to plant chicory (i.e. baseline). Indeed, profit declined as greater areas of this crop were incorporated (Table 4). The baseline solution involved a high rate of imported supplement (5·25 t/ha), which supported a stocking rate of 3·81 cows/ha and milk production of 1583 kg MS/ha (Table 4). The availability of imported supplement replaced the need for the summer crop to fill feed deficits during that period. High use of imported supplements increased MS production per cow and per hectare above that found for Systems 1 and 3. For example, baseline MS production per cow for the System 5 farm was 4% higher than System 3 and 25% greater than for System 1. Additionally, baseline MS production per hectare for the System 5 farm was 12% higher than System 3 and 45% greater than for System 1. However, this was not associated with increases in profit, as System 3 earned more profit than System 5 in each scenario. Increasing the area of chicory from 0 to 20 ha increased stocking rate and total milk production by about 3%. This contrasts with the results for the other farming systems, where production and stocking rate rose and then fell. This reflects the availability of high amounts of supplement that could be used to maintain total production (Table 4). As with the other farming systems, the total level of supplement increased with the area of chicory present (Table 4), highlighting its importance for filling the feed gap created by this crop.
Key model output data for a System 5 farm for chicory area fixed at 0 (baseline), 0·05, 0·10, 0·15 and 0·20 of farm area. Feed quantities determined per hectare are computed through division by farm size (100 ha)

Overall, the inclusion of chicory in the farm plan did not have a profit advantage for producers. Optimal use of chicory in Systems 1, 3 and 5 increased profit by 0·6, 0 and 0%, respectively (Tables 2–4). Operating profit increased by only a small amount (about $NZ 29/ha) as chicory area increased from 0 to 4 ha on the System 1 farm (Fig. 1). However, the profit decreased when greater areas of chicory were planted, as production declined due to the reduced availability of pasture and unavailability of imported supplement when the chicory paddocks could not be grazed. The largest loss observed was $NZ 443, or 10% of profit, which was experienced going from the optimal chicory area of 4 ha to an area of 20 ha (Fig. 1).
Operating profit ($NZ/ha) for different proportions of the farm planted in chicory for Systems 1, 3 and 5.

In comparison, the availability of imported supplement in Systems 3 and 5 meant that profit declined with greater areas of chicory, but the response was flatter (i.e. less costly) as supplement could be used to support the herd during feed gaps arising from the unavailability of chicory for grazing. The largest differences in profit were $NZ 289 and $NZ 296/ha for Systems 3 and 5 farms, respectively, which were observed when going from 0 ha of chicory to 20 ha within these two systems (Fig. 1). This represents 6% of operating profit in each case. This flatness in response is often found in agricultural systems, due to the general flatness of biophysical response functions in the range relevant to management and compensating factors between the many interdependent factors found therein (Pannell Reference Pannell2006). Moreover, the steep gradient of the response curve for System 1 past its highest point, compared with those for Systems 3 and 5, demonstrated that the unavailability of affordable substitutes (maize silage or PKE, but mainly the latter) that could be used in any period of the year exacerbated the cost associated with the limited availability of feed on chicory paddocks outside of their standard grazing times (Fig. 1).
Sensitivity analysis
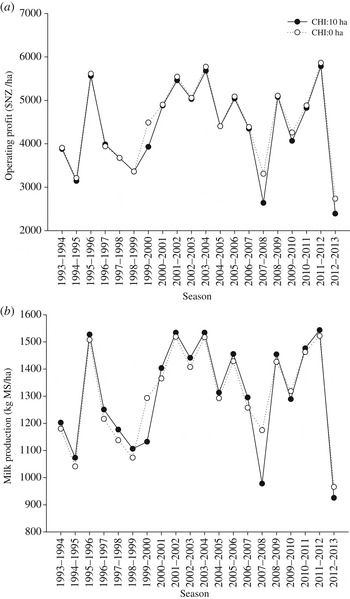
Figure 2 presents operating profit (Fig. 2a ) and milk production per hectare (Fig. 2b ) for a System 3 farm in which chicory and pasture growth per fortnight was changed to reflect those levels occurring in the period 1993/94–2012/13. The inclusion of chicory on 10 ha of the farm was only profitable in 1 year out of the 20 years in the period (Fig. 2a ). In contrast, it was an unprofitable inclusion in 16 of the 20 years (both strategies were of equal value in the remaining 3 years). The mean and standard deviation of profit for the 20-year period without chicory was $NZ 4475 and $NZ 918/ha, while that with chicory was 4358 and $NZ 994/ha, respectively. In contrast, total production was higher in 16 of the 20 years when 10 ha of chicory were included (Fig. 2b ). Thus, while chicory could increase production, these results reinforce the main theme of model output reported in Tables 2–4, through highlighting that chicory is an unprofitable inclusion on Waikato dairy farms when imported supplement is available. Also, it reveals that this output is robust to broad variation in the relative growth of chicory and pasture.
Optimal levels of (a) operating profit, and (b) milk production in a System 3 farm when pasture growth and chicory growth in each fortnight is set at the levels reported in each year across the period 1993–2013. Chicory area is fixed at 10 ha in the ‘CHI: 10 ha’ scenario, and not used in the ‘CHI: 0 ha’.

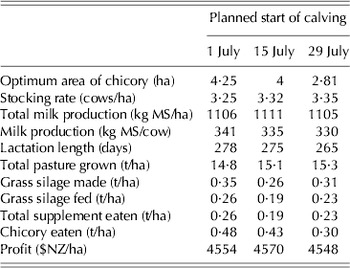
Table 5 presents key model output data from the System 3 farm model, for different assumptions regarding the planned start of calving. The baseline calving date was 15 July. An earlier calving date (1 July) increased optimal chicory area by 0·25 ha (Table 5). In contrast, the optimal area of chicory decreased by 30% with a later start of calving (29 July) (Table 5). Earlier calving promoted the greater inclusion of chicory since it allowed for a better alignment between feed demand and supply, especially given the declining quality of pasture over summer. However, both alternative calving dates yielded an economic loss, compared to the baseline planned start of calving. Moreover, chicory was never profitable to include at these alternative calving dates in Systems 3 and 5. This emphasizes the poor profitability of including chicory on Waikato dairy farms.
Key model output data for a System 1 farm for planned starts of calving of 1 July, 15 July (baseline) and 29 July. Feed quantities determined per hectare are computed through division by farm size (100 ha)

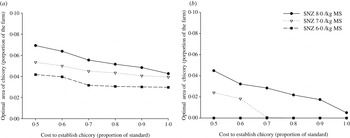
Figure 3 presents the impact of alternative milk prices and changes to the cost of establishment on the optimal area of chicory in the three farming systems. The optimal area was found to be about 0·05 (ha/ha) of the System 1 farm at a milk price of $NZ 8/kg MS, even if there were broad changes to its cost of establishment (Fig. 3a ). However, this declined at a lower milk price or with a higher cost of establishment. For example, the optimal chicory area fell by about 18 and 40% as the milk price decreased from $NZ 8/kg MS to $NZ 7 and $NZ 6, respectively, at the highest baseline establishment cost considered (Fig. 3a ). The response surfaces were much steeper for milk prices on the System 3 farm (Fig. 3b ). Chicory crops were less valuable to the System 3 farm in the simulated baseline, relative to the System 1 farm, given the availability of substitutes in the form of imported supplements. Additionally, it was never profitable to adopt chicory in System 3 at the lowest milk price considered (Fig. 3b ). In contrast, it was never optimal to adopt chicory in System 5 at any milk price simulated here, given the availability of high amounts of imported supplement therein.
Impact of changes to the milk price and the cost of establishing chicory in (a) System 1 and (b) System 3. The optimal amount of chicory in System 5 is always 0 ha.

CONCLUSIONS
The present study provides a broad evaluation of chicory as a means to support lactation through summer–autumn on pasture-based dairy farms in the Waikato region of NZ. A whole-farm model was used, given the expense of farmlet trials and the capacity of such models to provide an integrated assessment of technologies at the system level.
Overall, imported feed was shown to be more profitable for supporting lactation in periods when pasture quality and/or quantity is limiting, relative to chicory crops. This is due to flexibility in its availability that makes it ideal for filling strategic feed gaps and because it does not displace pasture production, in contrast to land where chicory is planted and upon which no feed is available over October–November. Accordingly, the current study highlights that chicory crops are of limited value for pasture-based dairy farms in the Waikato region of NZ.
One of the limitations of the study is that it does not account for certain benefits of growing chicory, due to a lack of quantitative measurements available in the literature. For example, a chicory crop provides an opportunity to break insect and/or weed life-cycles before pasture renewal. The improvement of pasture persistence and utilization associated with these benefits, and the potential flow-on effects for profit, have not been accounted for here. Considering the extent of these benefits for the value of chicory crops is therefore an important area for further research.
ACKNOWLEDGEMENTS
The authors wish to acknowledge the information and the invaluable suggestions provided by Julia Lee and Pierre Beukes. The work was funded by the Australian Research Council Centre for Environmental Decisions and New Zealand dairy farmers through Dairy NZ Incorporated.