Effective weed management is crucial in the early growth stages of sugar beet and soybean. The use of herbicides has become the primary tool for weed management in both crops. In European production systems, weed control in soybean is achieved with the combination of PRE and POST applications of selective herbicides. In soybean, metribuzin, flufenacet, dimethenamid, and clomazone are registered (Gehring et al. Reference Gehring, Festner, Gerhards, Hüsgen and Thyssen2014). In sugar beet, three POST herbicide applications are commonly performed, each one stimulated by a new cohort of weed seedlings. The crop is usually treated with mixtures of metamitron, phenmedipham, desmedipham, and ethofumesate (Vasel et al. Reference Vasel, Ladewig and Märländer2012).
Herbicides can damage crops and reduce crop yield when used at inappropriate rates or timings or in mixtures with several active ingredients and additives (Salzman and Renner Reference Salzman and Renner1992). In sugar beet, injury has been observed after applying a combination of desmedipham, phenmedipham, and triflusulfuron, resulting in a 29% reduction of sugar beet leaf area and 8% reduction of sugar beet root biomass (Wilson Reference Wilson1999). Three sequential herbicide applications with a mixture of desmedipham plus phenmedipham plus triflusulfuron plus clopyralid caused crop injury, with maximum yield losses of 15% in sugar beet, compared to a weed-free control (Wilson et al. Reference Wilson, Yonts and Smith2002). Metribuzin reduced soybean yield by 38% in a study by Belfry et al. (Reference Belfry, Soltani, Brown and Sikkema2015). The reason for crop damage due to herbicides is always a limited capacity of the crop to metabolize the herbicide before the target is reached (Smith and Wilkinson Reference Smith and Wilkinson1974), and cultivars can vary in the rate of herbicide detoxification (Moseley et al. Reference Moseley, Hatzios and Hagood1993). Phytotoxic symptoms may include temporary discoloration, reduced plant development, formation of necrotic areas on leaves, and minor changes in plant appearance (EPPO 2014). The most commonly used method for describing herbicide phytotoxicity is a simple and subjective visual estimation of the observed crop injury, often expressed as percent crop damage in comparison to a nontreated control. Yet, these results depend heavily on the experience of the assessor and are difficult to compare between assessors and locations (Andújar et al. Reference Andújar, Ribeiro, Carmona, Fernández-Quintanilla and Dorado2010). The current quantification methods for herbicide stress include assessment of crop yield and destructive sampling methods such as biomass assessment. Both can be influenced by various environmental factors during the cultivation period. More objective and rapid quantitative methods are needed for the reproducible quantification of phytotoxicity caused by herbicides.
Optical and hyperspectral sensors have been applied to measure abiotic and biotic stress in plants (Fahlgren et al. Reference Fahlgren, Gehan and Baxter2015; Fiorani and Schurr Reference Fiorani and Schurr2013; Thenkabail et al. Reference Thenkabail, Lyon and Huete2011). For example, Donald (Reference Donald1998) tested a simple RGB camera as a tool for quantifying herbicide stress in plants. Optical sensors can quantify the morphological and physiological status of plants, and thus may facilitate assessment of herbicide stress (Fahlgren et al. Reference Fahlgren, Gehan and Baxter2015; Fiorani and Schurr Reference Fiorani and Schurr2013). Different commercial sensor systems have been developed for plant phenotyping (for example, the Phenospex® FieldScan, Lemnatec Scanalyzer3D ®, or Photon Systems Instruments PlantScreen®).
A different approach for plant phenotyping is assessing chlorophyll fluorescence. This approach was introduced by Maxwell and Johnson (Reference Maxwell and Johnson2000) and described by Baker (Reference Baker2008). Chlorophyll fluorescence measurement is a nondestructive, easy, and rapid assessment method for stress evaluation that makes it possible to assess plant response to herbicides in a short time period (Baker Reference Baker2008; Burke et al. Reference Burke, Franks, Burow and Xin2010; Kaiser et al. Reference Kaiser, Menegat and Gerhards2013; Roeb et al. Reference Roeb, Peteinatos and Gerhards2015). Many herbicides with different modes of action cause increased chlorophyll fluorescence in crops shortly after application (Dayan and Zaccaro Reference Dayan and Zaccaro2012). The F v/F m value provides a measure of photosystem II (PS-II) efficiency. PS-II–inhibiting herbicides directly influence the electron transport supply in PS-II, while other herbicides indirectly disturb photosynthesis in many different ways (Kaiser et al. Reference Kaiser, Menegat and Gerhards2013).
The objectives of this study were to determine 1) if herbicides and mixtures of different herbicides cause stress in sugar beet and soybean shortly after application, 2) if herbicide stress can be measured using chlorophyll fluorescence imaging, 3) if cultivars respond differently to herbicides, 4) if crops can recover from herbicide stress, and 5) if chlorophyll fluorescence imaging data correlates with crop dry biomass 3 to 4 wk after herbicide application.
Materials and Methods
Four experiments were carried out on sugar beet and soybean plants in the greenhouse of the University of Hohenheim, Germany (48.71°N, 9.19°E; altitude 370 m), in 2015 and 2016. Each experiment was repeated in time and set up as a randomized complete block design with four replications. The soil used was a Luvisol loamy sand, placed in 10 cm by 10 cm by 10 cm pots. In each pot, one seed of sugar beet or one seed of soybean was placed at a depth of 1 cm or 4 cm, respectively. Herbicides were applied in a precision spray chamber using a flat fan nozzle (8002EVS, TeeJet® Technologies GmbH, Ludwigsburg, Germany). The spray chamber simulated an application carrier volume of 200 L ha−1. Pots were returned in the greenhouse one hour after application. The greenhouse temperature was maintained at 20 C during the day and 15 C ± 2 C at night, with a relative humidity of 70% and a 12 h light (400 µmol m−2 s−1) and 12 h dark cycle.
Experimental Design
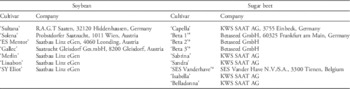
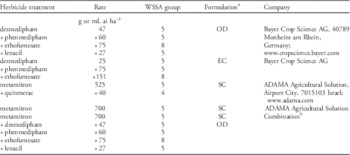
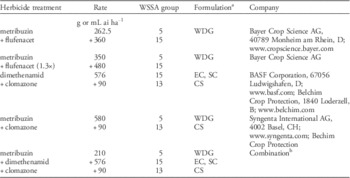
Two sets of experiments were conducted. In the first set of experiments (cultivar experiment), nine sugar beet cultivars and seven soybean cultivars were sprayed with two herbicide mixtures (Table 1). In sugar beet, the herbicides desmedipham plus phenmedipham plus ethofumesate (Betanal Expert®) and desmedipham plus phenmedipham plus ethofumesate plus lenacil (Betanal maxxPro®) were applied at the cotyledon (two-leaf) stage (Table 2). Soybeans were treated with the herbicides metribuzin (Sencor WG®) plus clomazone (Centium CS®) or metribuzin plus flufenacet (Artist WG®) before crop emergence (Table 3).
Soybean and sugar beet cultivars tested for herbicide stress response using chlorophyll fluorescence imaging.

a Anonymous labeling; cultivar in development.
Herbicide rates and active ingredients tested for sugar beet stress response using chlorophyll fluorescence imaging.

a Formulations: EC, emulsifiable concentrate; OD, oily dispersion; SC, soluble concentrate.
b Combination of commercial products from ADAMA and Bayer.
Herbicide rates and active ingredients tested for soybean stress response using chlorophyll fluorescence imaging.

a Formulations: CS, capsule suspension; EC, emulsifiable concentrate; SC, soluble concentrate; WDG, water dispersible granule.
b Combination of three commercial products from Syngenta, BASF, and Belchim.
For the second set of experiments (herbicide experiment), two cultivars (the most tolerant and the most sensitive, as observed from the previous experiment) per crop were sprayed with several herbicides and herbicide mixtures. At the cotyledon (two-leaf) stage, sugar beet cultivars ‘Capella’ and ‘Beta 1’ were treated with five herbicides and herbicide mixtures applied as individual treatments (Table 2). In soybean, cultivars ‘Gallec’ and ‘ES Mentor’ were treated with four PRE herbicides and herbicide mixtures before crop emergence (Table 3). All the above listed applications reflect typical herbicide applications performed by growers in Europe. Nontreated experimental units served as references in all experiments.
Data Collection
Crop responses to herbicides were measured with the WEED-PAM® M-Series Imaging-Sensor for measuring chlorophyll fluorescence (Heinz Walz GmbH, Effeltrich, Germany). Maximum quantum efficiency of PS-II (F v /F m ) was calculated according to Equation 1:
 $$Fv/Fm\,{\equals}\, {{Fm {\minus} F \it0} \over {Fm}}$$
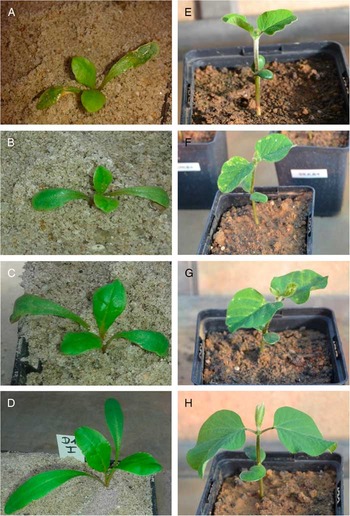
where F m is the maximal fluorescence yield and F 0 is the dark fluorescence yield (Kaiser et al. Reference Kaiser, Menegat and Gerhards2013). The sensor WEED-PAM is a mobile version of the MAXI version of the IMAGING-PAM® fluorescence meter (Heinz Walz GmbH, Effeltrich, Germany). Chlorophyll fluorescence was induced by blue light emitting diode (LED) lights of 460 nm wavelength. An optical red long-pass filter of >680 nm wavelength was mounted in front of the camera lens. The WEED-PAM software excludes background noise with a mask, as described by Kaiser et al. (Reference Kaiser, Menegat and Gerhards2013). Thus, only information from green leaves was processed. F v/F m was presented as relative values compared to nontreated control plants. After POST herbicide application, sugar beet reaction was measured 12 or 24 h after treatment, and on the 6th and 13th d after treatment (DAT), respectively, when it was at the four- to six-leaf growth stage. An extra measurement at 3 DAT was performed for the cultivar experiment. Soybean responses were assessed at the unrolled unifoliate stage and at the first and second trifoliate stages. Measurements were recorded 9, 13 (or 15), and 27 (or 28) DAT. Measurements were taken between 12:00 PM (noon) and 2:00 PM. Plant phytotoxicity was assessed per treatment and DAT, based on the European and Mediterranean Plant Protection Organization (EPPO) standard PP 1/135 concerning phytotoxicity assessment in crops, which identifies modifications in the development cycle (EPPO 2014). Figure 1 includes some representative images of plant phytotoxicity for both crops. For each pot, plant shoot and root biomass were measured as dry biomass 3 and 4 wk after sowing for sugar beet and soybean, respectively. Plants were washed and dried at 85 C for 48 h before dry biomass was measured.
Representative images of sugar beet (A–D) and soybean (E–H) plants 6 and 15 days after herbicide treatment, respectively. Fitness percentage determined using the EPPO phytotoxicity guidelines: A=50%, B=60%, C=90%, and D=100% (no phytotoxicity); E=25%, F=50%, G=75%, and H=100% (no phytotoxicity).

Data Analysis
Measurement data were subjected to an ANOVA at P ≤ 0.05. In order to evaluate the results of the experiment, a linear mixed-effect model was used. Analyses were performed with the statistics program R version 3.0.2. (R Development Core Team 2014). Years, replications (nested within years), and all interactions between these variables were considered random effects. Considering years as environmental or random effects permits conclusions about treatments to be made over a range of environments (Carmer et al. Reference Carmer, Nyquist and Walker1989). Herbicide treatments, cultivars, DAT, and their interactions were considered fixed effects. Prior to analysis, data were checked for normal distribution visually and log10 transformed. Only the biomass data of the sugar beet cultivar experiments were not transformed. For testing the significant differences a Tukey’s honest significant difference test was applied (α=0.05). In addition, linear correlation analysis was performed across all four replications of all treatments in each experiment in both years using SigmaPlot (version 12.5, SYSTAT, San Jose, CA) to determine the relationship between crop biomass and F v/F m at 1 DAT in sugar beet and at 9 DAT in soybean.
Results and Discussion
Sugar Beet Cultivar Experiment
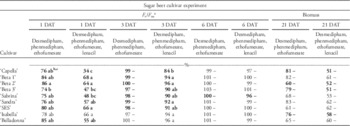
Both herbicide mixtures caused a significant decrease in F v/F m at 1 DAT. However, sugar beet plants rapidly recovered from the herbicide stress. The F v/F m values of the treated plants were equal to those of the nontreated control plants (100%) at 3 to 6 DAT (Table 4). Similar results were reported by Voss et al. (Reference Voss, Renger, Kötter and Gräber1984), Abbaspoor and Streibig (Reference Abbaspoor and Streibig2007), and Roeb et al. (Reference Roeb, Peteinatos and Gerhards2015). Herbicide stress in sugar beet was strongest 1 DAT with desmedipham plus phenmedipham plus ethofumesate plus lenacil in the cultivar ‘Capella’, with an F v/F m of only 34%. A similar herbicide mixture without lenacil had an F v/F m value of 76% 1 DAT, indicating that lenacil is the most phytotoxic ingredient in the mixture with desmedipham plus phenmedipham plus ethofumesate. Other cultivars, such as ‘Beta 1’, responded less to desmedipham plus phenmedipham plus ethofumesate plus lenacil, with an F v/F m of 68% 1 DAT. In general, the F v/F m values of ‘Capella’, ‘Beta 3’, and ‘Sabrina’ were lower compared to those of ‘Beta 1’, ‘Beta 2’, ‘SES’, and ‘Isabella’, when treated with desmedipham plus phenmedipham plus ethofumesate plus lenacil. Arndt and Kötter (Reference Arndt and Kötter1968) screened 29 sugar beet cultivars for selectivity to phenmedipham, and could not distinguish injury using visual estimation: visual estimation of injury was similar among varieties shortly after herbicide application. In our work, stress reactions in plants were detected using chlorophyll fluorescence imaging where visual estimation did not detect injury. The temporary reaction of fluorescence, which indicates a decrease in photosynthetic activity, may be caused by the herbicide either directly (interference in the electron transport chain) or indirectly (interference of protein restoration in the electron transport chain) affecting photosynthetic efficiency. Recovery to normal fluorescence within a few days indicates a functional protective mechanism that is able to restore normal electron flow. The likely mechanism is a detoxifying conversion of the active herbicide into an inactive metabolite, thus relieving the inhibitory action, which is measurable as a change of fluorescence from elevated to normal levels.
The relative maximum quantum photosystem II yield (F v/F m) and the relative biomass yield of nine sugar beet cultivars 1, 3 and 6 d after different herbicide applications.

a Abbreviations: DAT, days after treatment; F v/F m, the maximum quantum efficacy yield in photosystem II.
b Means followed by a different letter within a column are significantly different according to Tukey’s honest significant difference test (P ≤ 0.05). Means followed by a dash (–) are similar.
c Values in bold represent a significant difference based on a two-sided t test between the two herbicides within a cultivar at the same DAT.
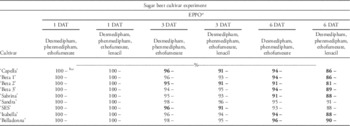
Visual assessments of injury were similar among all cultivars at 1 DAT (Table 5). Plants treated with desmedipham plus phenmedipham plus ethofumesate plus lenacil (87%) appeared to recover more rapidly, as injury was less compared to that observed with desmedipham plus phenmedipham plus ethofumesate (94%) at 6 DAT. The mixture of desmedipham plus phenmedipham plus ethofumesate reduced sugar beet biomass by 27%, and the mixture of desmedipham plus phenmedipham plus ethofumesate plus lenacil reduced biomass by 43%. Biomass was reduced for most cultivars compared to the nontreated control (Table 4). The lowest and the highest biomass yields were found in cultivars ‘Capella’ and ‘SES’ treated with desmedipham plus phenmedipham plus ethofumesate plus lenacil, which showed growth reductions of 49% and 38%, respectively, compared to the nontreated control.
The EPPO visual estimation of herbicide tolerance in nine sugar beet cultivars 1, 3, and 6 d after different herbicide applications.

a Abbreviations: DAT, days after treatment; EPPO, values of visual estimation following the European and Mediterranean Plant Protection Organization guidelines.
b Means followed by a different letter within a column are significantly different according to Tukey’s honest significant difference test (P ≤ 0.05). Means followed by a dash (–) are similar.
c Values in bold represent a significant difference based on a two-sided t test between the two herbicides within a cultivar at the same DAT.
Sugar Beet Herbicide Experiment
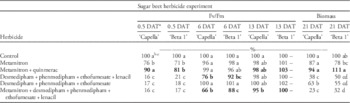
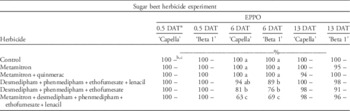
The responses of the two sugar beet cultivars to different herbicides and herbicide mixtures varied significantly. The strongest stress 0.5 DAT was measured for desmedipham plus phenmedipham plus ethofumesate plus lenacil, with 18.5% F v/F m; desmedipham plus phenmedipham plus ethofumesate with 17.5% F v/F m; and metamitron plus desmedipham plus phenmedipham plus ethofumesate plus lenacil with 16.5% F v/F m. Soil-active herbicides that are mostly taken up by the plant roots had much lower effects, with only 73.5% F v/F m after metamitron and 85.5% F v/F m after metamitron plus quinmerac (Goltix Titan®, ADAMA Agricultural Solution, Airport City, Israel), averaged across both cultivars (Table 6). Again, sugar beet recovered rapidly from herbicide stress, with a faster recovery of ‘Beta 1’ than of ‘Capella’. At 13 DAT, F v /F m of sugar beet varieties ranged from 95% to 100%, regardless of herbicide treatment. Visual estimations of herbicide stress 6 DAT ranged from 31% crop injury with metamitron plus desmedipham plus phenmedipham plus ethofumesate plus lenacil to 1% crop injury with metamitron and metamitron plus quinmerac treatments (Table 7). Sugar beet dry biomass was reduced by up to 77% compared to that of the nontreated control in the treatment of metamitron plus desmedipham plus phenmedipham plus ethofumesate plus lenacil (Table 6). Other researchers have also observed sugar beet damage after application of desmedipham plus phenmedipham plus ethofumesate plus lenacil (Smith and Schweizer Reference Smith and Schweizer1983; Starke and Renner Reference Starke and Renner1996; Wilson Reference Wilson1999).
The relative maximum quantum photosystem II yield (F v/F m) and the relative biomass yield of two sugar beet cultivars (‘Capella’ and ‘Beta’) 0.5, 6, and 13 d after different herbicide applications.

a Abbreviations: DAT, days after treatment; F v/F m, the maximum quantum efficacy yield in photosystem II.
b Means followed by a different letter within a column are significantly different according to the Tukey honest significant difference test (P ≤ 0.05). Means followed by a dash (–) are similar.
c Values bold represent a significant difference based on a two-sided t test between the two cultivars within an herbicide at the same DAT.
The EPPO visual estimation of herbicide tolerance in two sugar beet cultivars (‘Capella’ and ‘Beta 1’) 0.5, 6, and 13 d after different herbicide applications.

a Abbreviations: DAT, days after treatment; EPPO, values of visual estimation following the European and Mediterranean Plant Protection Organization guidelines.
b Means followed by a different letter within a column are significantly different according to Tukey’s honest significant difference test (P ≤ 0.05). Means followed by a dash (–) are similar.
c No differences were found between the two cultivars within an herbicide at the same DAT.
Soybean Cultivar Experiment
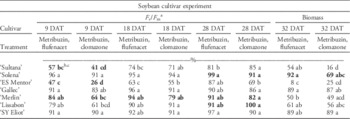
Metribuzin plus flufenacet reduced F v /F m in soybean to 78%, and metribuzin plus clomazone reduced it to 65%, compared to that of the nontreated control (Table 8). Salzman and Renner (Reference Salzman and Renner1992) observed decreased soybean leaf area after application of a metribuzin dose of 420 g ha−1 compared to that observed after a lower dose of 280 g ha−1. These findings are consistent with the results of our study. The lowest F v/F m values were measured in the cultivars ‘ES Mentor’ and ‘Sultana’ (47% and 57%, respectively), after the application of metribuzin plus flufenacet (Table 8). The F v /F m values of both cultivars were different from that of the nontreated control and from those of the most other cultivars in the metribuzin plus flufenacet treatment. At 18 DAT, both cultivars had slightly recovered, yet they continued to have reduced chlorophyll fluorescence (63% and 74% F v/F m, respectively), compared to ‘Lissabon’ (90%), ‘SY Eliot’ (92%), ‘Merlin’ (94%), ‘Solena’ (95%), and ‘Gallec’ (96%). Similar results for cultivars ‘ES Mentor’ and ‘Sultana’ were observed when treated with metribuzin plus clomazone. Even at 18 DAT, the F v/F m value of ES Mentor (55%) was substantially lower than that of ‘Gallec’, ‘Lissabon’, ‘SY Eliot’ (all 91%) and ‘Solena’ (94%). At 28 DAT, all soybean cultivars still had not fully recovered, with the lowest F v/F m values of 81% (‘Sultana’) in the metribuzin plus flufenacet treatment and 69% (‘ES Mentor’) in the metribuzin plus clomazone treatment (Table 8).
The relative maximum quantum photosystem II yield (F v/F m) and the relative biomass yield of seven soybean cultivars 9, 18, and 28 d after different herbicide applications.

a Abbreviations: DAT, days after treatment; F v/F m, the maximum quantum efficacy yield in photosystem II.
b Means followed by a different letter within a column are significantly different according to Tukey’s honest significant difference test (P ≤ 0.05).
c Values bold represent a significant difference based on a two-sided t test between the two herbicides within a cultivar at the same DAT.
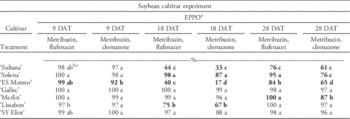
Soybean cultivars responded differently to herbicide treatment. The chlorophyll fluorescence imaging sensor can be used to quantify herbicide tolerance in different cultivars. This is of great importance for soybean breeding and practical soybean production. Barrentine et al. (Reference Barrentine, Hartwig and Edwards1982) and Osborne et al. (Reference Osborne, Shaw and Ratliff1995) also screened soybean cultivars for herbicide tolerance. They used root length and visual characteristics to determine tolerance of soybean cultivars to herbicides, and reported that different soybean cultivars vary in herbicide sensitivity. EPPO assessments of herbicide damage 18 DAT showed 74% crop injury when averaged across all cultivars and herbicides (Table 9). ‘Sultana’ and ‘ES Mentor’ were the most sensitive cultivars, with 39% and 29% injury. The herbicide mixtures metribuzin plus flufenacet and metribuzin plus clomazone reduced dry biomass by 37% and 44%, respectively (Table 8).
The EPPO visual estimation of herbicide tolerance in seven soybean cultivars 9, 18, and 28 d after different herbicide applications.

a Abbreviations: DAT, days after treatment; EPPO, values of visual estimation following the European and Mediterranean Plant Protection Organization guidelines.
b Means followed by a different letter within a column are significantly different according to Tukey’s honest significant difference test (P ≤ 0.05).
c Values in bold represent a significant difference based on a two-sided t test between the two herbicides within a cultivar at the same DAT.
Soybean Herbicide Experiment
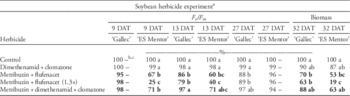
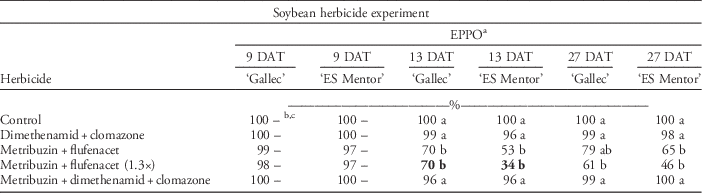
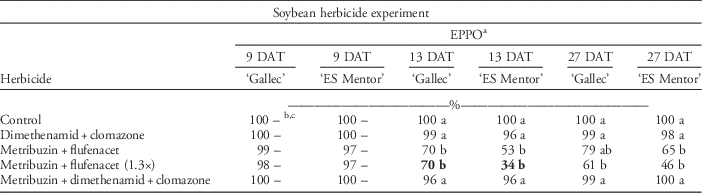
Cultivar ‘Gallec’ was more tolerant to herbicides than was ‘ES Mentor’ for all herbicide treatments. F v/F m values for cultivar ‘Gallec’ were equal for all herbicide treatments (Table 10). The F v/F m was not reduced by the application of dimethenamid plus clomazone (Spectrum® plus Centium®). The cultivar ‘ES Mentor’, however, only achieved 25% F v/F m values 9 DAT with the higher dose of metribuzin plus flufenacet. Also, plants treated with metribuzin plus flufenacet and metribuzin plus dimethenamid plus clomazone (Sencor® plus Spectrum® plus Centium®) had considerably lower F v/F m values than did plants in the nontreated control and plants treated with dimethenamid plus clomazone at 9 DAT. After a period of 28 d, soybean plants recovered and F v/F m values reached 88% (Table 10). In our study, treatments containing metribuzin resulted in the highest F v/F m yield losses in both cultivars. Poston et al. (Reference Poston, Nandula, Koger and Griffin2008) observed that plant stress increased as a result of higher metribuzin concentrations in combination with different active ingredients. It is well known that soybean cultivars exhibit different levels of tolerance to metribuzin. Cultivar-specific herbicide sensitivity stems from differing degradation capacities of cultivars (Smith and Wilkinson Reference Smith and Wilkinson1974). The metribuzin product label contains a list of sensitive crop cultivars, and for years a continuous screening of the sensitivity of new cultivars for the level of metribuzin tolerance was conducted in the United States by Mobay/Bayer Corporation. In these studies, herbicide stress was evaluated using different plant parameters such as root length, visual estimations, plant height, and comparison of yields. All the above parameters have a long assessment time span, and therefore can be affected by various environmental factors. We did not observe visual injury when assessments were recorded according to EPPO guidelines at 9 DAT (Table 11), whereas F v/F m at 13 DAT with the high rate of metribuzin plus flufenacet was 34% in cultivar ES Mentor and 70% in cultivar Gallec. In our study, chlorophyll fluorescence imaging could detect soybean response to herbicides more accurately than could visual estimations (see Tables 8–11). The dry biomass across both cultivars was reduced by 33% after different herbicide applications (Table 10).
The relative maximum quantum photosystem II yield (F v/F m) and the relative biomass yield of two soybean cultivars (‘Gallec’ and ‘ES Mentor’) 9, 13, and 27 d after different herbicide applications.

a Abbreviations: DAT, day after treatment; F v /F m , the maximum quantum efficacy yield in photosystem II.
b Means followed by a different letter within a column are significantly different according to Tukey’s honest significant difference test (P ≤ 0.05). Means followed by a dash (–) are similar.
c Values in bold represent a significant difference based on a two-sided t test between the two cultivars within an herbicide at the same DAT.
The EPPO visual estimation of herbicide tolerance in two soybean cultivars (‘Gallec’ and ‘ES Mentor’) 9, 13, and 27 d after different herbicide applications.
a Abbreviations: DAT, day after treatment; EPPO, values of visual estimation following the European and Mediterranean Plant Protection Organization guidelines.
b Means followed by a different letter within a column are significantly different according to Tukey’s honest significant difference test (P ≤ 0.05). Means followed by a dash (–) are similar.
c Values in bold represent a significant difference based on a two-sided t test between the two cultivars within a herbicide at the same DAT.
Correlation Analysis
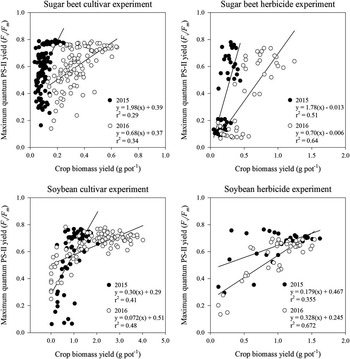
Dry biomass of different sugar beet cultivars did not correlate well with the first measurement of F v/F m at 1 DAT (R2=0.29 in 2015 and R2=0.34 in 2016) (Figure 2). In the sugar beet herbicide experiment, plant dry matter at the end of the experiment had a positive correlation (R2=0.51 in 2015 and R2=0.64 in 2016) with the first measurement of F v/F m. In the soybean cultivar experiment, the F v/F m values at 9 DAT correlated with the biomass yield, with R2 values of 0.41 and 0.48 in 2015 and 2016, respectively. The highest R2 between soybean biomass and F v/F m yield was calculated for the herbicide experiment at 9 DAT, with R2 values of 0.36 and 0.67 in 2015 and 2016, respectively. Since plants recover rapidly, biomass data 3 to 4 wk after application do not confirm herbicide stress in the same way that chlorophyll fluorescence data does shortly after application. Assessing chlorophyll fluorescence enabled differentiation of herbicide influences on the photosynthetic activity of the crop. As the influence was of short duration, biomass often does not reflect the treatment effect because differences in biomass would only occur with a more sustained treatment effect. This effect can be reduced by decelerated crop development caused by field conditions (Wilson Reference Wilson1999). For rockcress [Arabidopsis arenosa (L.) Lawalrée] plants treated with imazapyr, Barbagallo et al. (Reference Barbagallo, Oxborough, Pallett and Baker2003) found a strong relationship (R2=0.85) between leaf area and the F v/F m values of the plants.
Correlation between the maximum quantum photosystem II yield (F v/F m), 1 day after treatment in sugar beet and 9 days after treatment in soybean, and crop biomass yield (grams per pot) 3 to 4 wk after treatment for cultivar and herbicide experiments. Each data point on the graph represents one replication of sugar beet or soybean within different herbicide treatments and cultivars in 2015 or 2016.

In summary, stress was detected in both crops after herbicide application. Sugar beet had a more abrupt decrease of F v/F m shortly after application compared to that of soybean. However, sugar beet recovered from herbicide stress after a few days. Soybean, in contrast, needed a period of 28 d to recover. Soybean cultivars differed in their response to herbicides, while sugar beet cultivars reacted more uniformly.
Chlorophyll fluorescence imaging has the potential to evaluate crop stress caused by herbicide applications in sugar beet more effectively than do visual estimations, especially in the first few days after herbicide application (Tables 4–7). Assessments of F v/F m can supplement or even replace traditional estimations of phytotoxicity and herbicide selectivity in crops. The nondestructive nature of the method can make sensor measurements an important supplementary tool in herbicide evaluation. The sensor can quantify stress symptoms earlier and more accurately than can visual evaluations, according to EPPO phytotoxicity guidelines.
The current study demonstrates the use of chlorophyll fluorescence imaging to analyze the reaction of sugar beet and soybean plants to PS-II–inhibiting herbicides under controlled conditions. Since the method was successful, there are no principal obstacles preventing the use of this method on other crops or even weeds. A greater, but worthwhile, challenge may be to attempt to bring this laboratory method into the highly variable environment of practical crop production in growers’ fields. The maximum quantum yield efficiency of PS-II, which is measured with the chlorophyll fluorescence imaging sensor, provides direct information on PS-II. Yet more research needs to be done, as chlorophyll fluorescence induction can be affected by external factors like plant vigor, water stress, pathogens, or environmental conditions such as temperature. As Barbagallo et al. (Reference Barbagallo, Oxborough, Pallett and Baker2003) proposed, evaluation of chlorophyll fluorescence can be used for a broad range of herbicides with different modes of action, although the method is most easily adapted to assessing crop injury with herbicides that affect light-dependent plant processes. Those potential targets include bleaching herbicides like inhibitors of phytoene-desaturase or 4-hydroxyphenylpyruvat-dioxygenase, inhibitors of PS-I and PS-II, and inhibitors of protoporphyrinogen oxidase. Future work should focus on evaluating fluorescence analysis with herbicides that affect photosynthesis indirectly (Dayan and Zaccaro Reference Dayan and Zaccaro2012).
Acknowledgments
We thank KWS SAAT SE, Strube GmbH & Co. KG, SESVanderHave, Betaseed GmbH, and Janina Schmid from LTZ Augustenberg for providing us with sugar beet and soybean cultivars.