I. INTRODUCTION
Nanoindentation is one of the most popular experimental techniques for characterizing the mechanical properties of micro- and nanostructural materials. Since the past two decades, nanoindentation technique participates to the development of new materials, especially thin films that bring significant impacts on technology innovations and rapid growth of microelectronics, biomedical or microelectromechanical systems. An interesting review about nanoindentation measurement technique and its applications can be read in Ref. Reference Li and Bhushan1. Depth-sensing indentation method has been developed to continuously monitor penetration depth as a function of applied load during indentation test and then is now currently adopted in the characterization of the mechanical behavior of materials at small scales.Reference Pharr2, Reference Oliver and Pharr3 However, the obtained experimental data can provide only the load–displacement curve, and mechanic models are therefore required to convert the test data into the corresponding materials properties.Reference Oliver and Pharr3, Reference Loubet, Bauer, Tonck, Bec and Gauthier Manuel4 The accurate determination of mechanical properties, especially at nanometer scale, is directly related to the estimation of the true contact area between the rigid indenter and the deformed surface. The true contact area depends (i) on the estimation of the true contact depth, h c, and then (ii) on the relationship between the contact depth and the real projected contact area, A c, of the indenter used experimentally, called the indenter area function, A c = f(h c).Reference Oliver and Pharr3 All the mechanic models are usually developed according to certain assumptions, and certain imperfections (tip size, blunting effect, pile-up or sinking-in phenomena) are not considered in classical analytical models used to extract mechanical properties, such as hardness and elastic modulus. Recently, two-dimensional (2D) and three-dimensional (3D) finite element (FE) models have been developed to simulate the indentation process and then to study the effects of imperfection issues and also the influence of materials’ properties (strain hardening, residual stress, substrate effect in the case of thin films) on the load–displacement responses recorded during nanoindentation.Reference Wang, Fang and Lin5–Reference Rodriguez Pulecio, Moré Farias and Matinz Souza12 Recently, some authorsReference Chen, Li, Zhang, Cheng and Cheng11, Reference Rodriguez Pulecio, Moré Farias and Matinz Souza12 have used FE modeling to study more particularly the influence of indenter tip roundness on characteristics of the instrumented indentation curves, on the true contact depth, and then on the measured mechanical properties. To simulate a blunt indenter, a cone is fitted smoothly with a spherical cap of radius R.
In this article, after a brief theoretical analysis of nanoindentation, assuming a perfect Berkovich indenter, the calibration procedures proposed in Refs. Reference Oliver and Pharr3 and Reference Loubet, Bauer, Tonck, Bec and Gauthier Manuel4 are tested on two samples that can be considered as standard. Using the maximal applied load versus contact depth and stiffness versus contact depth curves, the tip defect is estimated and then compared to the values determined by experimental observations using atomic force microscopy (AFM). Therefore, using AFM observations, an original 3D FE solid model, considering the real tip blunting, has been developed. FE results are compared with experimental P–h curves at very shallow penetration depths obtained on Si and SiO2 samples. We demonstrate clearly for given rheological parameters the relevant effect of the tip blunting by comparison with simulations performed assuming 3D Berkovich perfect tip. Using our original approach, we are able to reproduce with accuracy the loading phases of tested material, avoiding an overestimation of the yield stress or the rheological parameters describing the strain hardening for a given constitutive law.
II. EXPERIMENTAL AND NUMERICAL DETAILS
A. Theoretical aspect
In this section, we present some theoretical aspects of nanoindentation test, assuming the elastic–plastic contact between a deformed surface and a rigid perfect Berkovich indenter, classically used for indenting specimen at very low load. During the loading phase, the relationship between the applied load, P, and the contact depth, h c, for many simple punch geometries can be described by the following equationReference Rodriguez Pulecio, Moré Farias and Matinz Souza12–Reference Malzbender, Width and Toonder14:

where C th and m are constants depending on the tip geometry and the material properties, with m = 2 for homothetic perfect indenters such as sharp cones or pyramidal indenters (no tip roundness) and m = 3/2 for spherical indenters. Recently, Pulecio et al.Reference Rodriguez Pulecio, Moré Farias and Matinz Souza12 have shown with 2D axisymmetric model that the exponent m depends on the tip rounding. The exponent m tends to 2 when the ratio R/h t (with R, the tip radius, and h t, the total penetration depth at maximum load) tends to 0 but diverges from 2 and decreases linearly to 1.83 when the ratio R/h t tends to 1. In first approximation, the exponent can be assumed to be constant with m = 2.
The constant C th can be determined by the elastic modulus, E, and the hardness, H, of the tested material.Reference Hainsworth, Chandler and Page13, Reference Malzbender, Width and Toonder14 According to the definition of the hardness H = P/A c, with  for a Berkovich indenter (α = 65.3ο),Reference Fischercripps15 the constant C th can be written as

The unloading phase is assumed to be purely elastic, almost during the beginning of the withdrawal of the indenter. Hence, according to Sneddon equations,Reference Sneddon16 the stiffness of the contact, S, between any axisymmetric indenter and an elastically isotropic half-space is given byReference Pharr, Oliver and Brotzen17
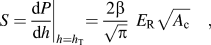
where E R is the reduced modulus and β an empirical correction factor, introduced to count for large deformation and the lack of axial symmetry when using pyramidal indenter.Reference Pharr, Oliver and Brotzen17–Reference Troyon and Lafaye19 This constant is usually set at 1.05 and 1.08.Reference Pharr, Oliver and Brotzen17 Some recent studies have found dependence of β in relation to the indenter geometry (semi-apex angle, tip defect) and Poisson’s coefficient.Reference Hay, Bolshakov and Pharr18, Reference Troyon and Lafaye19 In our study, the correction factor β is assumed to be easily neglected in first approximation and its value is set at 1. According to Eq. (3) and the definition of the projected contact area, A c, for a perfect Berkovich indenter, the previous equation can be written as follows:

where 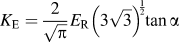 is a constant, depending on the tip geometry and the elastic properties of the tested material. Theoretical values of the constant parameter K E have been regrouped in Table I, respectively the tow-tested materials and the two experimental Berkovich used in this work.
Mechanical properties determined using the two Berkovich indenters Berko no. 1 and Berko no. 2, determined experimentally at high penetration h t = 1 μm.

According to the Oliver and Pharr method,Reference Oliver and Pharr3 considering only sinking in phenomenon during indentation, whatever the tested surface, the contact depth, h c, can be estimated from the total displacement, h, and measured during the loading phase:

where  . Recently, Hochstetter et al.,Reference Hoschstetter, Jimenez and Loubet20 using initial description proposed by Loubet et al.,Reference Loubet, Bauer, Tonck, Bec and Gauthier Manuel4 have introduced a correction factor of about 1.2, leading to the following equation for contact depth:

Such a definition of the contact depth gives more relevant experimental values of hardness and elastic modulus, when testing polymeric surfaces.Reference Hoschstetter, Jimenez and Loubet20
B. Nanoindentation tests
Nanoindentation experiments were carried out using a fully calibrated Nano Indenter XP (MTS Nano Innovation Center, Oak Ridge, TN) equipped with two Berkovich indenters (noted Berko no. 1 and Berko no. 2), with different tip radii. Tests were conducted on commercial fused silica SiO2 and single crystal Si (100) at 24 maximal peak load levels, chosen to give the penetration depth in the range of 10–1000 nm. For each peak load, at least 10 load–displacement curves were measured at different locations on the specimen surface. Results described in the different figures represent the average values of measured experimental data and the corresponding mechanical properties. Experimental data were analyzed using the Oliver and Pharr model,Reference Oliver and Pharr3 especially to estimate the contact stiffness S and then to extract the elastic modulus for each indenter and each tested material.
C. AFM measurements
An AFM was used in contact mode for all measurements of the two Berkovich indenters. This equipment uses an AFM tip mounted on an XYZ piezo scanner to scan a stationary sample mounted on a high-resolution stage. Measurements were undertaken with a close controlled temperature (23 °C). Previously, the X and Y movement was calibrated against a 2-μm pitch silicon saw-toothed artifact. In parallel, to limit the concentration of debris from indentation and dust contamination, gathering on the surface of experimental indenters, Berkovich indenter surfaces have been cleaned. Such contamination will generate some errors especially when using AFM scans first to estimate accurately the size of the tip defect and also to design a 3D geometry of the indenter. It is, therefore, important to clean the indenter surface with greater care. A specific procedure has been developed using successive cleaning step with a cotton wool swab soaked with alcohol and with polystyrene chips, and then performing indentation tests at high normal load into single aluminium crystal.
D. FE modeling
The numerical simulations of nanoindentation test were performed using the commercial MSC MARC code. The test sample used in numerical simulations of bulk materials has both a radius of 17 μm and a thickness of 20 μm to reproduce experimental tests at shallow penetration depth, less than 20 nm, but also at maximal penetration depth of h t = 600 nm. Its discretization was performed using 22176 three-linear eight-node isoparametric hexahedrons. By comparison with similar studies in literature,Reference Lichinchi, Lenardi, Haupt and Vitali7, Reference Sakharova, Fernandes, Antunes and Oliveira21–Reference Warren and Guo23 using 3D indenters assumed to be perfect or truncated with a spherical part, we have developed a specific procedure to introduce in the real tip geometry, and then the real area function of the indenter used experimentally. The model will be described in Sec. III. C. The mesh refinement of the bulk material was chosen to provide accurate values of contact area and then well adapted to the mesh of the given indenter tip. As a function of the penetration depth h t, elements located in the contact zone are cubes with sides equal to h t/6 in length, and in each FE simulation, the minimum number of elements in contact with the real Berkovich indenter at maximum penetration depth h t is greater than 600.
In first approximation, the mechanical behavior of the bulk materials Si and SiO2 is assumed to be elastic–perfectly plastic although the indenter is supposed to be purely elastic, with E i = 1141 GPa and ν i = 0.07. To reproduce the mechanical behavior of Si and SiO2, the values of elastic modulus have been fixed equal to 170 and 72 GPa, respectively, for Si and SiO2. Furthermore, the yield stress has been estimated from the hardness value, assuming a ratio H/σY close to 3. Hence, the values of yield stress have been fixed equal to 3.73 and 2.93 GPa, respectively, for Si and SiO2. In the FE computations, the contact has been modeled considering two surfaces with isotropic friction, assuming a Coulomb’s law. The friction coefficient has been arbitrary chosen equal to 0.2.
III. RESULTS AND DISCUSSION
A. Tip calibration
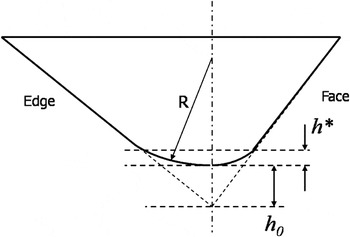
It is well known that the blunting tip defect, as schematically described in Fig. 1, affects the load–displacement curve, especially the loading phase, and also the elastic–plastic stress and strain fields beneath the indenter.Reference Wang, Fang and Lin5 Note that this effect on the elastic–plastic strain field is a real and physical effect that can not be avoided and limited by an analytical model. Hence, during the beginning of the penetration, the average plastic strain or representative strain, imposed in the influenced zone, increases progressively because of the presence of the tip defect. In parallel, the average contact pressure also increases due to both the nonlinearity of the area function in this range of contact depth and the nonlinearity of the elastic–plastic material behavior. To evidence the effect of the tip rounding on the measured indentation data as a function of applied load and the corresponding penetration depth, indentations tests have been performed using two Berkovich indenters, with different tip radii, noted Berko no. 1 (small tip defect) and Berko no. 2 (high tip defect). As described in Fig. 1, the geometry of the rounded Berkovich indenter tip is defined by two characteristics, h * and h 0.Reference Hoschstetter, Jimenez and Loubet20, Reference Gong, Miao and Peng24, Reference Panich and Yong25 The depth h * corresponds to the spherical part of the indenter in contact with deformed material surface during test. The correction depth h 0 represents the tip defect, that is, the missing portion (difference in depth) between the ideally sharp tip and the round tip of radius R.Reference Hoschstetter, Jimenez and Loubet20, Reference Gong, Miao and Peng24
Schematic description of the geometry of a truncated Berkovich indenter.

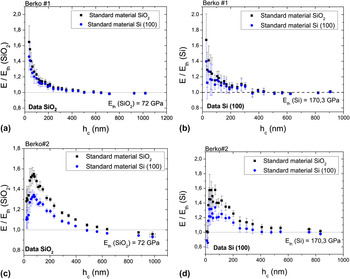
Figure 2 represents evolutions of the ratio E/E th, with E, the elastic modulus determined on specimen at a given penetration depth, and E th, the theoretical values of elastic modulus, assumed in first approximation to be equal to 72 and 170.3 GPa, respectively, for SiO2 and Si (100) samples. Table I regroups experimental values measured at high penetration depth h t = 1 μm. For each indenter, classical tip calibration procedure proposed by Oliver and Pharr and then the corresponding area function have been used to estimate the elastic modulus E, as a function of the contact depth h c, that has been calculated using Eq. (5). In our original approach, tip calibration procedure has been performed using SiO2 and Si (100) samples as standard reference materials. For each Berkovich indenter, two area functions are available, and all experimental load–displacement curves obtained on the two materials have been analyzed using the two area functions (noted standard material SiO2 and standard material Si (100) in Fig. 2). For the indenter Berko no. 1, nonimportant difference can be noted between the two materials and the two area functions. The E/E th versus h ccurves decrease progressively and tend to an asymptotic value close to 1. For a contact depth h c greater than 200 nm, the influence of the tip and then of the area function can be neglected. However, at shallow penetration depth, the area function proposed by Oliver and Pharr underestimates the projected contact area and then overestimates the measured elastic modulus. This overestimation at shallow penetration depth (less than 100 nm) is not only related to an approximated area function but also related to a bad definition of the contact depth using Eq. (5), due to the physical presence of the rounded tip. Moreover, this equation is not really adapted for contact mainly elastic, as observed for the tested materials in this range of penetration depth.
Evolution of the ratio E/E th as a function of the contact depth, for the two Berkovich indenters, and as a function of the standard material used for calibration procedure.

For the indenter Berko no. 2, evolutions of the ratio E/E th with contact depth is quite different. The observed curves can be divided into three distinct parts: (i) a rapid increase up to a maximal value, located for both SiO2 and Si (100) in the range of 75–90 nm, (ii) a step more or less pronounced as a function of the tested material, and (iii) a slow decrease to the asymptotic value. For this indenter truncated with a high tip radius, the influence of the calibration can be neglected for a contact depth greater than 450 nm. Furthermore, we may note a clear influence of the area function deduced from the calibration procedure with a gap between the E/E th versus h c curves that exceeds the experimental dispersion, especially in the decreasing part of the curves. The area function determined using SiO2 sample as standard material (E th = 72 GPa) seems to underestimate the projected contact.
These different results suggest that the influence of the tip defect extends at very high contact depth, greater than the characteristic depth h *, but depends on the elastic properties of the tested material. Concerning the tip calibration, we demonstrate that a new procedure, using a more physical area function, has to be developed by using several standard materials, with different elastic moduli. The main difficulty deals with the choice of these standard materials, to respect some assumptions (isotropic surface, stress free, nonsize effect due to microstructure, frictionless contact).
B. Determination of the tip defect
1. Analysis of the loading step
As proposed by several authors,Reference Hainsworth, Chandler and Page13, Reference Malzbender, Width and Toonder14, Reference Gong, Miao and Peng24 the tip defect or its characteristic depth, h 0, can be estimated using analysis of the load–displacement curves recorded during indentation test. It is well known that Eq. (1), with the exponent m = 2, corresponding to a perfect conical or pyramidal indenter does not reproduce correctly the evolution of the applied load as a function of the penetration h t or the contact depth h c measured experimentally.Reference Pelletier, Krier, Mille and Cornet8 Such description can only be used to describe the loading phase of load–displacement curves deduced from FE analysis using 2D axisymmetric model with an equivalent conical indenter.Reference Pelletier, Krier, Mille and Cornet8 To get a better description of the load–displacement curve during the loading phase and then account for the tip rounding, the evolution of the applied load as a function of the contact depth can be written using the following equation:

where C is the loading curvature and B is a function of the tip defect.Reference Pelletier, Krier, Mille and Cornet8, Reference Sun, Bell and Zheng26 This expression is very interesting because the contact depth tends to 0 when no load is applied. Moreover, the fitting parameter B corresponds to the initial value of the contact stiffness at h c = 0, that is, the initial slope of the load–displacement curve. A second way to describe the load–displacement curve deals with the use of the simplified indenter area function, A c = κ(h c+h d)2, as suggested in Refs. Reference Hainsworth, Chandler and Page13, Reference Malzbender, Width and Toonder14, Reference Gong, Miao and Peng24, and Reference Panich and Yong25. Using the definition of hardness, the load–displacement curve can be given by

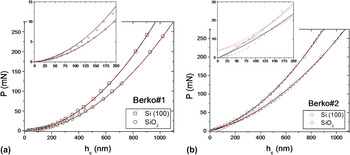
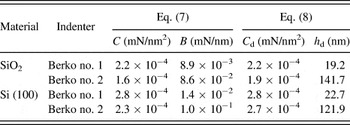
where C d is the loading curvature and h d is called the blunting distance. In first approximation, the blunting distance h d has the same physical meaning as the correction depth h 0, defined in Fig. 1. Figure 3 shows, for the Berkovich indenters Berko no. 1 and Berko no. 2, the curve of the maximum applied load versus the contact depth determined experimentally (symbols) and the corresponding fitting curves (lines) using Eqs. (7) and (8). In the case of Berkovich indenter with a small defect (Berko no. 1), the fitting curves give the same response with a good agreement with experimental data for all ranges of contact depth. The parameters C and C d corresponding to the loading curvature are similar for the two tested material, and the order of magnitude of the deduced blunting distance h d does not seem obvious (Table II). Note that the values of C and C d are close to those determined theoretically, noted C th, for a perfect indenter using Eq. (2) with the values of hardness determined at high penetration depth (see Table I).
Curves of peak load P max versus the contact depth h c determined experimentally (symbols) on SiO2 and Si (100) samples with the two Berkovich indenters Berko no. 1 and Berko no. 2. Analytical description using Eq. (7) (solid line) and Eq. (8) (dash line) to determine the load curvature and the tip defect (see Table II).


However, in the case of Berkovich indenter with an important tip defect (Berko no. 2), the fitting curve using Eq. (7) gives more relevant results for a larger range of contact depth. Using Eq. (8), at shallow contact depth, especially for h c = 0, the applied load is overestimated by the fitting curve. The loading curvatures C and C d are different and lower than the theoretical value C th for the two tested materials (Table II). Concerning the correction depth h d, even if the load–displacement curve is not well described at shallow depth, the order of magnitude seems relevant by comparison with values determined for the tip Berko no. 1.
2. Analysis of the unloading step
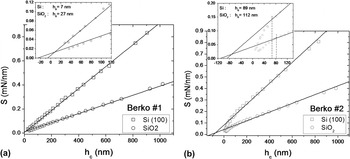
As proposed by Loubet et al.,Reference Loubet, Bauer, Tonck, Bec and Gauthier Manuel4 the second way to estimate the tip defect, that is, the depth of the missing portion of the diamond from a perfect one, deals with the use of the curves describing the evolution of the measured stiffness S as a function of the contact depth h c (Fig. 4). Note that in the initial article, the contact stiffness has to be plotted as a function of the plastic depth h r, with h r = h t−P/S. According to Eq. (6), the contact depth h c, defined using Eq. (5), and the plastic depth h r are proportional. As demonstrated by Eq. (4), for a perfect Berkovich indenter and for a material having a constant elastic modulus, such as fused silica or silicon, the relationship between the contact stiffness S and the contact depth h c is a linear function. For a real Berkovich indenter, this linear relationship is available only over a critical value of the contact depth. By extrapolating the linear part of the curve to 0 value of the contact stiffness, a negative value of contact depth can be obtained, as seen in Fig. 4. For the tip Berko no. 1, it is difficult to estimate with sufficient accuracy the critical contact depth, under which the relationship S versus h c is not linear. However, in the case of the tip Berko no. 2, the critical contact depth can be easily determined. As a function of the indented material, the critical depth varies between 68 and 82 nm, respectively, for Si (100) and SiO2. By fitting the linear part of the experimental data, using Eq. (4) and assuming, for example, an average value K E, with K E = 9.1×10⁻⁴ mN/nm for Si (100) and K E = 3.8×10⁻⁴ mN/nm for SiO2 for the tip Berko no. 2, we are able to estimate the tip defect. As a function of the tested material, we found that the value of the tip defect depends on the standard material: (i) using SiO2 as reference sample, with lower stiffness, the tip defects are about 17 nm and 112 nm, respectively, for the tip Berko no. 1 and for the tip Berko no. 2, and (ii) using Si (100) as reference sample, the tip defects are about 6 and 89 nm, respectively, for the tip Berko no. 1 and for the tip Berko no. 2 (Fig. 4). The difference observed between estimation of the tip defect using SiO2 or Si (100) samples has been already observed by Hochstetter et al.Reference Hoschstetter, Jimenez and Loubet20 They have observed that the value of the tip defect was shifted from 5 nm on fused silica to a value around 25 nm when the tip defect was measured on a polymeric surface. According to the authors, the shift is due to a specific tip–polymer interaction, leading to a systematic error about the first contact point. In our case, due to the physical and chemical properties of the tested surfaces, such an attraction effect can not be a good explanation. We suppose that the discrepancy observed about the estimation of the tip defect is mainly due to the difference in elastic modulus between the two standard materials, and the proposed indirect measurement using the S versus h c curves is mainly dependent on the elastic properties of the material. As a function of the standard material, we may think for a given indenter that we may find a specific value of the tip defect for each tested material, especially if the materials exhibit important elastic behavior.

Note that the values of the tip defect using the curves of the contact stiffness versus the contact depth are coherent with values determined with the analysis of the load–displacement curves, regrouped in Table I.
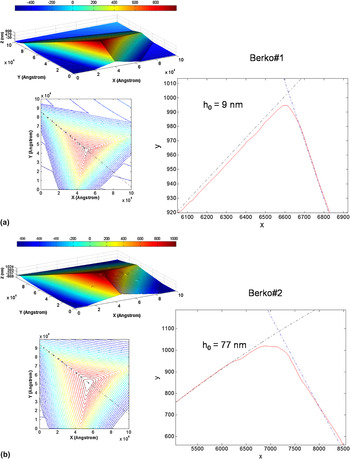
To validate the indirect methods described previously, the surfaces of the two indenters have been imaged using AFM. Such methodology has already been used by Aldrich-Smith et al.Reference Aldrich-Smith, Jennett and Hangen27 that have proposed a direct measurement of nanoindentation area by metrological AFM. In Fig. 5, we have represented 2D and 3D images of the tip Berko no. 1 and Berko no. 2. Some debris can be observed on the face of the indenter Berko no. 2. To estimate the tip defect, that is, the missing portion defined by the depth, h 0, some specific lines following the diagonal of the three-sided indenter have been extracted and extrapolated, as described in Fig. 5. Using this methodology, we have estimated the true tip defect for each experimental, with h 0 = 9 nm and h 0 = 77 nm, respectively, for the tip Berko no. 1 and the tip Berko no. 2. By comparison with values determined by indirect measurements, the method using the curve describing the stiffness as a function of the contact depth (Fig. 4), and the stiffer material seems to be the more relevant to estimate analytically the tip defect of experimental Berkovich indenter.
Atomic force microscopic observations of the Berkovich indenter tips Berko no. 1 and Berko no. 2, to identify the real tip defect, defined by the depth h 0 (see Fig. 1).

C. FE modeling
The AFM scans have been used to design the real geometry of the two experimental Berkovich indenters in FE analysis. In Ref. Reference Warren and Guo23, the authors have realized numerically the intersection between a spherical part, with radius varying between 0 and 150 nm, and a perfect three-sided indenter. They studied the influence of the tip radius on the shape of the simulated load–displacement curve, but no details were given concerning boundaries between the spherical and the pyramidal parts.
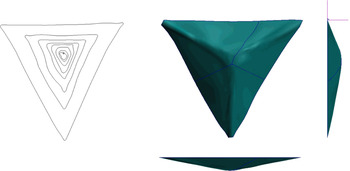
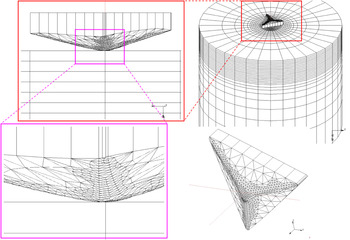
The data files deduced from AFM measurements were first imported into Matlab software to smooth the line on the face and the intersection of lines around edge regions (Fig. 6). The filtered data have been then imported into a computed-aided design software to orient properly the three faces of the indenter (especially to define the apex angle) and then to fix the length of the diagonals. The last step was to construct a complete surface of the different indenters, as shown in Fig. 6 for the tip Berko no. 2. The surface has been converted into a volume, and the discretization of this volume has been realized with a refined zone around the tip defect to ensure the convergence, as described in Fig. 7.
Short description of the main steps performed to construct the real Berkovich geometry in numerical code MSC MARC.

Description of the finite element model developed for the real tip defect determined on experimental Berkovich indenter (Berko no. 2) according to AFM observations.

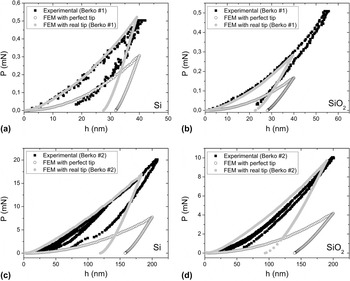
The FE model has been tested using rheological parameters identified for Si and SiO2 surface materials, assuming elastic–perfectly plastic behavior, for each real tip. The P–h curves deduced from computations have been compared at different maximum penetration depths to experimental ones and also to those obtained by finite element method (FEM) assuming a 3D perfect Berkovich indenter. Some examples of P–h curves are shown in Fig. 8 for Si and SiO2 samples at two maximum penetration depths (h t = 40 nm and h t = 200 nm). A good correlation may be observed between P–h curves during the loading phase obtained experimentally and by FEM using our new approach introducing the real tip defect, especially at shallow penetration depths less than 10 nm. Note that the bad description of the unloading phases is mainly due to the simple and unrealistic constitutive law used to describe the complex mechanical behavior of Si and SiO2 samples. When simulating the indentation process with a perfect indenter, a strong difference can be observed even for Berkovich indenter with a small tip defect [i.e., Berko no. 1 in Figs. 8(a) and 8(b)]. For higher tip defect [such as for the indenter Berko no. 2 in Figs. 8(c) and 8(d)], the difference is slightly amplified. As described in Fig. 8, the introduction of the real geometry of the indenter into FE analysis avoids an overestimation of the rheological properties of the simulated material surface.
Comparison between P–h curves obtained experimentally (black square symbols) and those deduced from numerical simulations (circle symbols) on Si and SiO2. Influence of the tip modeling.

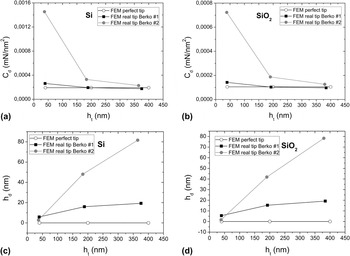
The load–displacement curves deduced from FEM for the two Berkovich indenters, Berko no. 1 and Berko no. 2, and also for a 3D perfect Berkovich indenter have been analyzed using Eq. (8). Figure 9 shows the evolution of the loading curvature C d and the tip defect h d as a function of the maximum penetration depth for the two tested materials. For the P–h curves obtained with the perfect indenter, the loading curvature C d is constant and the tip defect h d is logically equal to 0. In the case of the indenter Berko no. 1 having a small tip defect, the loading curvature C d tends to the value estimated for the perfect indenter, and for penetration depth greater than 200 nm, there is no sensitive effect of the tip defect. However, with increasing the maximum penetration depth, the tip defect h d estimated using Eq. (8) increases to tend to an asymptotic value close to 20 nm. In the case of the indenter Berko no. 2 having a bigger tip defect, the loading curvature C d decreases rapidly in a similar manner for the two simulated materials. In parallel, the estimated tip defect h d increases with the maximum penetration depth, from a value close to 0 to 80 nm. This evolution does not seem obvious and is mainly related to the mathematical shape of Eq. (8). By comparison with the analysis of experimental load–displacement curves (Fig. 3), it is interesting to note that there is no real difference about the estimation of the tip defect h d using Eq. (8) as a function of the tested material especially for indenter having an important tip defect.
Evolutions of the fitting parameters C d and h d [Eq. (8)] used to reproduce loading phase of P–h curves as a function of the penetration depth. The parameters C d and h d have been determined for both studied material on P–h curves deduced from numerical simulations for the different indenter geometries.

This study corresponds to the first step of a complete work about the sensitivity of the measured indentation parameters during loading and unloading phases but also of the estimated mechanical properties and its correlation with the tip radius effect. To reproduce nanoindentation test, we have developed a specific and original procedure to construct 3D FE models integrating the real tip defect and then the real geometry of Berkovich indenter from experimental AFM observations. Using such numerical simulations and dimensional analysis with dimensionless variables σY/E, the strain hardening exponent n, and the ratio h t/h 0, we will propose a relevant study of the materials indentation response.
IV. CONCLUSION
In this article, influence of the real indenter tip defect on measured mechanical properties of two standard materials has been studied. For two Berkovich indenters presenting different tip defects, analyses of the evolution of the ratio between measured elastic modulus and theoretical elastic modulus as a function of the contact indentation depth reveal that (i) the tip rounding may affect data at high penetration depths, depending on elastic properties of the tested material, and (ii) in the case of low depths, the important effect of the tip rounding is due to the misestimating of both the true contact area and the contact depth. Two indirect approaches to experimentally identify the tip defect are then compared. In the first one, the correction depth is determined using a new formulation of the area function and by linking the correction depth to the loading phase of the load–displacement curve. In a second approach, the correction depth is identified at low contact depth by extrapolating the evolution of the contact stiffness as a function of the contact depth for very low contact depths. Comparisons of these two approaches with AFM images of the two Berkovich indenters reveal that the second approach gives better estimations of tip defects. 3D FE simulations using real geometries of the two experimental indenters were performed and avoid the overestimation of mechanical properties of simulated materials to reproduce the loading phase of the P–h curves, especially at low penetration depth.
ACKNOWLEDGMENTS
Authors would like to thank to Dr. Philippe Kern (InESS) for his help concerning observations with AFM of Berkovich indenter tips. This work has been supported by the French ANR program MELOXEL.