Introduction
Acanthamoeba is a genus of free-living protozoa found in several environments, living as trophozoites (the vegetative stage) or cysts (the dormant, resistant stage) (Visvesvara et al., Reference Visvesvara, Moura and Schuster2007). Despite being free-living organisms, these amoebae may sometimes act as opportunistic pathogens causing serious diseases (Marciano-Cabral and Cabral, Reference Marciano-Cabral and Cabral2003).
One of the forms of human acanthamebiasis is the granulomatous amoebic encephalitis (GAE), an infection that usually occurs in immunocompromised individuals and evolves from skin lesions or previous lung involvement (Marciano-Cabral and Cabral, Reference Marciano-Cabral and Cabral2003). GAE is considered a rare infection of the central nervous system, but the real incidence is unknown due to underdiagnosis (Duggal et al., Reference Duggal, Rongpharpi, Duggal, Kumar and Biswal2017). The high current lethality of GAE (about 90%) indicates that better approaches to diagnosis and treatment are urgently needed (Kalra et al., Reference Kalra, Sharma, Shyam, Tejan and Ghoshal2020).
Acanthamoeba is also involved in a severe corneal infection that affects mainly contact lens wearers, the Acanthamoeba keratitis (AK). AK is characterized by pain, redness, tearing and photophobia, which occurs as consequences of corneal lesions that can progress to visual impairment and even blindness, if not properly treated (Trabelsi et al., Reference Trabelsi, Dendana, Sellami, Sellami, Cheikhrouhou, Neji, Makni and Ayadi2012; Lorenzo-Morales et al., Reference Lorenzo-Morales, Martín-Navarro, López-Arencibia, Arnalich-Montiel, Piñero and Valladares2013). The incidence of AK has increased in recent decades as a result of the increasing number of contact lens wearers, with lens misuse representing the main risk factor for the infection (Trabelsi et al., Reference Trabelsi, Dendana, Sellami, Sellami, Cheikhrouhou, Neji, Makni and Ayadi2012; Lorenzo-Morales et al., Reference Lorenzo-Morales, Khan and Walochnik2015). Consequently, AK has been perceived as an emerging disease worldwide (Carnt et al., Reference Carnt, Hoffman, Verma, Hau, Radford, Minassian and Dart2018; Bunsuwansakul et al., Reference Bunsuwansakul, Mahboob, Hounkong, Laohaprapanon, Chitapornpan, Jawjit, Yasiri, Barusrux, Bunluepuech, Sawangjaroen, Salibay, Kaewjai, de Pereira and Nissapatorn2019).
As well as for GAE, the correct diagnosis of AK is also a challenge. Clinical signs are very similar to other microbial keratitis caused by herpes virus and fungi, which can delay the specific treatment (Lorenzo-Morales et al., Reference Lorenzo-Morales, Khan and Walochnik2015; Szentmáry et al., Reference Szentmáry, Daas, Shi, Laurik, Lepper, Milioti and Seitz2019). Besides, the main laboratory diagnostic methods remain low sensitivity techniques such as the identification of Acanthamoeba in corneal scraping or biopsy by microscopic direct visualization or after culture, this later being considered the gold standard (Trabelsi et al., Reference Trabelsi, Dendana, Sellami, Sellami, Cheikhrouhou, Neji, Makni and Ayadi2012; Lorenzo-Morales et al., Reference Lorenzo-Morales, Khan and Walochnik2015).
Detection of Acanthamoeba by immunoassays using specific antibodies can be a promising strategy to facilitate and support AK diagnosis (Khan et al., Reference Khan, Greenman, Topping, Hough, Temple and Paget2000; Turner et al., Reference Turner, Cockerell, Brereton, Badenoch, Tea, Coster and Williams2005). In addition to this, monoclonal antibodies are an important tool in the study of protein expression and function, improving the understanding of these organisms and helping in the search for therapeutic targets (Turner et al., Reference Turner, Cockerell, Brereton, Badenoch, Tea, Coster and Williams2005; Fiori et al., Reference Fiori, Mattana, Dessì, Conti, Magliani and Polonelli2006; Kang et al., Reference Kang, Park, Shin, Khan, Maciver and Jung2018). However, the identification of new relevant targets in the context of Acanthamoeba physiology is also necessary for a better comprehension of pathogenesis, which is yet not completely understood (Neelam and Niederkorn, Reference Neelam and Niederkorn2017; Kalra et al., Reference Kalra, Sharma, Shyam, Tejan and Ghoshal2020).
Becker-Finco et al. (Reference Becker-Finco, Costa, Silva, Ramada, Furst, Stinghen, De Figueiredo, De Moura and Alvarenga2013) previously produced the monoclonal antibody mAb3, which can recognize only pathogenic Acanthamoeba isolates by enzyme-linked immunosorbent assay (ELISA), Western Blotting (WB) and indirect immunofluorescence. The present study aimed to evaluate mAb3's capacity of directly detecting Acanthamoeba trophozoites by flow cytometry and immunofluorescence conjugating it to a fluorophore. In addition, mAb3's target protein was investigated concerning its possible involvement in the encystation kinetics taking into consideration mAb3's influence in this process.
Materials and methods
Acanthamoeba strains
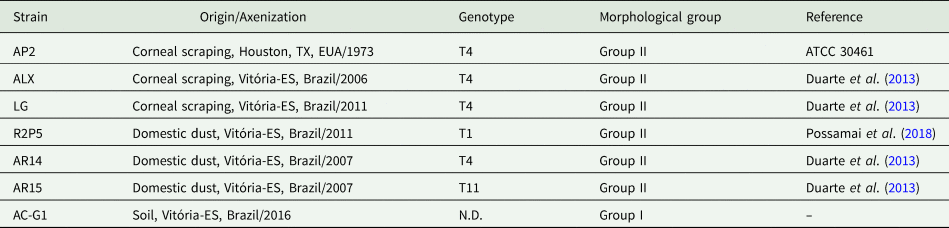
Seven strains were used in this study, three of them being clinical samples isolated from corneal scrapings of AK patients (AP2, ALX and LG) and four obtained from environmental sources, isolated from domestic dust (AR14, AR15, R2P5) and soil (AC-G1) (Table 1). Genotypes and morphological groups of the strains were previously determined as outlined in Table 1. Acanthamoeba cultures were maintained axenically in peptone, yeast extract and glucose medium – PYG (20 g L−1 proteose peptone, 1 g L−1 yeast extract, 0.1 mol L−1 glucose, 4 mol L−1 MgSO4, 0.4 mmol L−1 CaCl2, 3.4 mmol L−1 sodium citrate, 0.05 mmol L−1 Fe(NH4)2(SO4)2 and 2.5 mmol L−1 of both Na2HPO4 and KH2PO4) pH 6.5, at 28 °C, supplemented with 10% fetal bovine serum (FBS) and 1% pen/strep (solution containing 104 units mL−1 of penicillin and 104 μg mL−1 of streptomycin, Gibco).
Origin, genotype and morphological group of Acanthamoeba strains

N.D., not determined.
Monoclonal antibody (mAb3) production and purification
Hybridoma cells secreting mAb3 (Becker-Finco et al., Reference Becker-Finco, Costa, Silva, Ramada, Furst, Stinghen, De Figueiredo, De Moura and Alvarenga2013) were cultured in Dulbeco's modified Eagle's medium (DMEM) supplemented with 10% FBS and 1% pen/strep (solution containing 104 units mL−1 of penicillin and 104 μg mL−1 of streptomycin, Gibco). Cells were maintained at 37 °C, in a humidified atmosphere with 5% CO2. Cell supernatant was collected and mAb3 (IgG) purification was carried out by immunoaffinity chromatography using protein G immobilized Sepharose column. Protein concentration of samples was determined by Bradford reagent (Bio-Rad Laboratories, USA).
FITC conjugation of antibodies
The conjugation protocol of mAb3 and a nonspecific mouse IgG (LimAb7, an antibody against Loxosceles intermedia venom, Karim-Silva et al., Reference Karim-Silva, Moura, Noiray, Minozzo, Aubrey, Alvarenga and Billiald2016) to fluorescein isothiocyanate (FITC) was adapted from the manufacturer's instructions (Sigma-Aldrich, Inc). Antibodies were dialysed against carbonate buffer 0.1 m pH 9, the protein concentration was adjusted to 1 mg mL−1 and samples were mixed with FITC diluted in dimethyl sulfoxide (DMSO) (1 mg mL−1), under the following conditions: for each 1 mL of antibody solution, 50 μL of FITC solution was added very slowly under gentle stirring. The mix was incubated in the dark for 8 h at 4 °C, followed by addition of NH4Cl (50 mmol L−1), and after another 2 h, the addition of glycerol 5%. Unbound FITC was removed by gel filtration with Sephadex G25M resin. Finally, to determine the protein concentration of antibody conjugates, the absorbance of samples was measured by spectrophotometry at 280 and 495 nm wavelengths applying the formula: [IgG] (mg mL−1) = [A280−(0.35 × A495)]/1.4.
Gene sequencing of mAb3 light and heavy chain variable regions
Total RNA of mAb3 secreting hybridomas was isolated using TRIzol reagent, followed by amplification of the cDNA encoding the antibody's light (VL) and heavy (VH) variable chain sequences, by RT-PCR (reverse transcription polymerase chain reaction). Herein, the primers used for RT-PCR were VhRevU/VhForU for the heavy variable chain (VH), VkForU and VkRev1-9 for hypothetical kappa chain and VlRevU/VlForU for hypothetical lambda chain as previously reported (Fields et al., Reference Fields, O'Connell, Xiao, Lee, Billiald and Muzard2013). Confirmation of DNA fragment amplification was done by agarose (1.5%) gel electrophoresis. These fragments were purified and cloned into the PGEM T-easy vector, using T4 ligase. Competent Escherichia coli TG1 cells with the plasmids that contained the desired insert were selected, purified plasmid DNA was extracted through miniprep method, DNA concentration was measured by spectrophotometry (Thermo Scientific NanoDrop 2000) and fragment analysis was done by agarose (1.5%) gel electrophoresis. DNA purification and sequencing reaction used T7 universal primer (TAA TAC GAC TCA CTA TAG GG), performed by the 3500XL sequencer, Applied Biosystems, Genetic Analyser, following the DNA sequencing model by SANGER. Sequencing reaction times were adapted according to the protocol described by Fields et al. (Reference Fields, O'Connell, Xiao, Lee, Billiald and Muzard2013).
Protein modelling
Antibody frameworks and complementarity-determining regions (CDRs) were identified using the international ImMunoGeneTics information system (IMGT) facilities (PMID:19900967). A three-dimensional model of the variable portion of the light and heavy chains of mAb3 was predicted through homology modelling, using the ModWeb online server. The generated models were analysed through MolProbity web service (Zhao et al., Reference Zhao, Worthylake, LeCour, Maresh and Pincus2012) and optimization was performed through UCFC Chimera software 1.13.1 (Pettersen et al., Reference Pettersen, Goddard, Huang, Couch, Greenblatt, Meng and Ferrin2004).
Antigen extract preparation
To obtain protein extracts, trophozoites washed three times with Page's Saline Solution (1 mmol L−1 Na2HPO4, 1 mmol L−1 KH2PO4, 0.016 mmol L−1 MgSO4, 0.03 mmol L−1 CaCl2 and 2 mmol L−1 NaCl) (400 × g, 5 min) were incubated for 1 h at 4 °C in lysis buffer (10 mmol L−1 Tris-HCl, pH 7.6, 50 mmol L−1 NaCl, 50 mmol L−1 NaF, 1% Triton X-100 and Halt ™ Protease Inhibitor Cocktail, Thermo Scientific) (Muinao et al., Reference Muinao, Pal and Boruah2018). The suspension was centrifuged at 3000 × g for 20 min and the protein concentration of the soluble fraction was determined by Bradford assay, taking into account proper dilution of the sample to avoid interference from any of the lysis buffer components.
Sonication for protein extraction was also performed with Acanthamoeba trophozoites (1 × 10⁶) and Fusarium sp., Aspergillus sp. and Candida sp. samples, which were used to check antibody specificity. Fungi strains were provided by TAXonline (Rede Paranaense de Coleções Biológicas) and grown in Sabouraud agar medium under controlled conditions for 7 days (28 °C, 70% humidity and a 12-h photoperiod). Fungal colonies were then transferred to a tube containing a saline solution (NaCl 145 mmol L−1). Acanthamoeba and fungi samples were centrifuged, respectively at 1000 × g and 9000 × g, for 10 min, resulting pellets were washed and resuspended in 1 mL of PBS (phosphate-buffered saline) and 10 μL of protease inhibitor (Halt™ Protease Inhibitor Cocktail, Thermo Scientific). This suspension was sonicated at 4 °C, using 15 pulses of 1 min (40 V) with intervals of 30 s. The solution was centrifuged at 1000 × g for 10 min and protein concentration of the soluble extract was determined by Bradford assay.
ELISA
Acanthamoeba trophozoites antigens (10 μg mL−1) were incubated with carbonate buffer (NaHCO3 100 mmol L−1, pH 9.6) for 12–16 h at 4 °C in 96-well plates. The wells were then saturated in blocking solution (2% casein diluted in PBS) for 1 h at 37 °C. After that, antigens were incubated with a solution containing the mAb3 antibody in different concentrations (0.08–5.0 μg mL−1), nonspecific IgG (LimAb7) or polyclonal antibodies against Acanthamoeba (5.0 μg mL−1), diluted in incubation buffer (PBS, 0.25% casein, 0.05% tween 20), for 1 h at 37 °C. Followed by the addition of a horseradish peroxidase (HRP)-conjugated anti-mouse IgG (Sigma), diluted in incubation buffer 1:4000. Between each of the incubation steps, the wells were washed three times in washing solution (0.05% Tween-saline). Finally, specific antibody interactions were revealed with orthophenylenediamine solution (OPD), after 15 min the reaction was stopped with the addition of 20 μL of sulfuric acid (1:20). Absorbance was read in 490 nm wavelength.
Western blotting
Protein antigens from Acanthamoeba strains and fungi samples (1.5 or 5 μg) were separated by SDS-PAGE (sodium dodecyl sulphate–polyacrylamide gel electrophoresis) (12.5% polyacrylamide) according to the methodology described by Laemmli (Reference Laemmli1970). Migration occurred in the migration buffer (0.025 mol L−1 Tris, 0.2 mol L−1 glycine and 0.5% SDS, pH 8.3) under 100 V for 180 min. After SDS-PAGE migration, proteins were electro-transferred to a 0.22 μm polyvinylidene difluoride (PVDF) (ImmobilonTM Transfer Membranes) or 0.45 mm nitrocellulose membrane and subjected to a 24 V current for 16 h and then to a 48 V current for another hour in transfer buffer pH 8.3 (0.2 mol L−1 glycine, 0.025 mol L−1 Tris and 20% (v/v) methanol). The protein electrotransfer was confirmed by Ponceau reversible staining (0.2% Ponceau solution and 10% acetic acid). The membranes were blocked with phosphate-buffered saline (PBS) containing 0.3% (v/v) Tween 20 (PBS-T 0.3%) and 3–5% (w/v) non-fat dry milk, for 1 h at 37 °C under agitation, followed by incubation at 37 °C for 2 h with the monoclonal antibody mAb3 (0.5–5.0 μg mL−1). Between each incubation step, the membrane was washed three times in PBS-T 0.05% (v/v) for 5 min. After that, the membranes were incubated for 1 h at 37 °C under agitation, in the presence of peroxidase-conjugated anti-mouse IgG (Sigma), diluted 1:4000 or 1: 10 000 in PBS-T 0.05% (v/v). Binding of antibodies to the membranes was revealed by chemiluminescence and photographic film or by addition of PBS solution containing 0.025% 4-chlorine 1-naphthol diluted in 1 mL of methanol, 0.05% diaminobenzidine (DAB) and 0.04% H2O2 (v/v).
Tunicamycin treatment
To determine whether mAb3's target is influenced by N-glycosylation, the N-glycosylation inhibitor tunicamycin was added to Acanthamoeba cultures. Trophozoites were cultured in PYG medium with tunicamycin (10 μg mL−1) for 72 h. Subsequently, 1 × 10⁶ Acanthamoeba trophozoites were analysed by indirect flow cytometry, under treatment conditions or not, against 125 μg mL−1 of mAb3 and Alexa Fluor 488 goat anti-mouse IgG [H + L] conjugate Antibody (Molecular probes®) (1:300).
Immunoprecipitation and purification of the mAb3 target protein
The antibody mAb3 was incubated in a column with immobilized protein A and G Sepharose (Protein A and G Sepharose 4 Fast Flow – GE Healthcare) (1 mg mAb3 per 200 μL of protein A and 200 μL of protein G sepharose), for 1 h at room temperature under constant agitation. Sequential washes were performed with PBS pH 7.4 and pH 8.0 (two washes) followed by centrifugation at 28.500 × g for 6 min. Dimethylpimelimidate (DMP) 13 mg mL−1 was added to establish a stable link (crosslinking) between the mAb3 antibody and recombinant A and G proteins, dissolved in 0.2 mol L−1 triethanolamine pH 8.2 (1:1) with volume resin (VR) which was incubated for 30 min under agitation. Ethanolamine 0.1 m pH 8.2, was added (1:1) with the VR, for 5 min and centrifuged. Two washes and centrifugation steps were performed, one with ethanolamine and one with PBS pH 7.4. And 0.1 m glycine pH 2.7 was incubated twice for 5 min followed by new centrifugation. Finally, the pH was restored with PBS pH 7.4 and the column stored in PBS-0.05% sodium azide at 4 °C. All incubation steps were performed at room temperature, while centrifugations were performed at 4 °C. To purify mAb3's target protein, Acanthamoeba spp. sonicated extract was incubated for 24 h with the previously prepared affinity column. After 10 washes with PBS pH 7.4, the protein was eluted with 0.1 mol L−1 glycine pH 2.7, protein concentrations of all eluted fractions were tested by Bradford assay and the selected fractions were separated and dialysed in PBS pH 7.4. The procedure for immunoprecipitation and purification of the mAb3 target protein was adapted from the Abcam® Crosslinking Protocol – Procedure for crosslinking the antibody to beads.
Analysis by mass spectrometry (MS) and amino acid sequence alignments
The purified mAb3 target protein was resolved by SDS-PAGE (12.5% polyacrylamide gel), stained with silver and the resulting bands were excised and analysed by MS Platform-PR, Carlos Chagas Institute – Fiocruz. Half of the mass sample eluted from the gel was injected into the Thermo Easy-nLC 1000 chromatograph. The peptides were separated using a 60 min linear gradient of 5–40% acetonitrile, 5% DMSO, 0.1% formic acid in a 15 cm analytical column, with an internal diameter of 75 μm and C18 particles of 3 μm, heated to 60 °C. The peptides were ionized by nano electro spray (voltage of 2.7 kV) and injected in the LTQ Orbitrap XL ETD mass spectrometer (Thermo Scientific). The method of analysis was as follows: initial scan on the Orbitrap with a resolution of 15 000, followed by the selection of the 10 most intense ions, which were fragmented by collision-induced dissociation (CID) and analysed on the ion trap. Parallel to MS2, a full scan was performed at Orbitrap with a resolution of 60 000. In selecting the ions, a 90-s exclusion list was used. The lock mass option was used to obtain better accuracy – error below 0.5 p.p.m. – mass of the triptych precursor peptides detected by MS. The resulting data were processed using PEAKS software. Employing de novo peptide sequencing, the most abundant peptides were identified and searched against Acanthamoeba protein databases through a basic local alignment search tool (BLASTP).
Protein sequences were obtained from the UniProt database. Sequence alignments and per cent identity analyses were performed using EMBL-EBI's Clustal Omega.
Flow cytometry
For Acanthamoeba detection by indirect flow cytometry (IFC), 1 × 10⁶ trophozoites of each isolate were fixed with paraformaldehyde 4% for 20 min, blocked with albumin 1% for 1 h, incubated with mAb3 (125 μg mL−1) for 12 h at 4 °C and then mixed with Goat anti-Mouse IgG (H + L), Alexa Fluor 488 conjugate Antibody (Molecular probes®) (1:300) for 1 h, in between each step, cells were washed three times with PBS. Trophozoites treated only with the anti-mouse IgG conjugate (to verify non-specific binding), and with no antibodies were used as negative controls. Fluorescence of the samples was measured by BD FACSCalibur™ flow cytometer, using the FL1-H filter (488 nm).
For direct flow cytometry (DFC), trophozoites of different strains were harvested, fixed with paraformaldehyde 2% for 30 min and blocked with albumin 1% for 1 h, between each step, cells were carefully washed in PBS once. Then, for each isolate, in duplicates, 3 × 10⁴ trophozoites were counted using the Neubauer counting chamber and incubated with FITC-conjugated mAb3 (mAb3-FITC) (20 μg mL−1) for 90 min at 37 °C (except for isolate AC-G1, which would burst under these conditions, so the incubation was done at room temperature). After that, trophozoites were centrifuged, resuspended in 400 μL of PBS and transferred to flow cytometry tubes for analysis. As negative controls, instead of the mAb3-FITC incubation step, trophozoites were either incubated with no antibodies to determine their autofluorescence or with FITC-conjugated nonspecific IgG (20 μg mL−1). The fluorescence intensity of all samples was measured by BD FACSCelestaTM flow cytometer, using the 530-30 filter.
For both indirect and direct detection protocols, different concentrations of mAb3 were tested before settling for the one which yielded the best results. All flow cytometry data were analysed using Flowing Software.
Direct immunofluorescence
A portion (200–300 μL) of the same samples prepared for direct flow cytometry (DFC) analysis, was concentrated by centrifugation at 2700 × g for 5 min and resuspended in PBS (20 μL) mixed with Fluoromount™ (2 μL). After that, 10 μL of the cell suspension was pipetted on glass slides in duplicates and covered with coverslips. The slides were observed under confocal fluorescence microscopy (Nikon A1R MP, NIKON Instruments Inc., Japan) and the resulting images were analysed using Fiji software.
Encystation assays
To evaluate the influence of mAb3 in Acanthamoeba encystment, the reference strain AP2 (ATCC 30461) was used. Initially, the kinetics of encystment was determined by inducing trophozoites to encyst in vitro using a protocol adapted from Da Rocha-Azevedo and Costa e Silva-Filho (Reference Da Rocha-Azevedo and Costa e Silva-Filho2007). Briefly, trophozoites were harvested from cultures, washed twice in Page's saline (400 × g, 5 min) to remove PYG medium and resuspended in Neff's encystation saline (NES) (95 mmol L−1 NaCl, 5 mmol L−1 KCl, 8 mmol L−1 MgSO4, 0.4 mmol L−1 CaCl2, 1 mmol L−1 NaHCO3 and 20 mmol L−1 Tris-HCl, pH 9.0). Trophozoites were then distributed in 24-well culture plates (2.5 × 10⁴ trophozoites in 1 mL of NES per well). At regular time intervals, the cells were observed under inverted light microscopy and at least 170 cells in 3 random microscope fields per well were analysed. The percentage of trophozoites, precysts and mature cyst was recorded. The main criteria to categorize the trophozoites was the presence of acanthapodia, while mature cysts were identified by the double cell wall. Smooth spherical cells with a single wall were classified as pre-cysts (Lorenzo-Morales et al., Reference Lorenzo-Morales, Kliescikova, Martinez-Carretero, De Pablos, Profotova, Nohynkova, Osuna and Valladares2008; Chávez-Munguía et al., Reference Chávez-Munguía, Salazar-Villatoro, Lagunes-Guillén, Omaña-Molina, Espinosa-Cantellano and Martínez-Palomo2013).
To evaluate the effect of mAb3 on the encystation process, mAb3 diluted in PBS was added to the encystation medium in the wells at a final concentration of 1, 5, 10 and 30 μg mL−1. As negative controls, trophozoites in NES were treated with PBS and with nonspecific antibodies at 1, 5, 10 and 30 μg mL−1. Wells were observed after 4, 8, 12 and 24 h and the percentage of different stages of encystation was determined as described above. Precyst formation rate between observation times t1 and t2 was also determined as follows, based on principles discussed by Olli et al. (Reference Olli, Neubert and Anderson2004): (% trophozoites in t1 – % trophozoites in t2).
Statistical analysis
All statistical analyses were performed using GraphPad Prism 8.0.1, using two-way ANOVA, with Tukey's post hoc test. P < 0.05 was considered statistically significant.
Results
mAb3's variable sequences were confirmed as a functional murine immunoglobulin
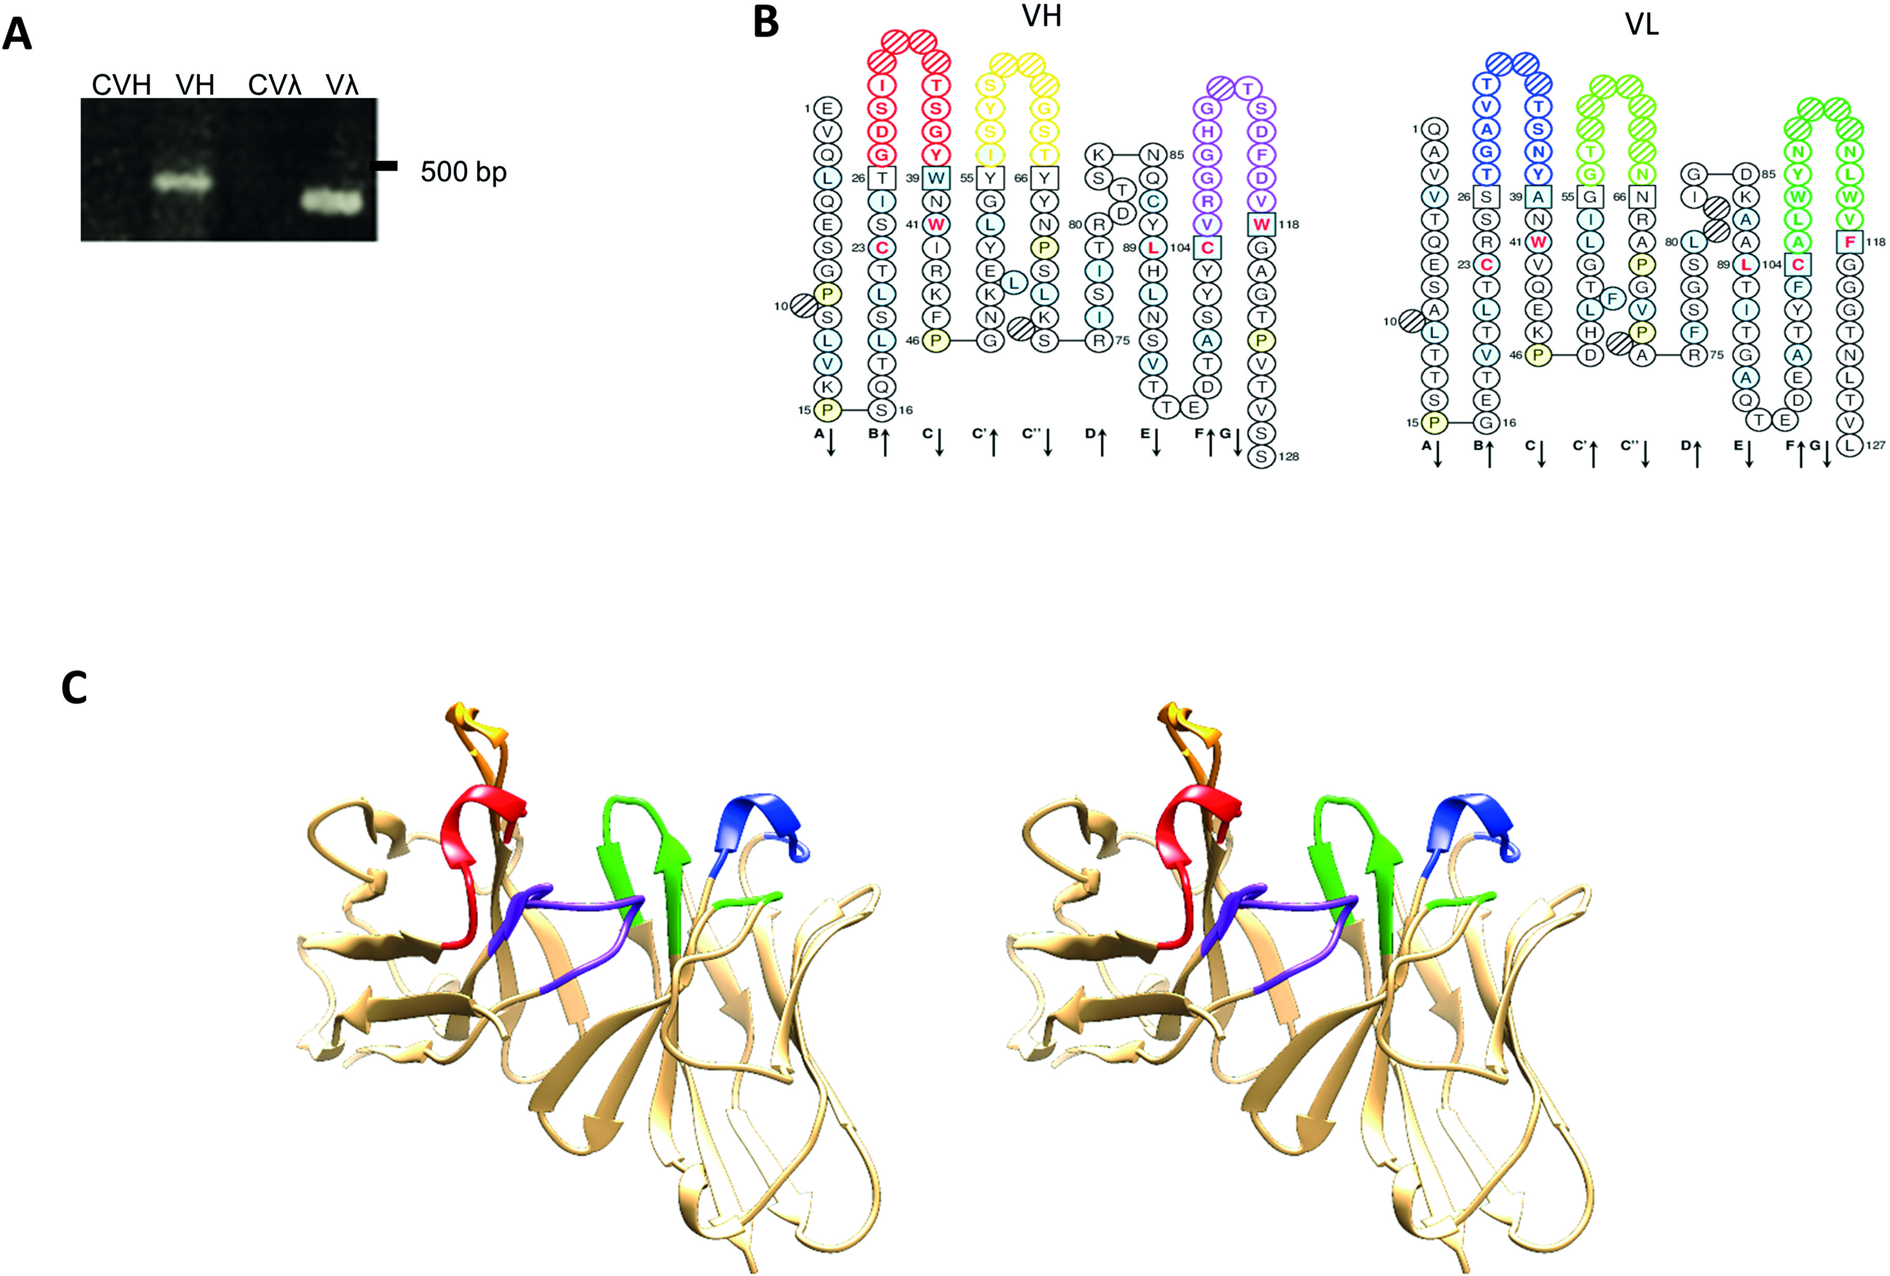
Antibody-secreting hybridomas specific against Acanthamoeba antigens were produced by Becker-Finco et al. (Reference Becker-Finco, Costa, Silva, Ramada, Furst, Stinghen, De Figueiredo, De Moura and Alvarenga2013), including mAb3. The cells of interest were defrosted and remained secreting reactive antibodies when cultivated in optimal conditions. Before functional characterization of mAb3, the RNA was extracted from the hybridomas and the regions of interest were sequenced to confirm that the molecule under study corresponds to a functional murine immunoglobulin sequence. Figure 1A shows single bands of around 350 bp, analysed by electrophoresis, of the RT-PCR products that encode the VH and Vλ regions. No amplicon was observed when using sets of kappa chain-specific primers, indicating that the hybridoma transcript does not produce any functional kappa chain transcripts. Sequencing and in silico analyses indicated that mAb3 IGH-V and IGL-V sequences were unique. Complementary determining regions (CDRs) framework was identified using the IMGT tools. No key conserved residues were mutated in the framework regions, suggesting that the sequences were correctly rearranged and functional. The VH gene belonged to the IGHV3 murine family and exhibited 96.8% protein sequence identity with Mus musculus IGHV3-8*02, whereas the VL gene belonged to the IGLV1 family with 97.9% identity to M. musculus IGLV1*01. Figure 1B and C represent the ‘collier de perles’ and structural model of the mAb3V-domains, respectively.
mAb3V-domains. (A) Agarose gel electrophoresis (1.5%) showing amplification of the antibody's variable heavy chain sequence (VH) with 400 bp and of the lambda light chain sequence (Vƛ) with 350 bp and their respective negative controls (CVH and CVƛ) without the addition of cDNA. (B) Secondary structure representation of the variable region sequences in the ‘collier de perles’ analysed by the IMGT and coloured following their colour menu. Heavy (H) and light (L) chain CDRs in red (H1), orange (H2), purple (H3), blue (L1), light green (L2) and forest green (L3); positions in light blue show amino acids with positive values in the hydropathy index or a tryptophan (W); amino acids shown in red letters correspond to conserved positions of a V-domain; anchor positions are shown in squares; hatched circles indicate gaps according to the unique numbering for V-domains by the IMGT; positions in light yellow show prolines (P); β-strands and their directions indicated by the arrows. (C) Stereo view of three-dimensional structure of the heavy and light variable regions, with coloured CDRs as specified by the IMGT colour menu, the same as previously described.

Mab3 specifically recognizes antigens from pathogenic Acanthamoeba by ELISA and WB assays
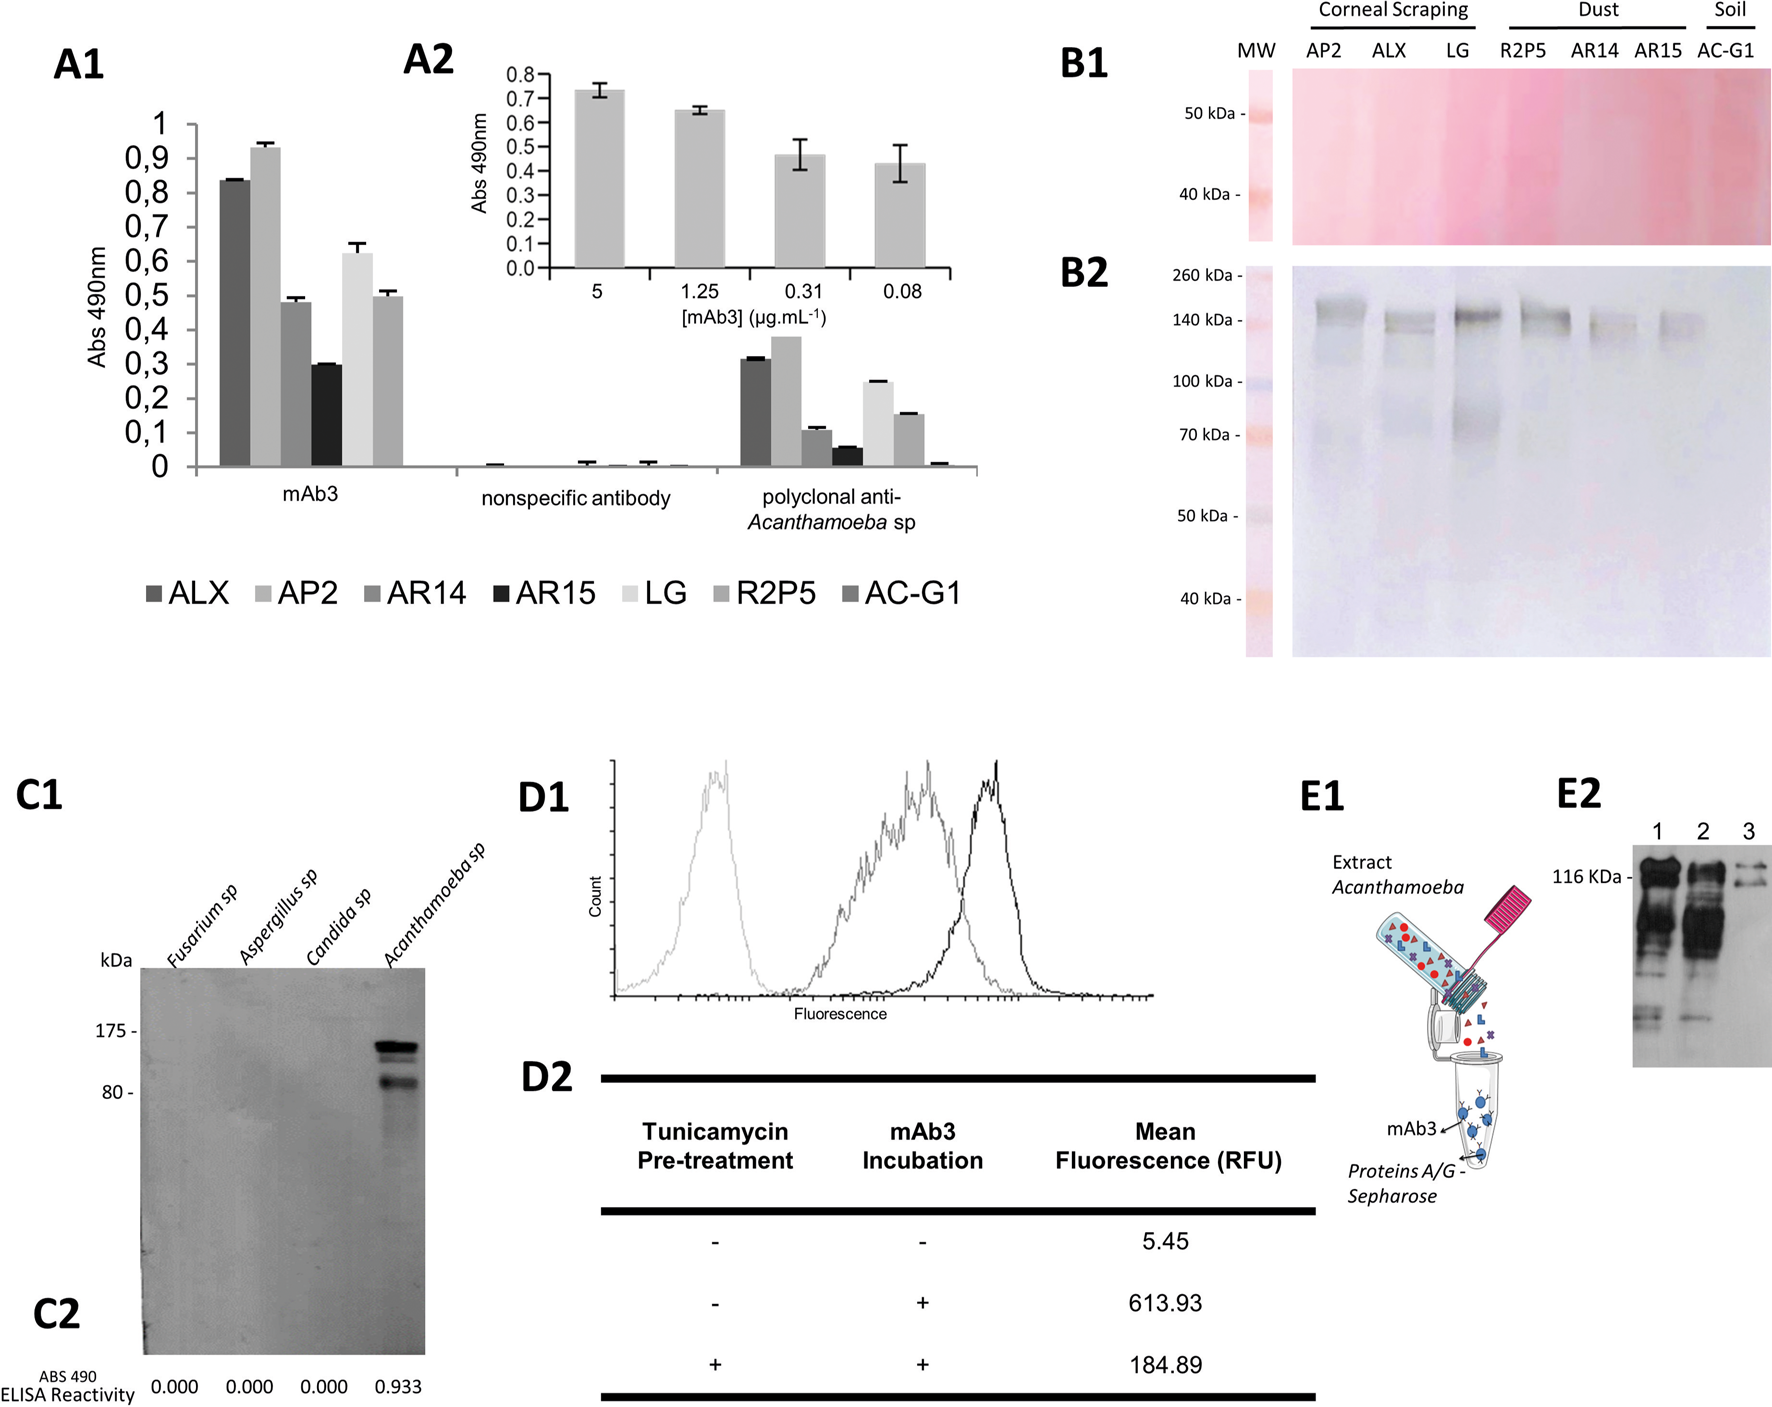
The ability of mAb3 to recognize antigens from Acanthamoeba strains was demonstrated by ELISA and WB assays. In an indirect ELISA, mAb3 was capable of recognizing only antigens from Acanthamoeba strains with pathogenic potential, and in a dose-dependent manner (Fig. 2A). This recognition pattern was also observed by WB as shown in Fig. 2B, in which a band corresponding to the high mass component is recognized in six of the seven samples tested. mAb3 did not recognize components present in the AC-G1 isolate in any of the assays. The capacity of mAb3 to recognize antigens from other agents responsible for causing keratitis was also investigated. No cross-reactivity was detected, proving mAb3 specificity by WB and ELISA (Fig. 2C).
mAb3 characterization. (A1) Indirect ELISA showing reactivity of mAb3 antibody (5 μg mL−1) or irrelevant monoclonal antibody and polyclonal antibodies (1:100) against ALX, AP2, AR14, AR15, LG, R2P5 and AC-G1 Acanthamoeba strains sonicated antigens (10 μg mL−1), immunocomplexes were revealed using HRP-conjugated anti-mouse IgG (1:4000). (A2) Indirect ELISA showing different concentrations of mAb3 antibody reactivity against strain AP2 (10 μg mL−1). (B) WB of AP2, ALX, LG (clinical samples from corneal scrapings of AK patients), R2P5, AR14, AR15 (environmental samples from dust) and AC-G1 (environmental sample from soil) protein extract (5 μg) (obtained with lysis buffer) in nitrocellulose membrane stained by Ponceau (B1), followed by incubation with mAb3 (1.5 μg mL−1) (B2), immunocomplexes were revealed using HRP-conjugated anti-mouse IgG (1: 10 000) and DAB/chloronaphthol staining. (C) Reactivity of mAb3 against 1.5 μg of Fusarium sp., Aspergillus sp., Candida sp. and Acanthamoeba sp. sonicated antigens assayed by WB (C1) and indirect ELISA (C2). In WB, proteins were transferred to a PVDF membrane, incubated with 5 μg mL−1 of mAb3 and HRP-conjugated anti-mouse IgG (1:4000); reaction was revealed by chemiluminescence detection). Indirect ELISA was performed with 10 μg mL−1 of antigen against 5 μg mL−1 of mAb3. (D1) Indirect flow cytometry histogram of strain ALX previously treated with tunicamycin incubated with mAb3 (dark grey), untreated ALX incubated with mAb3 (black), untreated ALX without mAb3 (light grey). (D2) Mean fluorescence intensity of events detected by indirect flow cytometry of ALX with (+) or without (−) tunicamycin pre-treatment and mAb3 incubation, quantified in relative fluorescence units (RFU). (E1) Schematic representation of mAb3 immunoprecipitation of target protein. (E2) WB of Acanthamoeba sp. sonicated total protein extract (1.5 μg) (1); flow through fraction (2) and eluted fraction of immunoprecipitation assay (3). Antigens were transferred to PVDF membrane incubated with mAb3 (5 μg mL−1) and HRP-conjugated anti-mouse IgG (1:4000), and the reaction was revealed by chemiluminescence detection.

mAb3's target undergoes N-glycosylation and has homology to CPA (Cation: Proton Antiporter) superfamily
Tunicamycin, an N-glycosylation inhibitor, was added to the Acanthamoeba's culture medium to determine if mAb3's target undergoes N-glycosylation. This was confirmed in a flow cytometry experiment, as shown in Fig. 2D, in which peak displacement suggested a decrease in mAb3 reactivity, probably influenced by disruption of N-glycosylation.
Immunoprecipitation assays with Acanthamoeba (AP2) antigens were performed in order to isolate the specific target recognized by mAb3. The eluate sample was analysed by WB, which indicated the isolation of the target protein (Fig. 2E). MS analysis via de novo sequencing, based on the most abundant peptides, suggests that the excised sample is homologous to a transporter, a membrane protein part of the CPA2 (Cation: Proton Antiporter2) family. Figure 3 shows the sequence of the supposed mAb3 target and highlights the conserved motif involved in antiporter function, as well as the percentage of identity with other proteins of the CPA2 family.
Multiple amino acid sequence alignment of CPA2 family antiporters, L8HBJ5_ACACA, L8H7S3_ACACA and L8H9U2_ACACA from Acanthamoeba castellanii, Q5SIA2_THET8 from Thermus thermophilus and A0A4S5A442_ECOLI from Escherichia coli. Conserved motif (grey box) involved in antiporter function. The last column shows per cent identity of each sequence when compared to L8H7S3_ACACA, the supposed mAb3 target. Peptide (TVSLPR) found in the mass spectrometry analysis of mAb3's purified target protein (transparent box). Asterisks (*) indicate positions with a fully conserved residue, colons (:) indicate conservation of residues belonging to groups with highly similar properties scoring >0.5 in the Gonnet PAM 250 matrix and periods (.) indicate conservation of residues belonging to groups with weakly similar properties scoring ⩽0.5 in the Gonnet PAM 250 matrix.

Flow cytometry and immunofluorescence assays confirmed mAb3's reactivity against pathogenic strains
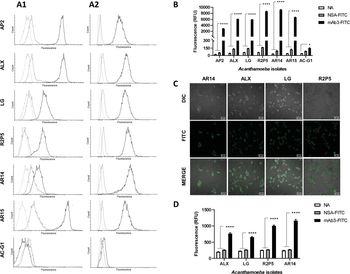
The reactivity of mAb3 against Acanthamoeba trophozoites with pathogenic potential was confirmed by indirect flow cytometry and since no membrane permeabilizer had been used in the cell preparation, it can be assumed that the target is a membrane protein (Fig. 4A1). For all strains with pathogenic potential, significant displacement of the histogram curves was observed when compared to the controls. The specificity for the isolate AR14 was slightly inferior to other strains, but histogram displacement was still evident. The AC-G1 isolate did not interact with mAb3, with consequent overlap with the control curves. Different concentrations (1 × 10⁶, 1 × 10⁵, 1 × 10⁴ and 1 × 10³) of the ALX strain were evaluated against mAb3 by flow cytometry in order to infer the sensitivity of this technique, and it was possible to detect up to 1 × 10⁴ cells (data not shown).
To verify the capacity of mAb3 to recognize Acanthamoeba strains by direct flow cytometry, trophozoites incubated with FITC-conjugated mAb3 (mAb3-FITC) were analysed in the flow cytometer. The strains AP2, ALX, LG, R2P5, AR14 and AR15 showed higher fluorescence than the negative controls, as evidenced by the displacement of the histogram peaks (Fig. 4A2), and by the statistically significant difference between the mean fluorescence of samples treated with mAb3-FITC when compared to the negative controls (Fig. 4B). Again, mAb3 was unable to recognize the non-pathogenic AC-G1 isolate, as well as observed in the indirect format.
Reactivity of mAb3 to Acanthamoeba strains analysed by flow cytometry and immunofluorescence. (A) Histograms of indirect (A1) and direct (A2) flow cytometry of trophozoites from Acanthamoeba strains. Curves in light grey represent samples without antibodies, in dark grey are those treated only with secondary anti-mouse antibody (indirect assay) or FITC-conjugated non-specific IgG (direct assay) and in black are the samples treated with mAb3. (B) Mean fluorescence intensity of events detected by direct flow cytometry of Acanthamoeba samples treated with no antibodies (NA), with FITC-conjugated non-specific antibody (NSA-FITC) and with FITC-conjugated mAb3 (mAb3-FITC), quantified in relative fluorescence units (RFU), bars represent mean ± s.e.m. (5453 ⩽ n ⩽ 10 785), ****P < 0.0001, *P < 0.05. (C) Direct Immunofluorescence of Acanthamoeba trophozoites incubated with FITC-conjugated mAb3, images shown were generated using differential interference contrast (DIC) and fluorescence (FITC) illumination. Autofluorescence of untreated trophozoites was subtracted from the fluorescence intensity observed in the images. (D) Mean fluorescence intensity, detected by direct immunofluorescence, of untreated Acanthamoeba trophozoites (NA), treated with FITC-conjugated non-specific antibody (NSA) and with FITC-conjugated mAb3 (mAb3-FITC), quantified in relative fluorescence units (RFU). Bars represent mean ± s.e.m. (n = 100), ****P < 0.0001.

To visually evaluate the labeling of Acanthamoeba trophozoites by mAb3, strains AR14, ALX, LG and R2P5 were treated with mAb3-FITC and analysed by confocal microscopy. A positive labelling was observed, with fluorescence greater than autofluorescence of untreated cells (Fig. 4C). Absolute fluorescence values were also significantly higher in mAb3-FITC-treated trophozoites than in controls (not treated or treated with non-specific antibody) (Fig. 4D). These results corroborate the findings of flow cytometry.
Mab3 affects early stages of acanthamoeba encystment
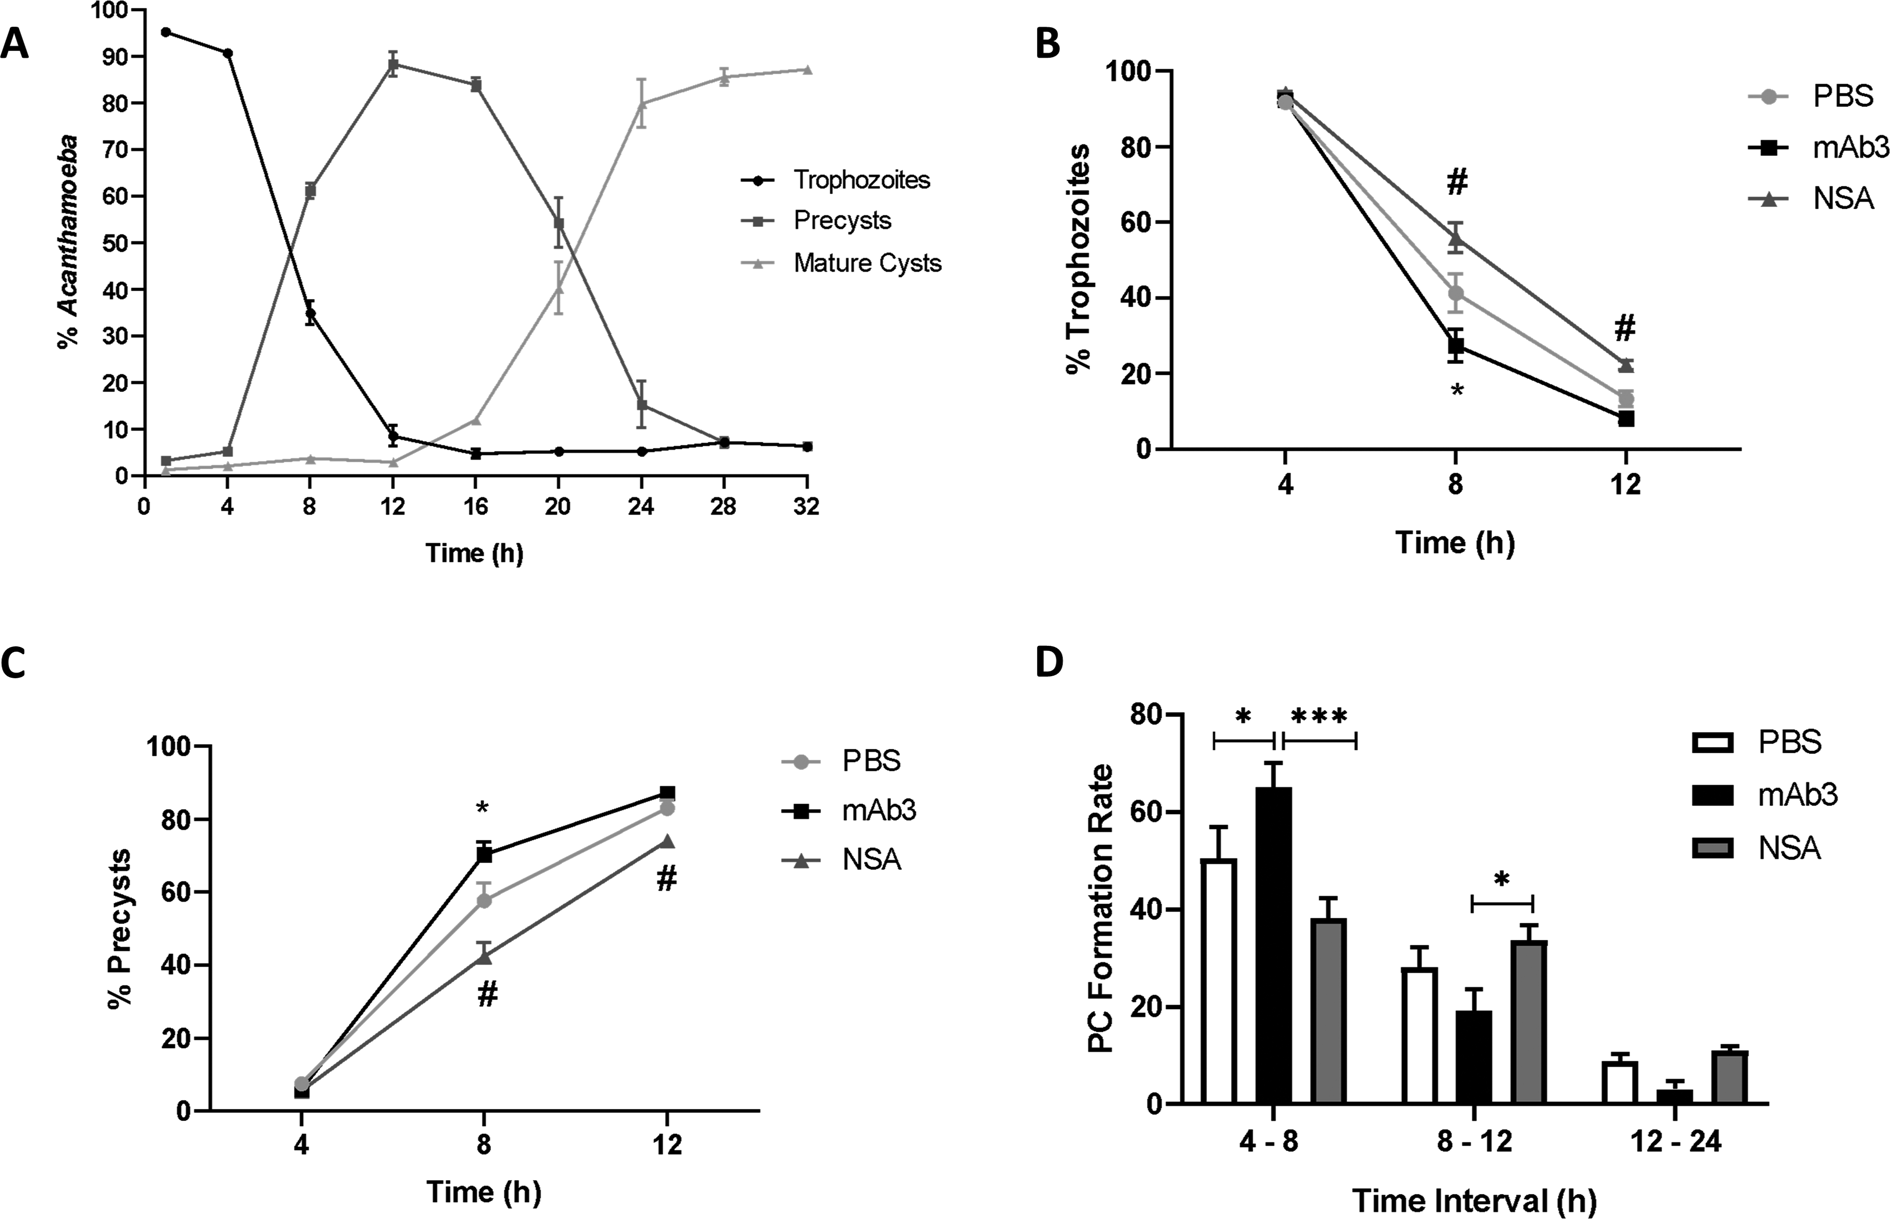
Acanthamoeba encystment induced by Neff's medium resulted in a rapid decrease in the percentage of trophozoites in the first 12 h of encystment and consequent increase in the percentage of precysts (PC), followed by transformation of PC in mature cysts, which seems to reach a plateau after 24 h (Fig. 5A).
Effect of mAb3 on Acanthamoeba encystation. (A) Kinetics of encystment of Acanthamoeba isolate AP2 in Neff's encystation saline, showing the percentage of trophozoites, precyst and mature cysts. (B, C) Effect of mAb3 (30 μg mL−1), non-specific antibodies (NSA) (30 μg mL−1) and vehicle (PBS) treatment in the amount of trophozoites and precyst. Points in graph represent mean ± s.e.m. (n = 4), *P < 0.01 mAb3 vs PBS, #P < 0.01 mAb3 vs NSA. (D) Effect of mAb3 (30 μg mL−1), non-specific antibodies (30 μg mL−1) and vehicle (PBS) treatment on precyst (PC) formation rate. Bars represent mean ± s.e.m. (n = 4), *P < 0.05, ***P < 0.001.

To evaluate a possible function of the mAb3 target in trophozoites physiological regulation, the kinetics of encystation was verified in the presence of this antibody in the first 12 h of encystment, which seem to be more representative for the main morphological changes in trophozoites. After 8 h, a significant reduction in the number of trophozoites treated with mAb3 was observed, and the number of precysts increased in the same proportion when compared to the groups treated with vehicle (PBS) or with the nonspecific molecule (Fig. 5B and C). Also, in the first 8 h of encystment, mAb3 induced an increase in precyst formation rate (Fig. 5D), indicating a stimulant effect on encystment in the early steps of the process.
Discussion
The growing number of cases of Acanthamoeba infections in recent decades has raised concerns among clinicians, especially due to the limitations of available diagnostic techniques. In the case of GAE, the rarity of the infection makes clinical suspicion difficult and requires expertise for correct identification (Kalra et al., Reference Kalra, Sharma, Shyam, Tejan and Ghoshal2020). Delay in specific diagnosis also hampers the management of AK, which can result in many sequelae including irreversible vision loss (Trabelsi et al., Reference Trabelsi, Dendana, Sellami, Sellami, Cheikhrouhou, Neji, Makni and Ayadi2012). In addition to the methods of direct identification in the affected tissue or culture, nucleic acid amplification has emerged as an alternative for detection with greater sensitivity. However, those molecular techniques are not always available routinely (Dart et al., Reference Dart, Saw and Kilvington2009). Besides, they can fail in some cases, as reported by Scheid and Balczun (Reference Scheid and Balczun2017), which concluded that the most promising approach is the combination of different diagnostic techniques, including immunological methods.
Monoclonal antibodies are a useful alternative because they identify different pathogens with specificity and can be used in the development of different diagnostic test configurations (Walochnik et al., Reference Walochnik, Haller-Schober, Kolli, Picher, Obwaller and Aspock2000; Sánchez et al., Reference Sánchez, Virginio, Maschio, Ferreira and Rott2016). The use of polyclonal and monoclonal antibodies in the identification and quantification of parasite antigens in different diagnostic tests is already well known (Andreotti et al., Reference Andreotti, Ludwig, Peruski, Tuite, Morse and Peruski2003; Ndao, Reference Ndao2009). And over the years, there has been a substitution in the use of polyclonal antibodies by murine and/or recombinant immunoglobulins (Siddiqui, Reference Siddiqui2010). This is largely because the production of polyclonal antibodies lacks reproducibility and also requires the use of many animals, and thus goes against the guidelines of the 3 Rs (Reduction, Refinement and Replacement). In addition, tests that employ polyclonal antibodies often have issues related to cross-reactivity (Siddiqui, Reference Siddiqui2010). In this regard, if it is possible to guarantee specificity and sensitivity, the use of monoclonal antibodies is encouraged.
A previous study by Becker-Finco et al. (Reference Becker-Finco, Costa, Silva, Ramada, Furst, Stinghen, De Figueiredo, De Moura and Alvarenga2013) indicated that the monoclonal antibody mAb3 could distinguish pathogenic and nonpathogenic Acanthamoeba. We showed presently mAb3's ability to recognize a higher number of strains, all with pathogenic potential corroborating its usefulness in the AK and GAE diagnosis. The analysis of its sequence was important to confirm the monoclonality and its functionality as a murine immunoglobulin, following the recommendations of standardizing the antibodies used in research, having in mind their application in diagnosis (Bradbury and Plückthun, Reference Bradbury and Plückthun2015).
MAb3 specificity was confirmed by ELISA, WB, Flow Cytometry and Immunofluorescence and in all tests, the antibody was able to recognize six of the seven samples tested. Amongst them, ALX, AP2 and LG samples are from clinical origin, being isolated from patients with keratitis (Duarte et al., Reference Duarte, Furst, Klisiowicz, Klassen and Costa2013). AR14 is an environmental isolate (Duarte et al., Reference Duarte, Furst, Klisiowicz, Klassen and Costa2013), and like the previously mentioned strains, also belongs to the T4 genotype, the most frequently associated with infections (Maciver et al., Reference Maciver, Asif, Simmen and Lorenzo-Morales2013). Another mAb3-reactive strain was AR15, a strain of environmental origin, but belonging to the T11 genotype. T11 is considered the third most abundant genotype in AK (Maciver et al., Reference Maciver, Asif, Simmen and Lorenzo-Morales2013), which suggests its pathogenic potential. Antigens from the strain R2P5 were also recognized by mAb3, an environmental isolate of T1 genotype (Possamai et al., Reference Possamai, Loss, Costa, Falqueto and Furst2018). This genotype is rare, but it has been associated with cases of GAE, being the second in relevance in this disease (Alsam et al., Reference Alsam, Sissons, Jayasekera and Khan2005; Sissons et al., Reference Sissons, Alsam, Goldsworthy, Lightfoot, Jarroll and Khan2006; Maciver et al., Reference Maciver, Asif, Simmen and Lorenzo-Morales2013). Additionally, this strain presents high protease activity in conditioned medium, a characteristic linked to pathogenicity (Cirelli et al., Reference Cirelli, Mesquita, Chagas, Furst, Possamai, Abrahão, dos Santos Silva, Grossi, Tagliati and Costa2020).
Interestingly, the only Acanthamoeba isolate whose proteins were not recognized by mAb3 was AC-G1, a soil-originated sample classified in the morphological group I with no pathogenic effect described until now. However, the AC-G1 isolate does not have the genotype determined so far, but it was characterized as a component from the morphological group I, and would fit into the T7, T8, T9 and T17 genotypes (Magliano et al., Reference Magliano, Teixeira and Alfieri2012), neither of which are associated with infections (Maciver et al., Reference Maciver, Asif, Simmen and Lorenzo-Morales2013). Conversely, group II Acanthamoeba as those recognized by mAb3 presently are more frequent in acanthamoebiasis cases. This suggests that the morphological phenotype can reflect antigenic variation in Acanthamoeba lineages.
Additionally, the possibility of cross-reaction with some of the recurrent agents of microbial keratitis was discarded as mAb3 did not recognize antigens from Fusarium sp., Aspergillus sp. and Candida sp. Fungal keratitis can often be misattributed to AK, leading to delayed treatment and poor prognosis (Walochnik et al., Reference Walochnik, Haller-Schober, Kolli, Picher, Obwaller and Aspock2000; Mascarenhas et al., Reference Mascarenhas, Lalitha, Prajna, Srinivasan, Das, D'Silva, Oldenburg, Borkar, Esterberg, Lietman and Keenan2014).
The use of antibodies to detect Acanthamoeba trophozoites by indirect flow cytometry has already been described in the literature (Khan et al., Reference Khan, Greenman, Topping, Hough, Temple and Paget2000; Turner et al., Reference Turner, Cockerell, Brereton, Badenoch, Tea, Coster and Williams2005). All of them were successful, however, the sensitivity and specificity of the analyses were less expressive than those obtained in this work. When mAb3 was conjugated to a fluorophore and used in a direct detection format, the analyses were even more sensitive and still had a shorter runtime.
Concerning mAb3 reactivity, the trophozoites were not permeabilized in the sample preparation and the antibody recognition was still effective, supporting the hypothesis that mAb3's target is a membrane protein, with the region of interaction localized in its extracellular domain (Delmonte and Fleisher, Reference Delmonte and Fleisher2019). Furthermore, the findings of the assay with tunicamycin confirmed the importance of carbohydrates at the interaction site. A similar finding was observed by Réveiller et al. (Reference Réveiller, Marciano-Cabral, Pernin, Cabanes and Legastelois2000), who also used tunicamycin to determine whether the target of the monoclonal antibody mAb5D12 anti-Naegleria fowleri was influenced by N-glycosylations, showing that the antigenic target had a polysaccharide component.
The confirmation that the mAb3 target is on the cell surface supports the idea of employing it in immunofluorescence tests for detection of Acanthamoeba trophozoites. Some laboratories are already using immunofluorescence to aid the diagnosis of AK (Lorenzo-Morales et al., Reference Lorenzo-Morales, Khan and Walochnik2015) and several studies utilize this technique to detect trophozoites (Khan et al., Reference Khan, Greenman, Topping, Hough, Temple and Paget2000; Magnet et al., Reference Magnet, Galván, Fenoy, Izquierdo, Rueda, Fernandez Vadillo, Pérez-Irezábal, Bandyopadhyay, Visvesvara, da Silva and del Aquila2012; Becker-Finco et al., Reference Becker-Finco, Costa, Silva, Ramada, Furst, Stinghen, De Figueiredo, De Moura and Alvarenga2013; Kang et al., Reference Kang, Park, Shin, Khan, Maciver and Jung2018). However, most of them use polyclonal antibodies and all apply the indirect detection method, which increases the chances of non-specific reactivity and make the protocol more laborious. So far, mAb3's ability to recognize antigens present in trophozoites of the different isolates tested is well established, confirming its potential use in acanthamoebiasis diagnosis. However, diagnostic sensitivity would greatly increase if the antibody was also able to recognize the cystic forms. Preliminary tests were performed and it was possible to observe positive reactivity against several early stages of cyst formation, nonetheless, these findings still need to be confirmed in a larger number of samples.
MS analysis suggested that the mAb3 target protein is a monovalent cation: proton transporter membrane protein (CPA2, antiporter), which belongs to a family of carrier proteins, part of the CPA superfamily. They can be found in bacteria, archaea and eukaryotes (Healy et al., Reference Healy, Ekkerman, Pliotas, Richard, Bartlett, Grayer, Morris, Miller and Booth2014). Among the functionally well-characterized members in this family of transporters are KefB/KefC, efflux proteins in E. coli capable of catalysing the K+/H+ antiport (Healy et al., Reference Healy, Ekkerman, Pliotas, Richard, Bartlett, Grayer, Morris, Miller and Booth2014). These proteins are important for cell survival during exposure to toxic metabolites, possibly because they can release K+, allowing H+ absorption by modulating the cytoplasmic pH (Fujisawa et al., Reference Fujisawa, Ito and Krulwich2007; Roosild et al., Reference Roosild, Castronovo, Healy, Miller, Pliotas, Rasmussen, Bartlett, Conway and Booth2010; Healy et al., Reference Healy, Ekkerman, Pliotas, Richard, Bartlett, Grayer, Morris, Miller and Booth2014).
Monovalent cation transport membrane proteins have been also described in Mycobacterium smegmatis (Mohan et al., Reference Mohan, Padiadpu, Baloni and Chandra2015). In single-celled eukaryotes, these proteins were found in Tetrahymena thermophila with the function of sodium and potassium ion transport and intracellular pH regulation (Eisen et al., Reference Eisen, Coyne, Wu, Wu, Thiagarajan, Wortman, Badger, Ren, Amedeo, Jones, Tallon, Delcher, Salzberg, Silva, Haas, Majoros, Farzad, Carlton, Smith, Garg, Pearlman, Karrer, Sun, Manning, Elde, Turkewitz, Asai, Wilkes, Wang, Cai, Collins, Stewart, Lee, Wilamowska, Weinberg, Ruzzo, Wloga, Gaertig, Frankel, Tsao, Gorovsky, Keeling, Waller, Patron, Cherry, Stover, Krieger, del Toro, Ryder, Williamson, Barbeau, Hamilton and Orias2006). Recently, Khan's group postulated that ion transporters play a role in sensory perception of surroundings, contributing to regulate A. castellanii excystation (Siddiqui et al., Reference Siddiqui, Roberts, Ong, Mungroo, Anwar and Khan2019). Our findings indicated that mAb3 induced an augment in precyst formation rate in the early stages of encystment, corroborating these proteins as participants in trophozoite differentiation as well.
Additionally, physiological regulatory effects of ion transport proteins in other organisms (Eisen et al., Reference Eisen, Coyne, Wu, Wu, Thiagarajan, Wortman, Badger, Ren, Amedeo, Jones, Tallon, Delcher, Salzberg, Silva, Haas, Majoros, Farzad, Carlton, Smith, Garg, Pearlman, Karrer, Sun, Manning, Elde, Turkewitz, Asai, Wilkes, Wang, Cai, Collins, Stewart, Lee, Wilamowska, Weinberg, Ruzzo, Wloga, Gaertig, Frankel, Tsao, Gorovsky, Keeling, Waller, Patron, Cherry, Stover, Krieger, del Toro, Ryder, Williamson, Barbeau, Hamilton and Orias2006; Fujisawa et al., Reference Fujisawa, Ito and Krulwich2007; Roosild et al., Reference Roosild, Castronovo, Healy, Miller, Pliotas, Rasmussen, Bartlett, Conway and Booth2010; Healy et al., Reference Healy, Ekkerman, Pliotas, Richard, Bartlett, Grayer, Morris, Miller and Booth2014) could also occur in Acanthamoeba as part of an adaptive mechanism to parasitic living conditions, which would demand greater resistance to oxidative stress caused by host's defense cells. This idea is consistent with the reactivity of mAb3 against strains with pathogenic traits found presently, suggesting that the increased presence of these proteins may be related to the greater potential for pathogenicity.
The greatest challenges concerning amoebic keratitis are finding a fast specific diagnostic method and effective treatment. Some groups are studying Acanthamoeba pathophysiology and searching for potential new candidates for pharmaceutical targets (Martín-Navarro et al., Reference Martín-Navarro, Lorenzo-Morales, Machin, López-Arencibia, García-Castellano, de Fuentes, Loftus, Maciver, Valladares and Piñero2013, Reference Martín-Navarro, Lorenzo-Morales, López-Arencibia, Reyes-Batlle, Piñero, Valladares and Maciver2014; Lakhundi et al., Reference Lakhundi, Siddiqui and Khan2015; Rice et al., Reference Rice, Campbell, Bisson, Owen, Sedelnikova, Baker, Rice, Henriquez and Roberts2018; Siddiqui et al., Reference Siddiqui, Roberts, Ong, Mungroo, Anwar and Khan2019). The findings presented in this study suggest that the monoclonal antibody mAb3 recognizes an extracellular target present only in pathogenic Acanthamoeba, demonstrating its potential application in AK diagnosis. In addition, the presence of the antibody seems to alter the dynamics of Acanthamoeba encystation. In the future, the confirmation of this effect should be done in greater number of isolates, concomitant to genetic sequence analyses and studies about the expression level of CPA2 family transporters. These proteins are rarely studied in Acanthamoeba, but in other microorganisms they seem to play a crucial role in their physiology, supporting the importance of better understanding the role of CPA2 transporters in the context of acanthamoebiasis.
Acknowledgements
We thank CTAF-UFPR for the microscopy images and Mass Spectrometry Platform-PR, Carlos Chagas Institute – Fiocruz for spectrometry analyses. We would also like to thank Dr Breno Beirão, Glaucio Valdameri, Marcel Ramirez and Max Ingberman for their suggestions and kind scientific assistance. We also thank TAXonline – Rede Paranaense de Coleções Biológicas for providing the fungal strains used in this study.
Financial support
This research was supported CAPES (Finance code 001).
Conflicts of interest
The authors state no conflict of interest.
Ethical standards
Not applicable.