

%20--%3e%3c!DOCTYPE%20svg%20PUBLIC%20'-//W3C//DTD%20SVG%201.0//EN'%20'http://www.w3.org/TR/2001/REC-SVG-20010904/DTD/svg10.dtd'%3e%3csvg%20version='1.0'%20id='Layer_1'%20xmlns='http://www.w3.org/2000/svg'%20xmlns:xlink='http://www.w3.org/1999/xlink'%20x='0px'%20y='0px'%20width='64px'%20height='64px'%20viewBox='5.5%20-3.5%2064%2064'%20enable-background='new%205.5%20-3.5%2064%2064'%20xml:space='preserve'%3e%3cg%3e%3ccircle%20fill='%23FFFFFF'%20fill-opacity='0'%20cx='37.785'%20cy='28.501'%20r='28.836'/%3e%3cpath%20fill='%23595959'%20d='M37.441-3.5c8.951,0,16.572,3.125,22.857,9.372c3.008,3.009,5.295,6.448,6.857,10.314%20c1.561,3.867,2.344,7.971,2.344,12.314c0,4.381-0.773,8.486-2.314,12.313c-1.543,3.828-3.82,7.21-6.828,10.143%20c-3.123,3.085-6.666,5.448-10.629,7.086c-3.961,1.638-8.057,2.457-12.285,2.457s-8.276-0.808-12.143-2.429%20c-3.866-1.618-7.333-3.961-10.4-7.027c-3.067-3.066-5.4-6.524-7-10.372S5.5,32.767,5.5,28.5c0-4.229,0.809-8.295,2.428-12.2%20c1.619-3.905,3.972-7.4,7.057-10.486C21.08-0.394,28.565-3.5,37.441-3.5z%20M37.557,2.272c-7.314,0-13.467,2.553-18.458,7.657%20c-2.515,2.553-4.448,5.419-5.8,8.6c-1.354,3.181-2.029,6.505-2.029,9.972c0,3.429,0.675,6.734,2.029,9.913%20c1.353,3.183,3.285,6.021,5.8,8.516c2.514,2.496,5.351,4.399,8.515,5.715c3.161,1.314,6.476,1.971,9.943,1.971%20c3.428,0,6.75-0.665,9.973-1.999c3.219-1.335,6.121-3.257,8.713-5.771c4.99-4.876,7.484-10.99,7.484-18.344%20c0-3.543-0.648-6.895-1.943-10.057c-1.293-3.162-3.18-5.98-5.654-8.458C50.984,4.844,44.795,2.272,37.557,2.272z%20M37.156,23.187%20l-4.287,2.229c-0.458-0.951-1.019-1.619-1.685-2c-0.667-0.38-1.286-0.571-1.858-0.571c-2.856,0-4.286,1.885-4.286,5.657%20c0,1.714,0.362,3.084,1.085,4.113c0.724,1.029,1.791,1.544,3.201,1.544c1.867,0,3.181-0.915,3.944-2.743l3.942,2%20c-0.838,1.563-2,2.791-3.486,3.686c-1.484,0.896-3.123,1.343-4.914,1.343c-2.857,0-5.163-0.875-6.915-2.629%20c-1.752-1.752-2.628-4.19-2.628-7.313c0-3.048,0.886-5.466,2.657-7.257c1.771-1.79,4.009-2.686,6.715-2.686%20C32.604,18.558,35.441,20.101,37.156,23.187z%20M55.613,23.187l-4.229,2.229c-0.457-0.951-1.02-1.619-1.686-2%20c-0.668-0.38-1.307-0.571-1.914-0.571c-2.857,0-4.287,1.885-4.287,5.657c0,1.714,0.363,3.084,1.086,4.113%20c0.723,1.029,1.789,1.544,3.201,1.544c1.865,0,3.18-0.915,3.941-2.743l4,2c-0.875,1.563-2.057,2.791-3.541,3.686%20c-1.486,0.896-3.105,1.343-4.857,1.343c-2.896,0-5.209-0.875-6.941-2.629c-1.736-1.752-2.602-4.19-2.602-7.313%20c0-3.048,0.885-5.466,2.658-7.257c1.77-1.79,4.008-2.686,6.713-2.686C51.117,18.558,53.938,20.101,55.613,23.187z'/%3e%3c/g%3e%3c/svg%3e)
%20--%3e%3c!DOCTYPE%20svg%20PUBLIC%20'-//W3C//DTD%20SVG%201.0//EN'%20'http://www.w3.org/TR/2001/REC-SVG-20010904/DTD/svg10.dtd'%3e%3csvg%20version='1.0'%20id='Layer_1'%20xmlns='http://www.w3.org/2000/svg'%20xmlns:xlink='http://www.w3.org/1999/xlink'%20x='0px'%20y='0px'%20width='64px'%20height='64px'%20viewBox='5.5%20-3.5%2064%2064'%20enable-background='new%205.5%20-3.5%2064%2064'%20xml:space='preserve'%3e%3cg%3e%3ccircle%20fill='%23FFFFFF'%20fill-opacity='0'%20cx='37.637'%20cy='28.806'%20r='28.276'/%3e%3cg%3e%3cpath%20fill='%23595959'%20d='M37.443-3.5c8.988,0,16.57,3.085,22.742,9.257C66.393,11.967,69.5,19.548,69.5,28.5c0,8.991-3.049,16.476-9.145,22.456%20C53.879,57.319,46.242,60.5,37.443,60.5c-8.649,0-16.153-3.144-22.514-9.43C8.644,44.784,5.5,37.262,5.5,28.5%20c0-8.761,3.144-16.342,9.429-22.742C21.101-0.415,28.604-3.5,37.443-3.5z%20M37.557,2.272c-7.276,0-13.428,2.553-18.457,7.657%20c-5.22,5.334-7.829,11.525-7.829,18.572c0,7.086,2.59,13.22,7.77,18.398c5.181,5.182,11.352,7.771,18.514,7.771%20c7.123,0,13.334-2.607,18.629-7.828c5.029-4.838,7.543-10.952,7.543-18.343c0-7.276-2.553-13.465-7.656-18.571%20C50.967,4.824,44.795,2.272,37.557,2.272z%20M46.129,20.557v13.085h-3.656v15.542h-9.944V33.643h-3.656V20.557%20c0-0.572,0.2-1.057,0.599-1.457c0.401-0.399,0.887-0.6,1.457-0.6h13.144c0.533,0,1.01,0.2,1.428,0.6%20C45.918,19.5,46.129,19.986,46.129,20.557z%20M33.042,12.329c0-3.008,1.485-4.514,4.458-4.514s4.457,1.504,4.457,4.514%20c0,2.971-1.486,4.457-4.457,4.457S33.042,15.3,33.042,12.329z'/%3e%3c/g%3e%3c/g%3e%3c/svg%3e)
1 Introduction
The aim of this case study is to assess the expected impact of investing in various tuberculosis (TB) control interventions in the South African context using a benefit-cost analysis (BCA) approach. The analysis tests preliminary recommendations for conducting BCA in the global health and development context and converts outputs of a cost-effectiveness analysis (CEA) (Bozzani et al., Reference Bozzani, Mudzengi, Sumner, Gomez, Hippner, Cardenas, Charalambous, White and Vassall2018, Reference Bozzani, Sumner, Mudzengi, Gomez, Hippner, Charalambous, White and Vassall2019).Footnote 1 This approach will enable the comparison of CEA and BCA analyses of the same interventions in the same context and will provide estimates of net benefits of increased investment in TB control interventions to assist South Africa’s policy response to management of TB.
2 Policy context
Tuberculosis remains a significant policy priority globally. In 2016, 1.7 million people died as a result of TB, including 0.4 million deaths among people with human immunodeficiency virus (HIV). Since 1990, globally there has been a 47% decline in the TB mortality rate and HIV-related TB deaths have declined by 32% since 2005. TB is the leading cause of death in South Africa with a mortality rate of 181 per 100,000 in HIV
 $+$
patients and 41 per 100,000 in patients without HIV (WHO, 2017). In 2014, the South African TB Think Tank was established to advise the National TB Programme on treatment and prevention policy and programmatic implementation to achieve the strategic targets for TB (White et al., Reference White, Charalambous, Cardenas, Hippner, Sumner, Bozzani and Mudzengi2018).
South Africa’s National Strategic Plan for HIV, TB and Sexually Transmitted Infections 2017–2022 (National Strategic Plan, 2017) outlines the road map for a comprehensive and integrated infectious disease approach and is aligned to the global TB response WHO (2015a ; 2015b ). The National Strategic Plan aims to reduce national TB incidence from 450,000 to less than 315,000 per year by 2022, including diagnosis of 90% of people with TB, treating 100% of those diagnosed and achieving successful treatment for 90% of patients with drug-susceptible TB. Aiming to reduce morbidity and mortality by providing treatment, care and adherence support for all, the National Strategic Plan increases the need for screening and testing programmes to appropriately identify patients in order to initiate treatment.
3 Approach to the case study
A CEA assessing the TB control interventions (Bozzani et al., Reference Bozzani, Mudzengi, Sumner, Gomez, Hippner, Cardenas, Charalambous, White and Vassall2018, Reference Bozzani, Sumner, Mudzengi, Gomez, Hippner, Charalambous, White and Vassall2019) was developed by combining impact estimates generated using the TIME (TB Impact Model Estimates) epidemiological transmission model. Cost estimates from the literature and micro-costing of TB control at sites across South Africa were synthesized to estimate the cost-effectiveness of competing interventions.
The TIME model was developed by the London School of Hygiene and Tropical Medicine in collaboration with Avenir Health as a user-friendly tool to predict the impact of interventions along the TB transmission, diagnosis and treatment pathways in high-burden settings (Menzies et al., Reference Menzies, Gomez, Bozzani, Chatterjee, Foster, Baena and Laurence2016). The CEA that this case study is based on assessed specific interventions related to screening and diagnosis, and utilized the TIME model to estimate likely outcomes.
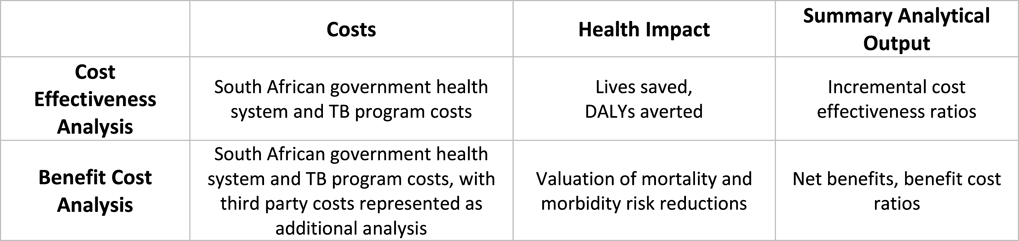
In completing this case study, a BCA methodological framework was applied to the original CEA analysis (Figure 1), and no additional primary analysis or data collection was conducted.
Simplified CEA and BCA frameworks applied in analysis.

In addition to applying the methodological specifications developed for BCA in global health and development, the case study attempts to apply the recommendations of two linked initiatives: the IDSI Reference Case (Wilkinson et al., Reference Wilkinson, Sculpher, Claxton, Revill, Briggs, Cairns and Teerawattananon2016), which provides general guidance for economic evaluation as well as guidance for CEA, and guidance from the Global Health Cost Consortium Project (Vassall et al., Reference Vassall, Sweeney, Kahn and Gomez2017) on health intervention and services costing.
4 Policy options
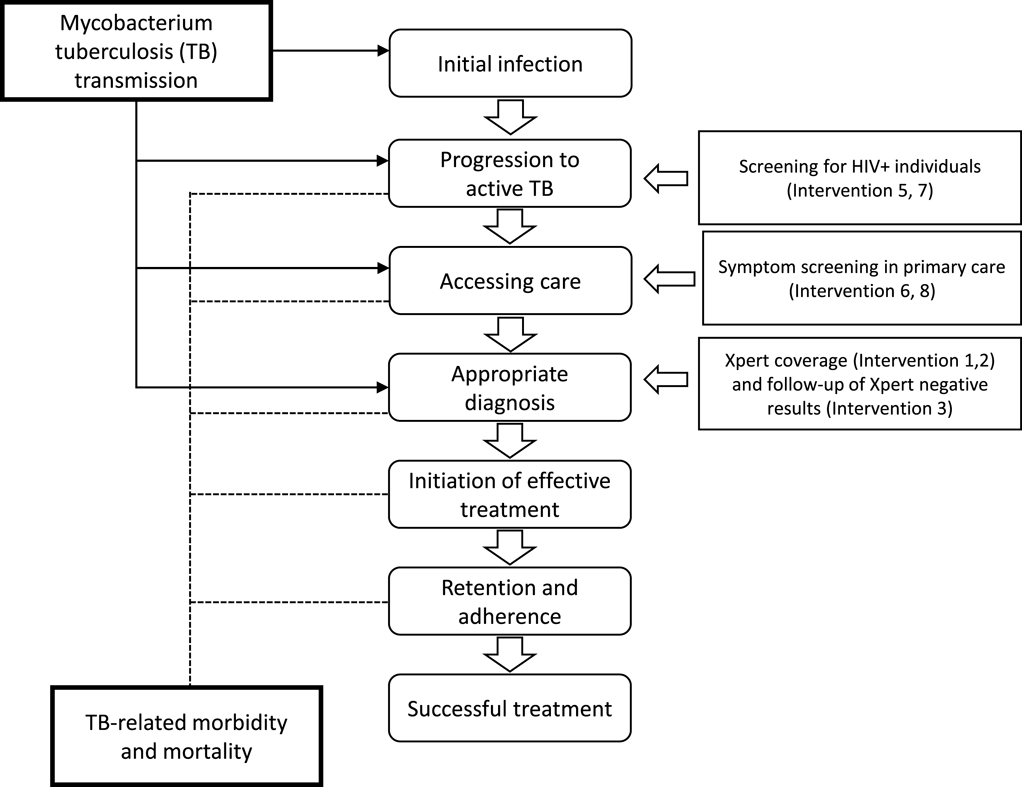
The National Strategic Plan for TB in South Africa requires a substantial and rapid scale-up of approaches to identify patients with TB and effectively initiate them on the right treatment. There are a range of policy options that can be applied individually or in combination to improve TB patient identification, and by comparing the expected costs and benefits associated with each option, the optimal combination can be identified. The analysis compares ten mutually exclusive interventions (status quo plus six unique interventions and three intervention combinations) for improving TB control as shown in Figures 2 and 3 below. The potential interventions in Figure 2 were identified in discussion with policy makers and represent the realistic and immediate policy options.
Intervention scenarios.

Intervention scenarios within the TIME model, modified from Menzies N, 2016.

The current measure to identify patients to initiate the TB diagnostic pathway include (in order of resource requirements and effectiveness of patient identification): (1) passive screening, which relies on patients actively seeking care, (2) cough triage, which includes a simple question to patients about history of coughing symptoms, and (3) a structured questionnaire with specific questions related to patient symptoms and clinical history developed by the World Health Organization (WHO symptoms screening tool).
Under the status quo (Intervention 1), a symptoms screen is conducted in 40% of HIV
 $+$
patients using the WHO symptoms screening tool (with no specific screen intervention for the remainder) and staff at Primary Health Clinics (PHC) passively screen all patients for TB. Coverage of the rapid diagnostic test GeneXpert MTB/RIF (Xpert) is currently at 80%, and follow-up of Xpert negative results is 14%Footnote
2
.
The available options to scale up TB control involve six potential interventions, each of which have associated costs and expected benefits. The options include increasing Xpert coverage of identified patients to 100% (Intervention 2); increasing microscopy follow-up of those who have a negative Xpert result to 90% (Intervention 3); and in 100% HIV
 $+$
PHC patients and 90% of all PHC patients (regardless of HIV status), triaging for cough assessment (Interventions 5 and 6, respectively) or performing WHO symptoms screening (Interventions 7 and 8, respectively). In addition, a further three combinations were assessed that consisted of the Xpert interventions (100% Xpert coverage and 90% follow-up of negative results), (Intervention 4); the Xpert interventions combined with cough triage in 90% of all PHC patients (Intervention 9); and Xpert interventions combined with WHO symptoms screening in 90% of all PHC patients (Intervention 10).
The impact of the intervention strategies was estimated utilizing the TIME model, with costs and effects modelled at specific stages in the causal pathway of TB as shown in Figure 3.
5 Perspective
This analysis adopts a societal perspective in the South African country context. The primary benefits of the interventions are to individuals in terms of mortality and morbidity risk reduction associated with improved detection and avoidance of TB. The costs of providing TB care are funded by government through general taxation as TB care is provided free of charge to patients at the point of use in the South African public healthcare system where TB is predominantly provided (Menzies et al., Reference Menzies, Gomez, Bozzani, Chatterjee, Foster, Baena and Laurence2016). This approach aligns with the CEA that adopted a health systems perspective for costs.
Direct costs of accessing care incurred by third parties (such as carers assisting patients to access health services) are relatively small compared to government expenditure on TB and are included in sensitivity analysis.
Although accessing treatment for TB can require a significant time burden for individuals, the analysis does not additionally incorporate impacts associated with income loss as patients in South Africa suffer relatively low levels of income loss from TB due to the context of high unemployment rates. A costing analysis involving TB patients in South Africa found that 69% of those who initiated TB treatment reported no income, and a further 5% accessed government cash transfers as their main source of income (receipt of which would not be impacted by disease) (Foster et al., Reference Foster, Vassall, Cleary, Cunnama, Churchyard and Sinanovic2015).
6 Baseline Conditions
The baseline comparators are detailed in Figure 2 and consist of Xpert coverage for 80% of cases, limited follow-up (14%) of those that receive negative Xpert result, WHO symptoms screening for less than half of patients with HIV, and passive screening of patients in PHCs. An important aspect of this analysis is that it is not assessing whether or not to introduce a new individual technology, but assessing the costs and benefits of investing additional resources in order to achieve target levels of TB patient identification. Therefore, the current baseline comparator is the existing screening algorithm, with associated levels of staffing, equipment and technologies at South African health facilities.
As the interventions represent scaling up of existing interventions, we do not predict that there would be major societal shifts or structural changes to the economy as a result of implementing the interventions, beyond of course the potential significant mortality and morbidity benefits of improved management of TB.
The IDSI Reference Case recommends that, while current practice should be used in base case analysis, additional analysis should be conducted using best supportive, non-interventional care as a comparator where appropriate to the decision problem. This case study does not incorporate a non-interventional comparator as the current policy decision that this analysis seeks to answer is restricted to utilizing existing diagnostic technologies and processes available in South Africa. In addition, applying a non-interventional (“do-nothing”) comparator for diagnostic interventions would require substantial assumptions about the downstream management of TB that may limit the usefulness of any findings of such an analysis.
7 Expected impact
The expected impacts of the different policy options are differing levels of resource use, largely because of staffing requirements to carry out the scaled-up interventions, and a corresponding improvement in TB patient identification with downstream impact on TB care and ultimately reduced TB-related mortality and morbidity. The use of more intensive screening interventions incurs more nurse time, and improved sensitivity generates more diagnostic tests downstream with associated costs but improved patient outcomes. A central assumption in predicting impact is related to the causal pathway from diagnosis to appropriate treatment, and then treatment to patient outcomes. In this analysis, common assumptions about treatment outcomes are applied consistently to all interventions and are based on outputs from the TIME epidemiological model. The major impact areas modelled include deaths averted, numbers of patients screened for TB using the passive and WHO approaches, the number of smear microscopy and Xpert diagnostic tests completed, the number of patients initiated on first line and multi-drug resistant (MDR) regimens, and reduction in the number of total person-years of untreated active disease.
Intervention impact on health system outcomes 2015–2035 (in ‘000s).

* Intervention results are presented incremental to status quo (intervention 1).
Xp
 $=$
Xpert diagnostic test; FU
 $=$
follow-up; PHC
 $=$
primary health clinic; SS
 $=$
WHO TB symptoms screening.
Table 1 shows the expected impact of each of the interventions under consideration on health system outcomes (in ’000s) over the 20-year period from 2015 to 2035 compared to the status quoFootnote
3
. Importantly, all interventions are expected to substantially reduce the number of person-years of untreated active disease – a key indicator for reduction in TB transmission. Intervention 7 (100% screening of all patients who are HIV
 $+$
) is expected to result in more than 447 million patient screening events using the structured WHO survey, with a resultant reduction in number of patients passively screened, and an increase in diagnostic tests performed and patients initiated on treatment. Intervention 10 (increased Xpert coverage and follow-up, and symptoms screening of 90% of all PHC attendees) is expected to yield the greatest reduction in untreated active disease, with more than 833 million additional screens using the structured WHO survey and 182 million additional Xpert diagnostic tests over the 20-year period.
8 Costs
The approach to costing in this analysis involved combining the output of the TIME epidemiological model with costing parameters derived from local South African data.
The cost of key elements within the care pathway were estimated using a micro-costing approach. For example, costs of drug regimens were estimated by calculating total number of tablets/injections required over the course of treatment multiplied by their unit cost, and screening costs involved the unit cost of the test per patient plus health professional time. Compared to the status quo scenario, the cost impact of key elements of the management pathway for the period 2015–2035 are detailed in Table 2, and are represented in South African Rand (ZAR) and Int$ using Int$:ZAR exchange rate of 5.564 (OECD, 2018). The analysis applies a 3% annual discount rate over the 20-year time horizon of the analysis with sensitivity analysis using 0% and 5.04%, which is twice the expected near-term growth projection of 2.52%, motivated by the Ramsey ruleFootnote 4 . Table 3 represents total cost impact under different discount rates.
Cost of interventions by element of the treatment pathway 2015–2035 (in Int$ (millions) and South African Rand (ZAR, millions), incremental to status quo).

* Cost of following up patients who have a negative Xpert result.
** People living with HIV receiving isoniazid preventative therapy.
Xp
 $=$
Xpert diagnostic test; FU
 $=$
follow-up; PHC
 $=$
primary health clinic; SS
 $=$
TB symptoms screening.
Total cost of interventions by element of the treatment pathway 2015–2035 at differing discount rates (in Int$, millions, incremental to status quo).

The Xpert diagnostic test is a driver of cost under most intervention scenarios. Additional costs associated with Xpert as a result of implementing Intervention 10 (100% Xpert coverage, 90% follow-up of Xpert negative results and symptoms screening in 90% of people attending primary health care clinics) are expected to be in excess of $10.3 billion over the 20-year period, with an additional $92 million for 1st line and multi-drug resistant (MDR) TB treatment costs. Intervention 5 (cough triage for 100% of HIV
 $+$
patients) is expected to result in savings in most elements of care due to a reduction in TB cases over time.
9 Benefits
This case study adopts a benefits transfer approach as a literature search did not identify literature of sufficient quality to estimate the value of statistical life (VSL) or value of statistical life year (VSLY), or willingness to pay to reduce non-fatal risks in South Africa directly (Robinson et al., Reference Robinson, Hammitt and O’Keeffe2019), (Robinson & Hammitt, Reference Robinson and Hammitt2018).
9.1 Value of mortality risk reduction
To calculate the value of mortality risk reduction, Equation (1) shows the approach to calculating the values used in the benefits transfer, where the VSL
 $_{\text{target}}$
is the estimated VSL in South Africa, VSL
 $_{\text{base}}$
is the value in the originating country, income is the GNI per capita adjusted for purchasing power parity, and elasticity measures the change in the VSL associated with a change in income.
 $$\begin{eqnarray}\text{VSL}_{\text{target}}=\text{VSL}_{\text{base}}\ast (\text{Income}_{\text{target}}/\text{Income}_{\text{base}})^{\text{elasticity}}.\end{eqnarray}$$
The rationale and values used to estimate the VSL for the South African target population used in this case study are informed by Robinson et al. Reference Robinson, Hammitt and O’Keeffe2019, and include three approaches for applying Equation (1). Approach 1 is based on the ratio of GNI per capita to central VSL estimates commonly used in the United States and Approach 2 uses VSL estimates commonly used across OECD countries. Both cases assume an income elasticity of 1.0. Approach 3 extrapolates from the US value using an elasticity of 1.5, which has the effect of reducing the estimated fraction of income devoted to spending on small risk reductions as income decreases. All approaches adopt a per capita income for South Africa of $12,840 (2015, adjusted for ppp). Following the estimation of the VSL in South Africa for the year 2015, the VSL was adjusted for expected changes in income over time. The International Monetary Fund average projected annual GDP growth to 2023 for South Africa (2.52%) (International Monetary Fund, 2018) was assumed to represent a reasonable estimation of a constant annual expected change in per capita income year to year and was used to estimate annual VSL growth to 2035, applying the appropriate elasticities for each approach.
Estimated VSLs for South Africa ($Int, 2015).

The term VSL is not an indication of a society’s or an individual’s valuation of a human life; it represents how an individual values a change in his or her own risk of mortality within a defined time frame. For example, a VSL of $981,652 in Table 4 above is equivalent to individual willingness to pay of $98 for a 1-in-10,000 reduction in one’s own mortality risk; VSL is calculated by dividing willingness to pay by the risk change.
The projected deaths avoided as a result of the different interventions over the period 2015–2035 (undiscounted) are shown in Table 6. The sum valuation of the mortality risk reduction was calculated using an income growth-adjusted VSL for deaths averted in any calendar year and discounted to the year 2015. All interventions are expected to avoid a substantial number of deaths relative to the status quo, with the combination intervention 10 (100% Xpert coverage, 90% follow-up of Xpert negative results and symptoms screening in 90% of people attending primary health care clinics) expected to yield the largest reduction in mortality with over 73,000 deaths avoided over the 20-year period at an expected mortality risk reduction monetized benefit of Int$79.9 billion.
10 Value of morbidity risk reduction
By improving outcomes related to detection and treatment of TB, the interventions are expected to result in reduced risk of morbidity (i.e. non-fatal health impacts) in addition to reduced risk of death.
Using established disability weights from the literature for the relevant health states (with and without active TB in combination with different HIV states) (Salomon et al., Reference Salomon, Vos, Hogan, Gagnon, Naghavi, Mokdad and Begum2012), the reduction in morbidity (represented by years lived in disability (YLD) associated with each intervention incremental to the status quo was calculated over the period 2015–2035.
To estimate the value of the morbidity risk reduction, the YLDs averted for each intervention were multiplied by a constant VSLY. This approach relies on strong assumptions including that (1) the VSLY is constant, (2) the VSLY as calculated is equivalent to a DALY, and (3) the value per DALY is constant (Robinson & Hammitt, Reference Robinson and Hammitt2018). Three values for the VSLY were estimated by extrapolating from the approaches used to estimate VSL and dividing the respective VSL by 30.75 years, which is the mean expected number of years of life remaining for the average adult in South Africa (Statistics South Africa, 2015) (World Health Organisation, 2015a ) (Table 5).
Estimated VSLYs for South Africa for target population (Int$, 2015).

Total monetized benefit by mortality and years lived in disability incremental to status quo 2015–2035 (in Int$, ‘millions).

Monetized benefit calculated using estimated VSL in South African context of $ 981 652 (GNI per capita*160 (elasticity 1.5) (approach 3). Xp
 $=$
Xpert diagnostic test; FU
 $=$
follow-up; PHC
 $=$
primary health clinic; SS
 $=$
WHO TB symptoms screening.
* Excluding 3rd-party costs.
Individual willingness to pay estimates are assumed to incorporate non-health systems costs incurred by the individual, and so these costs are not added to the estimates (Robinson & Hammitt, Reference Robinson and Hammitt2018). There is some uncertainty as to whether it is appropriate to add averted third-party costs (e.g. those paid by household or family members or an organization such as the government). An analysis of the economic costs of TB in South Africa (Foster et al., Reference Foster, Vassall, Cleary, Cunnama, Churchyard and Sinanovic2015) found the mean guardian/carer costs per diagnostic and treatment episode was US$114.10. Assuming this cost would be incurred by third parties for all patients initiating first line or MDR treatment under the different interventions, the impact of this third-party cost on the value of morbidly reduction is incorporated in Table 6 for comparison. Inclusion of averted third-party costs increases the net value associated with morbidity risk reduction for interventions that result in a reduction in initiations of TB treatments over time (e.g. increasing to 100% Xpert coverage), whereas inclusion of averted third-party costs reduces net value of interventions that increase the numbers initiating treatment (e.g. cough triage in 90% patients visiting PHC), as additional treatment initiations result in additional third-party costs. In this scenario, the inclusion of averted third-party costs represents a small proportion of the benefit compared to the willingness to pay estimates for morbidity risk reduction, with the mean increase in valuation across the interventions ranging from 2.19% (when using Approach 1) to 3.94% (when using Approach 3).
11 Net benefits and benefit cost ratios
The net benefits calculation subtracts total costs from total monetized benefits to estimate net benefits as detailed in Table 7. All interventions are estimated to result in positive net benefits compared to the status quo. Regardless of the approach used to estimate the VSL, Intervention 10 (improved Xpert access and follow-up, WHO symptoms screening in 90% of PHC patients) maximized net benefit over the 20-year period, at between Int$137 billion (Approach 1) and Int$71.3 billion (Approach 3). Intervention 5 (cough triage in all HIV
 $+$
patients) represented the lowest net benefits, ranging from Int$5.1 billion (Approach 1) to Int$3.2 billion (Approach 3).
Net benefit by intervention, incremental to status quo 2015–2035 (in Int$ millions and ZAR millions).

1 Monetized benefit calculated using estimated VSL in South African context of $2,054,400 (GNI per capita*160 (elasticity 1.0) (Approach 1).
2 Monetized benefit calculated using estimated VSL in South African context of $1,284,000 (GNI per capita*100 (elasticity 1.0) (Approach 2).
3 Monetized benefit calculated using estimated VSL in South African context of $981,652 (GNI per capita*160 (elasticity 1.5) Approach 3).
4 Benefit-cost ratio calculated using outputs VSL Approach 3.
The benefit-cost ratio (BCR) was calculated for each intervention by dividing the expected outputs (which in this analysis was the monetized benefit of morbidity and mortality risk reductions) by the respective implementation costs, where the value of the BCR indicates the expected monetary return for each dollar invested. Intervention 5 was estimated to be cost saving to the health system (i.e. had negative input costs) and so the BCR cannot be calculated but is represented in the table as greater than 100 to give an indication of relative favourable returns. Intervention 10, which was estimated to have the greatest net benefits of all the interventions, has a relatively low estimated BCR, reflecting the large costs associated with implementation.
12 Distribution of effects
Incidence of TB is heavily influenced by income and socioeconomic status. Despite significant reductions in the rate of povertyFootnote 5 from 1996, the poverty rate in South Africa has increased to 18.9% in 2015 from 16.9% in 2008. As TB is both a cause and effect of poverty, the distribution of the social benefits and costs associated with the TB control interventions across the South African population is highly relevant to the policy recommendation (Robinson et al., Reference Robinson, Hammitt and Adler2018).
Even though TB care in South Africa is largely free at the point of use, patients experience direct and indirect costs associated with the disease and in accessing TB diagnosis and treatment. An extended cost-effectiveness analysis that utilized the same epidemiological model (TIME) as this case study estimated the impact of expanded TB services on households in South Africa and India and showed substantial variation in the impact of suffering from TB and accessing TB care across income quintiles (Verguet et al., Reference Verguet, Kim and Jamison2016). The study found that in the South African base case scenario, 1.1 to 1.2 million households would experience catastrophic costs related to TB over the period 2015–2030, with 80% of catastrophic costs experienced in the bottom quintile, and zero households in the top quintile experiencing catastrophic costs. Expanded access to TB services in South Africa was estimated to reduce TB-related catastrophic costs by 5–20%, with the majority of benefits accruing to poorest households.
All interventions within this case study reduce the amount of untreated active TB and avert significant morbidity and mortality. This case study was unable to make accurate quantitative estimations of the distributional impacts of the different interventions as although the socioeconomic status of patients passively screened for TB is known, it is uncertain precisely how the benefits of more intensified case finding and screening will be distributed. However, it is expected that the intervention effects will mainly be experienced by impoverished households and that interventions with larger reductions in TB-associated morbidity and mortality will have a greater impact on households in lower-income quintiles. As TB interventions in South Africa are largely delivered in the public sector, the cost of the interventions falls on government revenue through a broadly progressive taxation system, indicating that the health system costs of the interventions are more likely to fall on households in higher-income quintiles.
13 Discussion
This case study aimed to demonstrate the methodological specifications for the conduct of BCA and was applied to an existing CEA of 10 interventions to improve access and diagnosis of TB in the South African setting.
The CEA results found that Intervention 5 (cough triage in 100% of HIV
 $+$
patients) is expected to result in net health service savings and generate positive health outcomes, and would likely receive a positive policy recommendation even under scenarios where the cost-effectiveness threshold (CET) is either extremely low or unknown. Interventions 3, 4, 6, 7 and 8 are either strongly or weakly dominated, indicating that for any given cost-effectiveness threshold, an alternative mix of interventions exist that represents a more favourable use of resourcesFootnote
6
. Intervention 10 (100% Xpert coverage, 90% follow-up of Xpert negatives and WHO symptoms screen in 90% of all PHC patients) is expected to have the highest incremental cost-effectiveness ratio (ICER) and represents a potentially viable policy option in addition to Intervention 5 and Intervention 9 (100% Xpert coverage and follow-up of 90% of patients with a negative Xpert result) depending on the cost-effectiveness threshold used in the South African setting to guide health system investmentsFootnote
7
. Further interpretation of the CEA results will be discussed in the report of the CEA analysis (Bozzani et al., Reference Bozzani, Sumner, Mudzengi, Gomez, Hippner, Charalambous, White and Vassall2019).
Under the BCA framework, Intervention 5 (triaging all people who are HIV
 $+$
who have a cough for TB management rather than applying the WHO screening survey before referral) represents the lowest net benefit but most favourable BCR. This is because while the health impacts are relatively small (averting approximately 1,500 deaths and 5,000 years lived in disability), this intervention is likely to achieve substantial savings (Int$1.24 billion) compared to status quo over time as a result of reduced staff time and diagnostic tests. Intervention 10 has the highest net benefit under all approaches to VSL calculation, but a relatively low BCR given the high implementation costs. Applying a VSL of between Int$0.98–Int$2.1 million to decreased mortality risk reduced the relative importance of small changes in input costs between interventions, resulting in the intervention with the greatest health impact yielding the greatest net benefit therefore under this analysis, Intervention 10 represents the welfare maximizing policy option.
The BCA applied estimated willingness to pay to monetize health benefits and did not separately represent economy-wide impacts such as economic growth or unemployment rate. The strong links between TB and poverty suggests that there may be economic benefits of reduced risk of TB-associated morbidity and mortality in addition to the monetized benefits addressed. Further research on the relationship between variables such as economic growth and TB and other priority conditions would provide useful evidence to extend this analysis.
Contrasting the results utilizing the CEA and BCA frameworks highlight the differing theoretical underpinnings of the approaches. The CEA provides a series of ICERs estimating incremental health system costs as a ratio to a measure of health benefit, in this case producing a cost per DALY averted. The BCA provides net benefits as a function of health system and caregiver costs and monetized valuations for mortality and morbidity risk reduction. The BCA also provides BCR estimates, which in this analysis is conceptually similar to the calculation of a cost-effectiveness ratio in CEA where BCR represents total outputs and inputs while an ICER represents incremental costs and effects. Incremental analysis identifies the costs and effects of an intervention relative to the next most effective (or least costly) intervention in the analysis and so is able to exclude interventions that are more costly and less effective than other interventions (or combinations of interventions), thereby providing an indication of the opportunity cost of the alternative options. Although there is no fundamental methodological barrier to using an incremental approach in calculation of BCR, the BCR method commonly represents total inputs and outputs relative to a common comparator, which in an analysis involving multiple mutually exclusive interventions may provide an inaccurate indication of opportunity cost and should be interpreted with caution in this case study.
The CEA and BCA approaches in this case study reflect a judgement on whether social values embedded in economic evaluation ought to reflect those implied by the outcome of policy processes (such as government setting budgets for health care) or a notion of welfare founded on individual preferences or an explicit welfare function (Claxton, Reference Claxton2018). A limitation of applying the results of the BCA in a policy recommendation is the extent to which a monetized value of individual preferences for changes in one’s own risks is valid in determining health policy in South Africa given historical and persistent levels of inequity and access to care. If so, a further limitation is whether the uncertainty resulting from the benefits transfer approach enables an acceptable estimation of welfare in the South African context. However, utilizing CEA results also suffers from comparable limitations in the calculation and valuation of health effects and uncertainty in the extent to which the objective function to maximize health should be weighed against other values important to the South African population.
A key consideration for interpretation of both the BCA and CEA approaches is health system affordability. Simplistic decision rules to implement policies based on analytical outputs (be that CEA or BCA or another form of analysis) that are not linked to available funding has the potential to result in net population loss of welfare (under a BCA framework) or health (under a CEA framework) if more efficient interventions are pushed out to fund new investments. In the South African context, completion of ongoing work to accurately estimate the marginal productivity of the public health system will assist in the interpretation of CEA results, while local estimations of willingness to pay for mortality and morbidity risk reductions in addition to consideration of the appropriate interpretation of BCA results in the context of the objectives of the South African health system is required. BCA potentially offers further analytical insight for interventions with substantial non-health and non-pecuniary benefits and costs; however, approaches to co-financing interventions with multi-sectoral impacts also demonstrates the utility of CEA in this policy context (Remme et al., Reference Remme, Martinez-Alvarez and Vassall2017).
The results of this case study may contribute to further understanding of the nature and relationship of the costs and benefits of the different TB control interventions and the appropriate analytical technique to demonstrate value relative to other health system priorities. Ultimately, the validity of the differing approaches rests on the requirements, understanding, and informational needs of the intended decision maker, and the realities of local perspective, and context.
Acknowledgments
This paper was prepared as part of the “Benefit-Cost Analysis Reference Case: Principles, Methods, and Standards” project at the Harvard T.H. Chan School of Public Health, with support from the Bill & Melinda Gates Foundation [OPP1160057]. We thank Lisa A. Robinson (Harvard T.H Chan School of Public Health), James K. Hammitt (Harvard T.H Chan School of Public Health), Mary Kokoski (Journal of Benefit Cost Analysis), and the anonymous reviewers for helpful comments and suggestions on earlier drafts. For many insightful discussions and advice, we thank Brad Wong (Copenhagen Consensus), Lisa A. Robinson, Stephen Resch (Harvard T.H Chan School of Public Health) and Kalipso Chalkidou (Centre for Global Development). We thank Piotr Hippner (The Aurum Institute, South Africa) and Tom Sumner (LSHTM) for their contribution as modellers and authors on the original cost-effectiveness analysis.
The views expressed in this paper are those of the authors and do not necessarily reflect the views of these organizations or the project team. For more information, see https://sites.sph.harvard.edu/bcaguidelines/.





 Open access

