1. Introduction
A suspension droplet is a cluster of particles held in suspension in a surrounding fluid. If the particle density is different from that of the surrounding fluid, the suspension droplet either falls or rises (for heavier or lighter particles, respectively) in the presence of a gravitational field. This problem has generated significant interest in the fluid mechanics community, in part because it is an apparently simple problem that leads to highly complex and interesting dynamics and in part because, at sufficiently high particle concentrations, it is a flow field that is dominated by the hydrodynamic interaction between the particles. The problem is relevant to a number of geophysical and environmental applications in which clusters of heavy particles generate turbulence as they sink in a lighter fluid. For instance, in direct numerical simulations of homogeneous turbulence of a particulate fluid under gravity, Elghobashi & Truesdell (Reference Elghobashi and Truesdell1993) found that a primary source of turbulence generation was associated with groups of particles falling under gravity. Similar physics occurs for buoyant plumes of particles that are lighter than the surrounding fluid (Hurley & Physick Reference Hurley and Physick1993). Suspension droplet dynamics is also relevant to applications involving smoke inhalation in the human lung. A number of investigators have observed that, in cases with high particle concentrations, the penetration of particles into the lung in inhaled cigarette smoke is significantly greater than predicted based on single-particle settling velocities (Martonen Reference Martonen1992; Phalen et al. Reference Phalen, Oldham, Mannix and Schum1994; Robinson & Yu Reference Robinson and Yu2001). One explanation that has been proposed for this difference is that smoke particles move through the upper airway region in the form of a suspension cloud, where the hydrodynamic interaction of particles within this cloud allows the particles to travel more rapidly relative to the surrounding fluid than would be the case for isolated particles. The ability to accurately model the degree of penetration of particles into the lung is very important in understanding the health effects of inhaling cigarette smoke, as well as related problems of inhalable drug dispersal and silicon dust inhalation in construction and mining operations.
The dynamics of a small number of settling particles falling under gravity has been examined in a number of studies (Bretherton Reference Bretherton1964; Hocking Reference Hocking1964; Jayaweera, Mason & Slack Reference Jayaweera, Mason and Slack1964; Vasseur & Cox Reference Vasseur and Cox1977; Ekiel-Jeżewska & Felderhof Reference Ekiel-Jeżewska and Felderhof2005, Reference Ekiel-Jeżewska and Felderhof2006), which have led to identification of different stable and unstable particle configurations. As the number of particles increases, dynamical systems approaches become increasingly difficult and the problem must instead be approached as one of suspension dynamics, although computational approaches continue to solve for the system at the individual particle level. The droplet dynamics is typically characterized by two different Reynolds numbers, called the droplet Reynolds number
 $\mathit{Re}_{d}=2r_{d}U_{d,HR}/{\it\nu}$
(also sometimes called the cloud Reynolds number) and the particle Reynolds number
 $\mathit{Re}_{p}=2r_{p}U/{\it\nu}$
. Here,
 $r_{p}$
and
 $r_{d}$
are the particle and droplet radii, respectively,
 ${\it\nu}$
is the fluid kinematic viscosity,
 $U_{d,HR}$
is a theoretical estimate of the droplet settling velocity based on the initial number of particles in the droplet, and
 $U$
is the settling velocity of an isolated particle in an otherwise stagnant fluid.
The settling of an initially spherical particle suspension droplet under gravity was examined by Nitsche & Batchelor (Reference Nitsche and Batchelor1997) for low-Reynolds-number clouds using both experiments and numerical simulations. The numerical simulations were performed by representing each particle by the sum of a stokeslet and a doublet that induce a velocity field on all other particles. This computational approach requires that both the droplet and the particle Reynolds numbers are small compared to unity. Nitsche & Batchelor observed that the suspension droplet settles significantly more rapidly than would be predicted for a cloud of non-interacting particles due to the fluid motion induced by the particle settling. They also showed that a reasonable approximation for the suspension droplet settling velocity can be obtained from the Hadamard–Rybczyński (HR) solution for a spherical droplet of an immiscible fluid immersed in another fluid at low Reynolds number (see also Ekiel-Jeżewska, Metzger & Guazzelli Reference Ekiel-Jeżewska, Metzger and Guazzelli2006).
As the suspension droplet falls downwards, a series of transitions in the flow pattern takes place (Adachi, Kiriyama & Yoshioka Reference Adachi, Kiriyama and Yoshioka1978; Noh & Fernando Reference Noh and Fernando1993). As originally described by Adachi et al. (Reference Adachi, Kiriyama and Yoshioka1978), the particle cloud in certain cases adopts a toroidal shape, which breaks up into some number of offspring droplets, where the offspring droplets then repeat this process. The evolution of a suspension droplet into a toroidal shape is analogous to a similar process that occurs for a droplet of a heavy liquid immersed in a lighter liquid (Kojima, Hinch & Acrivos Reference Kojima, Hinch and Acrivos1984). These transitions were examined in detail both experimentally and using stokeslet-based simulations by Machu et al. (Reference Machu, Meile, Nitsche and Schaflinger2001) and Metzger, Nicolas & Guazzelli (Reference Metzger, Nicolas and Guazzelli2007) for low-Reynolds-number droplets with spherical particles and by Park et al. (Reference Park, Metzger, Guazzelli and Butler2010) for suspensions formed of fibres.
Subramanian & Koch (Reference Subramanian and Koch2008) examined different regimes of suspension droplet dynamics based on the particle Reynolds number, the particle volume concentration
 ${\it\phi}$
, and the droplet size. For cases where
 $r_{d}/r_{p}<({\it\phi}\mathit{Re}_{p})^{-1/3}$
, the droplet is said to be in a Stokes droplet regime, for which both the particle and droplet Reynolds numbers are small. For
 $({\it\phi}\mathit{Re}_{p})^{-1/3}<r_{d}/r_{p}<\mathit{Re}_{p}^{-1}$
, the droplet is in a macro-scale inertia regime, for which the inertia of individual particles is negligible (i.e.
 $\mathit{Re}_{p}\ll 1$
), but the inertia of the droplet as a whole is finite (i.e.
 $\mathit{Re}_{d}=O(1)$
). For
 $r_{d}/r_{p}>\mathit{Re}_{p}^{-1}$
, the droplet is in a micro-scale inertia regime, for which the inertial screening length
 $\ell =r_{p}/\mathit{Re}_{p}$
is of the same order as (or larger than) the droplet radius
 $r_{d}$
. Subramanian & Koch (Reference Subramanian and Koch2008) argued that for cases falling in the latter two regimes, and for which the particle Reynolds number and the particle concentration are small, a more accurate computational approach is obtained by replacing the stokeslet and the potential doublet in the simulation approach of Nitsche & Batchelor (Reference Nitsche and Batchelor1997) with the steady Oseen solution for flow past a sphere. The fact that the velocity solution from the oseenlet-based approach is uniformly valid with distance away from the sphere is particularly valuable when computing interactions between the particles in the tail with each other and with the droplet, as in this case distances between interacting particles can be much larger than the droplet radius. This oseenlet-based approach was used by Pignatel, Nicolas & Guazzelli (Reference Pignatel, Nicolas and Guazzelli2011), along with experiments, to explore the effect of finite droplet inertia on suspension droplet dynamics and breakup.
Other computational investigations have used a distributed body force approach to examine suspension droplet flows with finite inertia. For instance, Bosse et al. (Reference Bosse, Kleiser, Härtel and Meiburg2005) approximated the fluid–particle interaction force as a distributed body force on a grid, from which they solved for the induced flow field using a pseudospectral technique. Chen & Marshall (Reference Chen and Marshall1999) employed a vorticity-based method in which the curl of the fluid–particle interaction force acts as a source term in the vorticity transport equation. The solution was obtained (in two dimensions) using a Lagrangian approach that employed a combination of vortex blobs and point particles. A related vorticity-based method was employed in three dimensions by Walther & Koumoutsakos (Reference Walther and Koumoutsakos2001), in which a vortex-in-cell method was used to compute the velocity field.
All of the papers described above consider suspensions formed of monodisperse particles, with uniform particle diameter, density, etc. In a polydisperse mixture, where particle properties differ, the sedimentation process will generally lead to particle segregation due to differences in particle settling velocity. Consequently, the particles within a settling polydisperse suspension droplet would rapidly segregate in the absence of hydrodynamic interaction between the particles. In the presence of hydrodynamic interaction, the recirculating flow field within the suspension droplet acts to inhibit particle segregation, provided that the heterogeneities between the particles are sufficiently small and the particle concentration sufficiently high. The ability of hydrodynamic interaction to inhibit segregation within slightly polydisperse particle droplets was first noted by Abade & Cunha (Reference Abade and Cunha2007), who used stokeslet-based simulations to approximate particle hydrodynamic interactions. An expression for the maximum fall velocity of a polydisperse droplet was recently derived by Bülow, Nirschl & Dörfler (Reference Bülow, Nirschl and Dörfler2015), who also present simulations using the stokeslet-based method showing breakup of polydisperse droplets over long times.
The current paper uses a combination of oseenlet-based simulations and laboratory experiments to examine particle segregation in falling polydisperse suspension droplets. As noted in the previous paragraph, hydrodynamic interactions inhibit particle segregation in falling polydisperse droplets, but it does not completely eliminate segregation. We specifically focus on the relationship between particle segregation and the particle leakage phenomenon in sedimenting droplets. The simulations and experiments are both subject to a number of limitations, and as a consequence cover different ranges of parameter values. Specifically, the oseenlet-based computation method (like the stokeslet-based method used for vanishing
 $\mathit{Re}_{d}$
) is valid only for small particle concentrations and small particle Reynolds numbers
 $\mathit{Re}_{p}$
. In the experiments, we seek to initialize the flow field as a sphere of well-mixed polydisperse particles in a stationary liquid bath. A cluster of particles placed at the top of the liquid bath is observed to form a structure that reasonably resembles this idealization at sufficiently low droplet Reynolds numbers and high particle concentrations. However, at low particle concentrations, we have experienced difficulty in obtaining a well-mixed spherical structure at the onset of the experiments. These limitations force the simulations to focus on low-concentration clusters and the experiments to focus on high-concentration clusters, although both approaches have values of the droplet Reynolds number near unity and both are conducted at small particle Reynolds numbers. The parameters used for both the reported computations and experiments lie near the boundary
 $r_{d}/r_{p}<({\it\phi}\mathit{Re}_{p})^{-1/3}$
of the macro-scale inertia and Stokes droplet regimes of suspension droplet behaviour, as described by Subramanian & Koch (Reference Subramanian and Koch2008). It is of interest that, despite the differences in particle concentration, both experiments and computations exhibit a similar mechanism leading to particle segregation from the suspension droplet.
The computational method used in the paper is described in § 2.1, followed by a summary of computational results for monodisperse and polydisperse mixtures. We have examined a wide assortment of polydisperse mixtures, including bidisperse mixtures with two different particle densities, bidisperse mixtures with two different particle sizes, and polydisperse mixtures with a distribution of particle size and density. The mechanics in all cases examined are similar, depending only on differences in terminal velocity between the particles. For brevity, § 2 focuses on bidisperse mixtures with two different particle densities. An experimental investigation is presented in § 3 for settling of suspension clouds with bidisperse particle mixtures with particles of different sizes and densities. Conclusions are presented in § 4.
2. Computational method and results
2.1. Oseenlet simulation method for particle hydrodynamic interaction
Computation of the particle interactions using stokeslets requires that both the particle Reynolds number
 $\mathit{Re}_{p}$
and the cloud Reynolds number
 $\mathit{Re}_{d}$
be small compared to unity. The latter restriction arises from the fact that the Stokes equation is only valid within distances from the particle centre that are small compared with the inertial screening length
 $\ell =r_{p}/\mathit{Re}_{p}$
. A uniformly valid solution for the flow around a particle with low particle Reynolds number is given by the Oseen solution (Proudman & Pearson Reference Proudman and Pearson1957), from which the flow field generated by a spherical particle with radius
 $r_{p}$
translating with a velocity
 $U_{S}\boldsymbol{e}_{x}$
relative to the surrounding fluid at low particle Reynolds number can be written in a local spherical coordinate system, with the polar axis (
 ${\it\theta}=0$
) coincident with the direction of particle motion, as
 $$\begin{eqnarray}\displaystyle \displaystyle u_{r} & = & \displaystyle \frac{U_{S}r_{p}^{2}}{r^{2}}\left\{-\frac{r_{p}}{2r}\cos {\it\theta}-\frac{3(1-\cos {\it\theta})r}{4r_{p}}\text{exp}\left(-\frac{\mathit{Re}_{S}r(1+\cos {\it\theta})}{2r_{p}}\right)\right.\nonumber\\ \displaystyle & & \displaystyle \quad \left.+\,\frac{3}{2\mathit{Re}_{p}}\left[1-\text{exp}\left(-\frac{\mathit{Re}_{S}r(1+\cos {\it\theta})}{2r_{p}}\right)\right]\right\}\end{eqnarray}$$
 $$\begin{eqnarray}\displaystyle \displaystyle u_{{\it\theta}} & = & \displaystyle -\frac{U_{S}r_{p}}{r}\sin {\it\theta}\left[\frac{r_{p}^{2}}{4r^{2}}+\frac{3}{4}\text{exp}\left(-\frac{\mathit{Re}_{S}r(1+\cos {\it\theta})}{2r_{p}}\right)\right].\end{eqnarray}$$
 $\mathit{Re}_{S}=2r_{p}U_{S}/{\it\nu}$
is the instantaneous particle Reynolds number based on the particle slip velocity
 $U_{S}\equiv |\boldsymbol{v}-\boldsymbol{u}|$
, where
 $\boldsymbol{v}$
is the particle velocity and
 $\boldsymbol{u}$
is the fluid velocity at the particle centre (evaluated as if the particle were not present). This solution approaches the Stokes solution for flow past a sphere within a region
 $r\ll \ell$
near to the particle, but at large distances
 $r\gg \ell$
the velocity field approaches that of a potential point source, with decay rate of
 $O(1/r^{2})$
. The fluid emitted from this source is recovered in a back-flow region located within a thin wake near
 ${\it\theta}={\rm\pi}$
, within which the velocity magnitude decays as
 $O(1/r)$
.
The fluid velocity
 $\boldsymbol{u}_{i}$
at the centre of particle
 $i$
, where
 $i=1,\dots ,N$
, is obtained at each time step by solution of a matrix equation of the form
 $$\begin{eqnarray}\boldsymbol{u}_{i}=\mathop{\sum }_{j\neq i}\unicode[STIX]{x1D652}(\boldsymbol{x}_{i},\boldsymbol{x}_{j})(\boldsymbol{v}_{j}-\boldsymbol{u}_{j}).\end{eqnarray}$$
The matrix
 $\unicode[STIX]{x1D652}$
is obtained using (2.1) and (2.2) after rotating the local spherical coordinate system into a global coordinate frame. Since the particle Stokes number is very small in the current simulations, it is reasonable to assume that the particle inertia is negligible and that particle drag and reduced gravity terms are approximately in balance. We therefore adopt the same approximation used by numerous previous investigators (Nitsche & Batchelor Reference Nitsche and Batchelor1997; Subramanian & Koch Reference Subramanian and Koch2008; Pignatel et al.
Reference Pignatel, Nicolas and Guazzelli2011) and set the fluid slip velocity
 $U_{S}$
equal to the particle terminal velocity
 $U$
in an otherwise stationary fluid (and
 $\mathit{Re}_{S}$
and
 $\mathit{Re}_{p}$
become identical).
The governing equations for the suspension droplet motion can be non-dimensionalized by selecting the characteristic fluid length and velocity scales as the initial droplet diameter
 $L$
and the terminal settling speed
 $U$
of an isolated particle of nominal size and density, where the latter is given by
 $$\begin{eqnarray}U=\frac{d^{2}g_{R}}{18{\it\nu}{\it\chi}},\end{eqnarray}$$
and
 $g_{R}=(1-{\it\chi})g$
is the reduced gravitational acceleration and
 ${\it\chi}={\it\rho}_{f}/{\it\rho}_{p}$
is the density ratio. For computations with variable size and density particles, it is convenient to define a nominal particle density
 $\bar{{\it\rho}}_{p}$
and diameter
 $\bar{d}$
by
 $$\begin{eqnarray}\bar{{\it\rho}}_{p}=\frac{1}{N}\mathop{\sum }_{n=1}^{N}{\it\rho}_{n},\quad \bar{d}=\left(\frac{1}{N}\mathop{\sum }_{n=1}^{N}d_{n}^{2}\right)^{1/2},\end{eqnarray}$$
where
 $N$
is the total number of particles. The nominal particle diameter is specified by averaging the square of the diameter to ensure that the average particle terminal velocity will be equal to that for particles whose diameter is equal to the nominal value
 $\bar{d}$
. For a mixture, the density ratio
 ${\it\chi}={\it\rho}_{f}/\bar{{\it\rho}}_{p}$
is based on the nominal particle density. The Froude number
 $\mathit{Fr}=U/\sqrt{g_{R}L}$
and the Stokes number
 $\mathit{St}=\bar{{\it\rho}}_{p}\bar{d}^{2}U/18{\it\mu}L$
for this flow can be expressed in terms of the particle Reynolds number as
 $$\begin{eqnarray}\mathit{St}=\mathit{Fr}^{2}=\frac{\mathit{Re}_{p}}{18{\it\chi}}\left(\frac{\bar{d}}{L}\right).\end{eqnarray}$$
The results plotted in the paper are in terms of dimensionless variables in which all length scales are non-dimensionalized by the droplet diameter
 $L$
, all velocity scales are non-dimensionalized by particle terminal velocity
 $U$
(computed using (2.4) with the nominal particle diameter and density), and all time scales are non-dimensionalized using
 $L/U$
. Dimensionless variables are denoted by an asterisk.
2.2. Suspension droplets with monodisperse particles
For monodisperse particles, the independent dimensionless parameters of the flow include droplet Reynolds number
 $\mathit{Re}_{d}$
, dimensionless particle diameter
 ${\it\varepsilon}\equiv \bar{d}/L$
, density ratio
 ${\it\chi}={\it\rho}_{f}/{\it\rho}_{p}$
, and the initial number of particles
 $N_{0}$
contained within the droplet. Several previous studies of monodisperse suspension droplets have been reported, which detail how the droplet fall velocity and shape change with variation of these parameters (Nitsche & Batchelor Reference Nitsche and Batchelor1997; Metzger et al.
Reference Metzger, Nicolas and Guazzelli2007; Subramanian & Koch Reference Subramanian and Koch2008; Pignatel et al.
Reference Pignatel, Nicolas and Guazzelli2011). An important characteristic noted in this literature is the tendency of the falling suspension droplet to develop a tail formed of particles that leak away from the droplet near the droplet rear.
Results are reported in the current section for a case with
 $\mathit{Re}_{d}=1.4$
,
 $\bar{d}/L=0.04$
,
 ${\it\chi}=1/3$
and
 $N_{0}=300$
, which serves as a baseline for the polydisperse droplet simulations. The initial particle concentration is given by
 ${\it\phi}_{0}=N_{0}(\bar{d}/L)^{3}\cong 0.019$
and the particle Reynolds number is
 $\mathit{Re}_{p}=0.004$
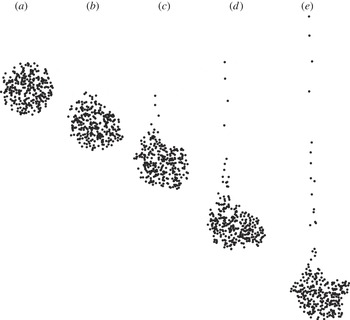
, so the conditions required for use of the oseenlet simulation approach are well satisfied. A time series showing formation of the droplet tail for this baseline case is given in figure 1. The suspension droplet initially has the form of a sphere, but a tail of trailing particles shed from the rear of the droplet gradually develops. The tail grows progressively longer with time since the particles within the tail fall at nearly the terminal velocity for an isolated particle, whereas the particles within the droplet fall at a much faster speed due to the hydrodynamic interaction between the particles. The droplet shape becomes deformed in time, with a slight flattening of the ball-like shape in the vertical direction. The fluid velocity field in a frame travelling with the droplet is similar to that shown by Pignatel et al. (Reference Pignatel, Nicolas and Guazzelli2011). The flow surrounding the droplet has a toroidal structure qualitatively similar to a Hill’s spherical vortex, with stagnation points at the front and back.
Plot showing the formation of a tail behind a falling monodisperse suspension droplet with
 $\mathit{Re}_{d}=1.4$
. Images are shown at times (a)
 $t^{\ast }=0$
, (b) 0.2, (c) 0.4, (d) 0.6 and (e) 0.8.

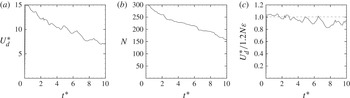
The dimensionless fall velocity of the particles within the droplet,
 $U_{d}^{\ast }$
, and the current number of particles in the droplet,
 $N(t)$
, are plotted in figure 2 as functions of dimensionless time. In order to allow some deformation of the suspension droplet, we use an effective droplet diameter equal to 1.25 to determine which particles are in the droplet, which is 25 % larger than the nominal droplet diameter. All particles are observed to fall within the droplet for a short time at the beginning of the computation (approximately
 $t^{\ast }<0.5$
), following which formation of the droplet tail leads to a gradual decrease in number of particles within the droplet. The fall velocity reaches a maximum value at about
 $t^{\ast }=0.5$
, which is also the time at which the particle tail starts to form. The peak magnitude of the fall velocity is substantially greater than unity, indicating that the suspension droplet falls much faster than an isolated particle. The droplet fall velocity decreases for dimensionless times
 $t^{\ast }$
greater than 0.5 as the particles gradually move from the droplet into the tail and the tail grows progressively longer.
Time variations of (a) the dimensionless droplet fall velocity, (b) the number of particles remaining in the droplet and (c) the ratio of the average droplet fall velocity to the theoretical estimate (2.9). The plots are for monodisperse particles with droplet Reynolds numbers
 $\mathit{Re}_{d}=1.4$
. The dashed line in (c) corresponds to the theoretical HR solution given by (2.9).

A simple theoretical expression for droplet fall velocity is obtained by treating the particle suspension as a droplet of another (immiscible) fluid with effective density
 ${\it\rho}_{d}$
and viscosity
 ${\it\mu}_{d}$
. The solution for drag on a fluid droplet suspended in an immiscible liquid was given independently by Hadamard (Reference Hadamard1911) and Rybczyński (Reference Rybczyński1911) as
 $$\begin{eqnarray}U_{d,HR}=\frac{({\it\rho}_{d}-{\it\rho}_{f})gL^{2}}{12{\it\mu}_{f}}\left(\frac{{\it\mu}_{f}+{\it\mu}_{d}}{{\it\mu}_{f}+\frac{3}{2}{\it\mu}_{d}}\right).\end{eqnarray}$$
The density difference in (2.7) can be written in terms of the particle volume concentration
 ${\it\phi}=N{\it\varepsilon}^{3}$
within the droplet as
 ${\it\rho}_{d}-{\it\rho}_{f}={\it\phi}({\it\rho}_{p}-{\it\rho}_{f})$
. The effective viscosity is given for small concentrations by the Einstein expression
 $$\begin{eqnarray}{\it\mu}_{d}={\it\mu}_{f}(1+{\textstyle \frac{5}{2}}{\it\phi}).\end{eqnarray}$$
Linearizing (2.7) for small concentration values and dividing by the isolated particle fall velocity
 $U$
yields
 $$\begin{eqnarray}U_{d,HR}^{\ast }\equiv \frac{U_{d,HR}}{U}=\frac{6}{5}N{\it\varepsilon},\end{eqnarray}$$
where
 $N$
is the number of particles in the droplet. A plot of the ratio
 $U_{d}^{\ast }(t)/[{\textstyle \frac{6}{5}}N(t){\it\varepsilon}]$
of the computed and theoretical droplet fall velocity as a function of time is given in figure 2(c). The computed value of this ratio is initially close to unity, and then it decreases gradually in time to about 0.9. The oscillations in value of this ratio observed in the figure are a consequence of shape oscillations of the suspension droplet. Pignatel et al. (Reference Pignatel, Nicolas and Guazzelli2011) showed that the finite inertia causes this ratio to decrease below unity and that the value of this ratio can be expressed as a function of the normalized inertial length
 $\ell ^{\ast }\equiv {\it\varepsilon}/\mathit{Re}_{p}$
. For the case considered in the current computation
 $\ell ^{\ast }=10$
, for which the correlation plotted by Pignatel et al. (Reference Pignatel, Nicolas and Guazzelli2011) gives
 $U_{d}^{\ast }(t)/[{\textstyle \frac{6}{5}}N(t){\it\varepsilon}]=0.97$
.
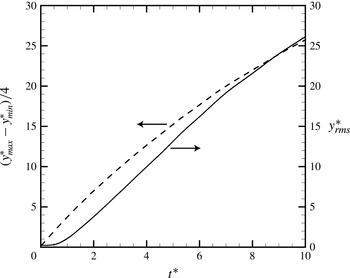
Two measures of the length of the particle tail are shown in figure 3 – the root-mean-square (r.m.s.) position
 $y_{rms}^{\ast }$
of the particles in the
 $y$
direction and the ratio
 $(y_{max}^{\ast }-y_{min}^{\ast })/4$
. For particles that are uniformly distributed between
 $y_{max}^{\ast }$
and
 $y_{min}^{\ast }$
, these two measures would be equal, so the difference between these measures provides an indication of the skewness of the particle distribution. The value of
 $y_{rms}^{\ast }$
remains close to the value for a uniform sphere for
 $t^{\ast }<1$
, after which the growth of the droplet tail causes
 $y_{rms}^{\ast }$
to increase nearly linearly with time. The value of
 $(y_{max}^{\ast }-y_{min}^{\ast })/4$
is larger than the corresponding value of
 $y_{rms}^{\ast }$
, as the presence of the droplet implies a large number of particles with values of
 $y^{\ast }$
near
 $y_{min}^{\ast }$
. Over time, the two measures approach each other as an increasing number of the particles are drawn out into the tail region.
Plot showing the time variation of the r.m.s.
 $y$
position (solid line) and the value of
 $(y_{max}^{\ast }-y_{min}^{\ast })/4$
(dashed line) for a monodisperse droplet.

2.3. Suspension droplets with polydisperse particles
Computations for a wide range of polydisperse suspension droplets have been conducted, including bidisperse cases with different sizes or densities and as well as cases with a distribution of both particle size and density. In the absence of collisions and particle inertia, the particles communicate only through their terminal velocity relative to the surrounding fluid, which as indicated by (2.4) is influenced both by the particle diameter and by the difference between the particle and fluid densities. A particle dispersity measure for bidisperse mixtures can be defined in terms of the particle terminal velocity as
 $$\begin{eqnarray}{\it\beta}\equiv \frac{1}{N}\mathop{\sum }_{n=1}^{N}\frac{|U_{n}-\bar{U}|}{\bar{U}},\end{eqnarray}$$
where
 $U_{n}$
denotes the terminal velocity of particles of type
 $n$
and
 $\bar{U}$
is the mean terminal velocity. For the sake of brevity, the current section presents results for a representative series of cases where half the particles have one density value and the other half have a different density value. The dispersity measure (2.10) for this case reduces to
 ${\it\beta}\equiv |{\it\rho}_{p2}-{\it\rho}_{p1}|/2\bar{{\it\rho}}_{p}$
. A full report of the different computational cases examined is given in the thesis by Faletra (Reference Faletra2014).
An analytical approximation for the maximum fall velocity of a polydisperse suspension droplet was given by Bülow et al. (Reference Bülow, Nirschl and Dörfler2015), which can be written as
 $$\begin{eqnarray}U_{d,HR}=\mathop{\sum }_{n=1}^{N}\frac{6}{5}{\it\varepsilon}_{n}U_{n},\end{eqnarray}$$
where
 ${\it\varepsilon}_{n}=d_{n}/(2r_{d})$
is the dimensionless diameter of particles of type
 $n$
. In the current section we choose
 $|{\it\rho}_{p2}-\bar{{\it\rho}}_{p}|=|\bar{{\it\rho}}_{p}-{\it\rho}_{p1}|$
, so that the maximum droplet fall velocity given by (2.11) is the same for all cases examined.
We begin by examining the effect of droplet concentration on the segregation phenomenon by simulating droplet settling for cases in which the initial number of particles
 $N_{0}$
varies between 50 and 1000, where all other parameters are held constant at
 ${\it\beta}=0.5$
,
 $\bar{d}/L=0.04$
,
 ${\it\chi}=1/3$
,
 $\mathit{Re}_{d}=1.4$
and
 $\mathit{Re}_{p}=0.004$
. A typical case in which particle hydrodynamic interaction has a strong effect on inhibiting particle segregation is that of
 $N_{0}=300$
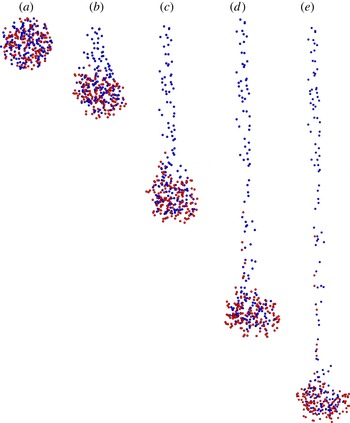
. The early evolution of the droplet in this case is shown in a time series in figure 4. Similar to the simulations for monodisperse particles, the suspension droplet falls with nearly a spherical shape with a tail of trailing particles shed from the rear of the droplet. As time passes, the tail grows progressively longer because the particles in the tail fall at approximately the terminal velocity of an isolated particle, whereas the particles in the droplet fall much faster due to the hydrodynamic interaction between the particles in the droplet. Owing to the strong particle hydrodynamic interactions, some of the light particles are able to remain inside the suspension droplet for a long period of time. At the same time, it is clear that the lighter particles have a much higher probability of passing into the droplet tail than do the heavier particles, particularly near the start of the computation. The heavier particles do eventually start to enter into the tail, but at a lower rate than the lighter particles. At long time, a point is reached where all of the light particles are removed from the droplet and form a very long tail, after which the rate at which particles enter into the tail decreases significantly.
Time series of a droplet with
 $N_{0}=300$
, showing preferential leakage of lighter particles into the droplet tail, for a case with particles with two densities with
 ${\it\beta}=0.5$
. Images are shown at times (a)
 $t^{\ast }=0$
, (b) 0.2, (c) 0.4, (d) 0.6 and (e) 1.0. The light particles are shown in blue and the heavy particles in red.

For small numbers of particles (e.g.
 $N_{0}=50$
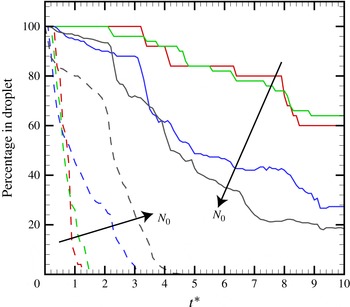
or 100), the weak hydrodynamic interaction between the particles is insufficient to significantly slow down the separation of light and heavy particles that occurs due to the difference in terminal velocity. The particles of the two densities separate as two dispersed clouds before the suspension droplet has fallen more than a few droplet diameters. A comparison of cases with different initial concentration values is given in figure 5, in which the percentage of initial particles that remain in the droplet is plotted as a function of time for cases with
 $N_{0}=50$
, 100, 300 and 1000. These percentages are shown separately for the light particles and the heavy particles. The results for cases with
 $N_{0}=50$
and 100 are almost the same, and both are typical of cases in which the amount of hydrodynamic interaction is too small to significantly inhibit particle segregation. An increase in value of
 $N_{0}$
above 100 results in delay of the separation of light particles from the droplet and an increase in the rate of separation of heavy particles from the droplet. The delay in separation of light particles is due to the strong recirculating flow surrounding the droplet, which acts to suspend particles with different terminal velocities. The increase in rate of transport of the heavier particles into the tail for large values of
 $N_{0}$
is opposite to the trends observed for leakage rate in monodisperse suspension droplets, for which the leakage rate decreases with increase in
 $N_{0}$
(Metzger et al.
Reference Metzger, Nicolas and Guazzelli2007; Pignatel et al.
Reference Pignatel, Nicolas and Guazzelli2011). We speculate that the increase in leakage rate for the polydisperse cases with large
 $N_{0}$
is a consequence of the disturbance to the heavy particles caused by relative motion with the lighter particles. The cases with large
 $N_{0}$
values are more susceptible to these disturbances because the light particles remain in the droplet for a longer time period than is the case with smaller values of
 $N_{0}$
.
Percentage of initial particles remaining in the droplet as a function of dimensionless time for different values of the initial particle number
 $N_{0}$
. Heavy particles (solid lines) and light particles (dashed lines) are shown for a series of cases with
 ${\it\beta}=0.5$
and
 $\mathit{Re}_{d}=1.4$
. Colours correspond to cases with
 $N_{0}=50$
(red), 100 (green), 300 (blue) and 1000 (black).

Cases in which the suspension droplet dynamics are dominated by hydrodynamic interaction between the particles are of particular interest, since these cases provide an illustration of the ability of hydrodynamic interaction to inhibit particle segregation. To explore such problems further, results are reported for a series of computations with different values of
 ${\it\beta}$
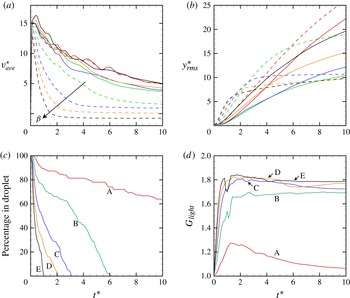
, but with all other parameters fixed to the same values as used for the simulation shown in figure 4. The average particle fall velocity
 $v_{\mathit{ave}}^{\ast }=-\text{d}y_{\mathit{ave}}^{\ast }/\text{d}t^{\ast }$
is plotted as a function of time in figure 6(a) for values of
 ${\it\beta}$
ranging between 0.1 and 0.9. This velocity is computed separately for the light and heavy particles, which are plotted in figure 6(a) using dashed and solid curves, respectively. The fall velocity of all particles reaches a maximum value at about
 $t^{\ast }=0.4$
, with roughly the same value for both light and heavy particles. The value of
 $v_{\mathit{ave}}^{\ast }$
decreases with time after this peak value is achieved, which is associated with the decrease in number of particles in the droplet as a result of tail formation. Because the light particles have a greater tendency to move into the tail than do the heavy particles, the average fall velocity of the light particles decreases with time more quickly than for the heavy particles. Since the isolated particle fall velocity (and hence also the fall velocity of particles in the tail) decreases with decrease in particle density
 ${\it\rho}_{n}$
, the average fall velocity of the light particles in figure 6(a) decreases as
 ${\it\beta}$
increases. For the case with
 ${\it\beta}=0.9$
, the light particles have lower density than the surrounding fluid and the long-time value of
 $v_{\mathit{ave}}^{\ast }$
for these particles is negative (indicating that the particles rise upwards in the fluid). The fall velocity for the heavy particles is observed to have a similar value for all values of
 ${\it\beta}$
examined.
Effect of density difference on time variation of (a) the average fall velocity, (b) the r.m.s. value of
 $y$
, (c) the percentage of light particles remaining in the droplet (based on total number initially in droplet) and (d) the mixing measure
 $G_{\mathit{light}}$
for the light particles. Results in (a) and (b) are shown for both the heavy particles (solid lines) and the light particles (dashed lines) with
 $N_{0}=300$
. In all four panels, curves are shown for
 ${\it\beta}$
values of 0.1 (red lines, A), 0.3 (green lines, B), 0.5 (blue lines, C), 0.7 (orange lines, D) and 0.9 (black lines, E).

The degree of particle spread in the vertical direction is quantified using the r.m.s. position of the particles in the
 $y$
direction,
 $y_{rms}^{\ast }$
, which is plotted as a function of time in figure 6(b). Small values of
 $y_{rms}^{\ast }$
can be achieved either if particles all remain in the droplet or if particles are quickly removed from the droplet and pass into the tail. The largest values of
 $y_{rms}^{\ast }$
occur when particles move very slowly from the droplet into the tail. The rate of passage of the light particles from the droplet into the tail can be quantified by plotting the percentage of the initial light particles that remain in the droplet as a function of time, shown in figure 6(c). The results indicate a monotonic increase in the segregation rate as the value of
 ${\it\beta}$
increases.
By observing the difference in the value of
 $y_{rms}^{\ast }$
for the heavy and light particles in figure 6(b), we can infer the different extents to which the two types of particles have become spread out into the droplet tail. For the case with
 ${\it\beta}=0.1$
, there is only a slight difference in density between the two particles types, and the values of
 $y_{rms}^{\ast }$
in figure 6(b) consequently remain fairly close to each other, with the
 $y_{rms}^{\ast }$
values for the lighter particles slightly higher due to their greater tendency to pass into the droplet tail. Cases with
 ${\it\beta}$
values ranging from 0.3 to 0.9 exhibit very different values of
 $y_{rms}^{\ast }$
between the two particle types. For the heavy particles, particles with densities closest to the nominal density (small
 ${\it\beta}$
) have the smallest values of
 $y_{rms}^{\ast }$
, and particles with higher densities (larger
 ${\it\beta}$
) have larger values of
 $y_{rms}^{\ast }$
. A similar trend holds during the initial part of the calculation for the lighter particles. However, as time progresses, the value of
 $y_{rms}^{\ast }$
for the light particles is observed to asymptote to a nearly constant value. Both this asymptotic value and the time at which this flattening of the
 $y_{rms}^{\ast }$
curve occurs decrease as
 ${\it\beta}$
increases. In this asymptotic state, all of the lighter particles have been removed from the droplet and passed into the tail. Since all of the light particles in the tail fall at approximately the same speed, the value of
 $y_{rms}^{\ast }$
for the light particles remains approximately constant in this state.
There are numerous mixing and segregation indices used in the literature, many of which are adopted for specific problems (Jain, Ottino & Lueptow Reference Jain, Ottino and Lueptow2005; Li & McCarthy Reference Li and McCarthy2005). A mixing index proposed for discrete element method (DEM) simulations by Asmar, Langston & Matchett (Reference Asmar, Langston and Matchett2002) would seem to be applicable for the problem addressed in the current paper. In this paper, a generalized mean mixing index is defined for a given coordinate direction (say,
 $y$
) as
 $$\begin{eqnarray}G_{i}=\frac{\displaystyle \frac{1}{N_{i}}\mathop{\sum }_{j=1}^{N_{i}}(y_{j}-y_{ref})}{\displaystyle \frac{1}{N_{tot}}\mathop{\sum }_{k=1}^{N_{tot}}(y_{k}-y_{ref})},\end{eqnarray}$$
where
 $y_{ref}$
is taken as the minimum value of
 $y$
occupied by any of the particles. The numerator of (2.12) is a sum over all
 $N_{i}$
particles of type
 $i$
, whereas the denominator is a sum over all
 $N_{tot}$
particles in the system. A value of
 $G$
equal to unity indicates that particle type
 $i$
is distributed within the solution domain in a similar manner to all of the other particles. A value of
 $G$
less than unity indicates that particles of type
 $i$
tend to have lower value of
 $y$
than the average value for the entire particle set, and a value greater than unity indicates that particles of type
 $i$
tend to have higher values of
 $y$
than the average value for the entire particle set.
The mixing measure
 $G_{\mathit{light}}$
for the light particles is plotted as a function of time for different values of
 ${\it\beta}$
in figure 6(d). The initial value of
 $G_{\mathit{light}}$
is equal to unity for all cases, indicating that the initial condition is well mixed. For small values of
 $t^{\ast }$
, the value of
 $G_{\mathit{light}}$
increases with time as the lighter particles preferentially segregate into the droplet tail. At a point around
 $t^{\ast }\approx 1.5$
, a maximum value of
 $G_{\mathit{light}}$
is attained, after which the mixing measure gradually decreases for the remainder of the computation as the heavier particles begin to enter into the droplet tail in larger numbers. For
 ${\it\beta}\leqslant 0.5$
, the value of the mixing measure is found to exhibit a marked increase with increase in
 ${\it\beta}$
, indicating that the extent of particle segregation becomes substantially greater as the density difference between the particles increases. The trend breaks down for
 ${\it\beta}>0.5$
, where we notice that the three cases with
 ${\it\beta}=0.5$
, 0.7 and 0.9 all have similar values of the mixing measure.
It is of interest to compare the differences between computational results for polydisperse droplets with the stokeslet and oseenlet simulation methods. A similar comparison was reported for monodisperse droplets by Pignatel et al. (Reference Pignatel, Nicolas and Guazzelli2011), who found that stokeslet- and oseenlet-based simulations produced similar results for values of the normalized inertial length
 $\ell ^{\ast }\geqslant 50$
, but exhibited significant differences for values of
 $\ell ^{\ast }$
significantly less than 50. For the current bidisperse droplet simulations
 $\ell ^{\ast }=10$
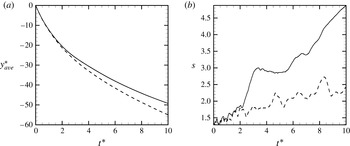
, and so differences between the two simulation approaches would be expected. A comparison between results of a simulation with
 ${\it\beta}=0.5$
with the oseenlet- and stokeslet-based simulations is given in figure 7 for the average
 $y$
position
 $y_{\mathit{ave}}^{\ast }$
and for a measure of droplet size defined by
 $s\equiv [(x_{max}-x_{min})^{2}+(z_{max}-z_{min})^{2}]^{1/2}$
. It is clear from figure 7 that the oseenlet simulations have a slower fall velocity, which is associated with a more rapid increase in droplet size (and hence decrease in particle concentration) in the oseenlet simulations compared to the stokeslet simulations. It is noted that, after subtracting the uniform flow, the far-field flow in the Oseen solution for flow past a sphere consists of a potential source with
 $O(1/r^{2})$
velocity magnitude decay for all angles except for the narrow wake region immediately behind the sphere, within which there exists an inflowing velocity directed towards the sphere with
 $O(1/r)$
velocity magnitude decay. This flow field contrasts with the symmetric streamlines exhibited by the Stokes solution of the same problem. As discussed by Subramanian & Koch (Reference Subramanian and Koch2008), the source flow in the Oseen solution introduces a weak repulsion of the particles within the droplet, which over time causes the droplet size to increase. Aside from this difference, however, the nature of the segregation phenomenon was similar for the two simulation approaches, and indeed segregation measures such as the mixing measure
 $G_{\mathit{light}}$
and the percentage of light particles remaining in the droplet as a function of time (as shown in figure 6) are nearly identical for the two simulation approaches.
Comparison of (a) average particle position
 $y_{\mathit{ave}}^{\ast }$
and (b) droplet width measure
 $s$
for oseenlet-based simulations (solid lines) and stokeslet-based simulations (dashed lines) for a case with
 ${\it\beta}=0.5$
.

3. Experimental method and results
3.1. Experimental method
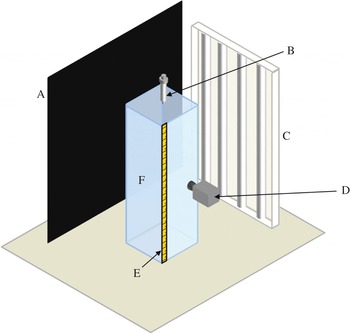
A series of experiments were conducted in which a particle suspension droplet settles in a container filled with a transparent fluid. A diagram of the experimental set-up is given in figure 8. The vessel used in the experiments has inner cross-sectional dimensions of 9 cm by 9 cm, and was filled with the working fluid to a height of 28 cm. The fluid used in the experiments consisted of a mixture of water-soluble UCONN oil and water to create a fluid with a kinematic viscosity of
 $174\times 10^{-6}~\text{m}^{2}~\text{s}^{-1}$
and a density of
 $0.95~\text{g}~\text{cm}^{-3}$
. The container was illuminated from the side with white light from four 6400K fluorescent tubes. A ruler with millimetre scale spanning the container height was attached to the other side, and the container was placed in front of a black background. The video camera used to capture the images of the falling droplet was a Sony HDR-SR12 with a frame rate of 30 frames per second.
Diagram of the experimental set-up including (A) the black background, (B) the injection syringe, (C) the lighting system, (D) the video camera, (E) the ruler and (F) the vessel.

Combinations of four different types of spherical particles were used in the experiments, the characteristics of which are given in table 1. The particle size distributions were measured using a digital imaging system (Image Pro Plus 6.0, Media Cybernetics), where the diameter given in table 1 is the mean diameter and the uncertainty stated is equal to one standard deviation, with sample sizes between 70 and 100 particles. The particle density was calculated by measuring the mass of a sample of particles and dividing it by the measured volume of the same sample. The mass was measured with a scale that has a precision of 0.0001 g, and the volume was measured by putting the sample into a graduated cylinder with a 0.2 ml scale and adding a known volume of water into the graduated cylinder. The error in the density value that is given is calculated using the standard error propagation equation from the known uncertainty of the mass and volume measurements. The measured values of both the particle diameters and densities were found to be consistent with manufacturer specified values. The terminal settling velocity of each particle is determined by measuring the position and time from a series of time-stamped frames pulled from a video of the falling particle, with a time precision of 0.03 s and a length precision of 1 mm. The average particle velocity is calculated by averaging the velocity from 20 samples, and the uncertainty is equal to one standard deviation from the mean.
Characteristics of particles used in the experiments.

The particle suspension was formed by first measuring out the two sets of particles to be used in the given experiment. The particle number ratio,
 $N_{1}/N_{2}$
, for all of the experiments was set equal to unity. To estimate particle number, tweezers were used to count out 100 particles of each particle type, and the mass of the 100 particles was recorded with an accuracy of 0.0001 g. Using these values, the number of particles in a sample was obtained by measuring the sample’s mass and dividing by the mass per particle. Once an equal number of particles of each type were measured, both sets of particles were put in a small closable container and the container was vigorously shaken. The particles were then put into a syringe with a 4 mm diameter opening and, with the syringe extended to leave empty space for mixing, the syringe was vigorously shaken to ensure that the particles were well mixed. Fluid from the vessel was then added to the particles in the syringe, and the syringe was vigorously shaken again to ensure an even distribution of the two types of particles within the suspension. The particle suspension was injected into the fluid in the test vessel by holding the syringe vertically with the syringe tip about 1 cm above the surface of the fluid. The suspension was manually injected into the container by applying slight pressure to the syringe, causing a droplet to slowly form at the end of the syringe. The droplet falls into the fluid when the weight of the droplet exceeds the surface tension force between the droplet and the syringe.
The number of particles in the suspension droplet was estimated by measuring the mass of a series of droplets that were dripped onto a surface, using the same approach for droplet generation as used in the experiments. Sample sizes of 21, 20 and 28 were used for experiment sets 1, 2 and 3, respectively. The known droplet concentration was then used to calculate the approximate number of each particle type in each sample droplet. The average total number of particles in a droplet and the associated r.m.s. uncertainty were computed from the sample, giving the values listed in table 2. Each droplet consisted of approximately even amounts of
 $N_{1}$
and
 $N_{2}$
, with an uncertainty equal to half of the uncertainty for
 $N_{0}$
listed in table 2.
Parameters characterizing the experimental datasets. The average values of the initial particle droplet diameter
 $L$
, the droplet Reynolds number
 $\mathit{Re}_{d}$
, and the initial number of particles
 $N_{0}$
are averaged over the different experimental runs.

3.2. Experimental results
Experimental runs were first performed in a vessel filled with a lower-viscosity fluid to examine the evolution of a suspension droplet with much lower particle concentration. The lower-viscosity fluid allowed for the falling particles to spread out more with the initial impact and form a suspension droplet with a much lower initial concentration. Similar to what was observed in the computations with low particle concentrations (figure 5), the two types of particles immediately start to separate from each other and there is no droplet tail formation. Because the particles are spread out from each other, there is significantly less hydrodynamic interaction between the falling particles, which is the driving mechanism for tail formation.
As we are primarily interested in particle segregation in cases with significant particle hydrodynamic interaction, the primary focus of the experiments was on cases with sufficiently large particle concentration that the entire particle set settles downwards as a single droplet, with the exception of the thin tail that trails behind the droplet. Three sets of experiments were performed, with multiple runs performed for each set. The characteristics of each set are listed in table 2. In experiment set 1, the particles have the same density but different particle radii. In experiment set 2, the particles have nearly the same radius, but different densities. In experiment set 3, both the particle radius and density are different. The mean values of
 $L$
and
 $\mathit{Re}_{d}$
were determined by averaging results from five, nine and eight runs for experimental sets 1, 2 and 3, respectively. In some of the experimental runs, the droplet was initially teardrop-shaped instead of spherical, as a result of its injection into the fluid in the vessel. In such cases, the particles that enter the fluid last are the ones contained in the rear of the teardrop, and are observed to quickly break apart from the droplet, leaving a roughly spherical droplet composed of the remaining particles. All of the experimental analysis starts with the droplet in this spherical shape, and does not include the particles that were separated from the droplet at the time of initial injection.
Runs with experimental set 1 were conducted to study the problem of a falling suspension droplet containing particles of two different sizes, with
 ${\it\alpha}\equiv |r_{p2}-r_{p1}|/\bar{d}=1.43$
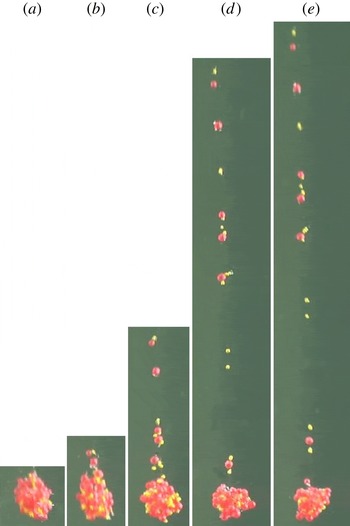
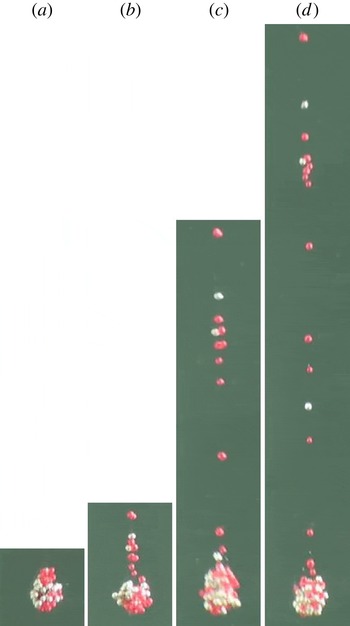
. Figure 9 shows a time series of frames of the settling suspension droplet falling, where the large particles (red) are about 2.2 times larger than the small particles (gold). The tail that forms behind the droplet consists of both small and large particle sizes, but the small particles are more numerous in the tail region than the large particles. Runs with experimental set 2, shown in figure 10, were conducted to study the problem of a falling suspension droplet containing particles of two different densities, with
 ${\it\beta}=0.067$
. The heavy particles (silver) are 14 % heavier than the light particles (red). The droplet tail contains both heavy and light particles, but the light particles are significantly more numerous. Experimental set 3, shown in figure 11, compares particles with a substantial difference in both particle size and density, with
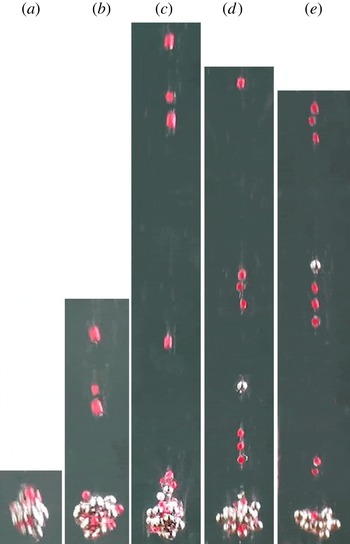
 ${\it\alpha}=0.44$
and
 ${\it\beta}=0.473$
. The tail behind the droplet consists of only smaller/lighter particles for the initial part of the run, until eventually one larger/heavier particle enters the tail.
Photos of the particle positions of a falling droplet, with initial droplet diameter
 $L=3.8~\text{mm}$
, in experimental set 1 at dimensional times (s): (a)
 $t=0$
, (b)
 $t=0.8$
, (c)
 $t=1.8$
, (d)
 $t=3.8$
and (e)
 $t=4.3$
. The large particles (red) are about 2.2 times larger than the small particles (gold).

Photos of the particle positions of a falling droplet, with initial droplet diameter
 $L=4~\text{mm}$
, in experimental set 2 at dimensional times (s): (a)
 $t=0$
, (b)
 $t=1.2$
(c)
 $t=2.7$
and (d)
 $t=4.2$
. The heavy particles (silver) are 14 % heavier than the light particles (red).

Photos of the particle positions of a falling droplet, with initial droplet diameter
 $L=3.5~\text{mm}$
, in experimental set 3 at dimensional times (s): (a)
 $t=0$
, (b)
 $t=0.44$
, (c)
 $t=0.94$
, (d)
 $t=1.4$
and (e)
 $t=1.74$
. The large/heavy particles (silver) are 27 % larger and 3.2 times heavier than the small/light particles (red).

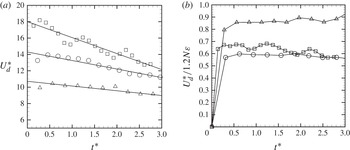
Plots of the droplet fall velocity with time are shown in figure 12(a) for experiment sets 1–3. To calculate the velocity, position and time data are obtained from a series of time-stamped video frames with a time precision of 0.03 s and a length precision of 1 mm. The uncertainty of the experimental droplet fall velocity is computed using the standard propagation-of-error equation from the measured uncertainty in the change in particle distance and the change in time, and is found to be
 $1.0$
,
 $1.0$
and
 $8.7~\text{mm}~\text{s}^{-1}$
for sets 1, 2 and 3, respectively. As was also observed in the computational study discussed in § 2, the droplet velocity decreases with time due to the loss of particles from the droplet as the particles migrate into the tail.
(a) Experimental droplet fall velocity versus time for experimental set 1 (squares), set 2 (circles) and set 3 (triangles). The lines are fits to the data. (b) Droplet fall velocity divided by the theoretical HR solution in (2.9).

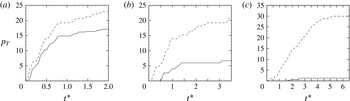
The percentage of each particle type that is contained in the tail was calculated as a function of time. The uncertainty in the time is 0.03 s, and the uncertainty in the particle count is one particle. The experimental values varied significantly between different runs from the same experimental set due to variation in the initialization of the droplets. The mean values are plotted in figure 13(a–c) for all of the experiment sets. The standard deviation of these values is recorded as 3.0 for the dashed line and 5.5 for the solid line in figure 13(a), 6.4 for the dashed line and 3.1 for the solid line in figure 13(b), and 10.3 for the dashed line and 1.5 for the solid line in figure 13(c). Similarly large variation between runs of the same set also occurred in the experiments of Metzger et al. (Reference Metzger, Nicolas and Guazzelli2007). The plots in figure 13 are consistent with our previous computational observation that the lighter/smaller particles were the dominant particles in the tail, and that the percentage of larger/heavier particles in the tail decreases with increasing values of
 ${\it\beta}$
and
 ${\it\alpha}$
.
Plots showing the percentage
 $p_{T}$
of each type of particle contained in the vertical tail as a function of dimensionless time for (a) experimental set 1, (b) set 2 and (c) set 3. Percentages are based on the total number of each type of particle. Solid lines represent heavier (or larger) particles and dashed lines represent lighter (or smaller) particles.

The experimental droplet fall velocity was divided by the theoretical solution (2.9) and is plotted with time in figure 12(b). The droplet fall velocity is non-dimensionalized by dividing by the average isolated particle settling speed for the different particle types that make up the droplet. These isolated settling speeds were obtained empirically, and are listed in table 2. The droplet diameter is measured with digital imaging software and has an uncertainty of 1 mm. The number of particles in the droplet with time is calculated by subtracting the number of particles counted in the tail at that time from the initial number of particles in the droplet. The uncertainty of the experimental droplet fall velocity divided by the theoretical solution (2.9) is computed using the standard propagation-of-error equation from the measured uncertainty in the fall velocity and the number of particles, and is found to be 0.16, 0.03 and 0.25 for sets 1, 2 and 3, respectively. Figure 12(b) shows that the value of the experimental droplet fall velocity divided by the theoretical solution remains approximately constant with time at mean values of approximately 0.65, 0.58 and 0.85 for sets 1, 2 and 3, respectively. The experimental values of this velocity ratio are close to the value obtained computationally using the oseenlet-based method, as shown in figure 2(c).
4. Conclusions
An investigation of the segregation of polydisperse particles of different sizes and densities in a settling suspension droplet was performed using both computations and experiments. The computations approximated the particle hydrodynamic interaction using an oseenlet-based simulation method that allows finite (non-small) values of the droplet Reynolds number, while still requiring that the particle Reynolds number is small. The experiments were conducted by observing the fall of suspension droplets formed of binary particle mixtures consisting of particles with different sizes and densities in a viscous fluid.
The computational method requires low values of particle concentration and the experimental procedure requires high concentration values for polydisperse mixtures, so the results of the two could not be directly compared. Nevertheless, there is strong qualitative agreement between the experimental and computational results with regard to the qualitative behaviour of the flow. Both computations and experiments were performed for parameter values consistent with the macro-scale inertia regime of suspension droplet motion, and for both cases the particle hydrodynamic interactions were sufficiently important that the droplet settling speed was approximately an order of magnitude larger than the terminal velocity of an isolated particle. The computed fall velocity of the suspension droplet was compared against an approximate theoretical solution, and the ratio of the computed to the theoretical values of droplet fall velocity are found to be consistent both with experimental results from our study and with experimental and computational solutions obtained by other investigators.
The dynamics of bidisperse suspension droplets depends strongly on the particle concentration. For low concentrations, the amount of particle hydrodynamic interaction is insufficient to oppose the gravitational separation of the particles, and the particle type with larger terminal velocity quickly pulls away from the slower particles, leaving a deformed cloud of the slower particles behind. When the particle concentration is sufficiently large, the particle hydrodynamic interaction is sufficient to hold particles of both types together within the suspension droplet, thus inhibiting particle separation and allowing the droplet to settle as a single unit. A falling suspension droplet with high concentration develops a thin tail of trailing particles that slowly leak out from the rear portion of the droplet. A novel segregation mechanism is observed to occur by which the particles with smaller terminal velocity have a preferential tendency to be transported into the droplet tail, whereas particles with higher terminal velocity have a higher tendency to remain within the suspension droplet.
The essential problem examined in this paper concerns the inhibition of particle segregation by the hydrodynamic interaction of the particles in a situation where the particle terminal velocity differs within the mixture. This difference in terminal velocity acts to try to pull apart the mixture (enhancing segregation), whereas the hydrodynamic interaction acts to hold the mixture together (suppressing segregation). However, even in cases with strong hydrodynamic interaction, segregation still occurs within certain regions of the mixture near the edges of the suspension droplet, and particularly near the droplet rear stagnation point. This basic problem occurs in many different particulate flow problems in which particle agglomerates or clusters are transported relative to the surrounding fluid. The model problem examined in the current paper should provide insight into the ability of clusters formed of a mixture of different particle sizes and densities to hold their structure even in the presence of differences in drag and other fluid forces, which attempt to tear the cluster apart.
Acknowledgements
The work of J.S.M. and M.F. was supported by NASA EPSCoR under projects NNX07AK92A and NNX08AZ07A and by the US National Science Foundation under projects CBET-1332472 and DGE-1144388. The work of S.L. and M.Y. was supported by the National Natural Science Funds of China (no. 50976058).