The issue of immigration has taken center stage in many developed democracies, from the United States and the United Kingdom to the Netherlands and Italy.Footnote 1 Facing growing immigrant populations and significant popular pressure, governments in both hemispheres are paying renewed attention to immigration. One prominent explanation for that popular pressure, and for native-born attitudes toward immigrants generally, emphasizes the cultural distinctiveness of many contemporary immigrants. In the United States,Footnote 2 the Netherlands,Footnote 3 and in other developed democracies,Footnote 4 immigrants who do not share the host society's dominant religious or ethnic background are commonly viewed in a more negative light than are other immigrants.Footnote 5
Prior scholarship on the sources of immigration attitudes has framed the question as a competition between economic and cultural explanations.Footnote 6 Yet the cultural category is a broad and residual one, defined primarily by the economic motives it excludes. The inter-group distinctions that are termed ‘cultural’ range from those based on language, religion, or education to those based on skin tone, race, or ethnicity. Past research has been less attentive to the types of cultural distinctions that are especially influential in shaping attitudes toward immigration,Footnote 7 and it has rarely made explicit comparisons between different types of cultural distinctions. Do the various types of inter-group distinctions that fall under the ‘cultural’ heading influence native-born attitudes in similar ways, with immigrants who are more culturally distinctive from the native-born generating more hostile responses? And if not, what characterizes those immigrant–native distinctions that are influential?
To answer those questions, this article presents two realistic survey experiments conducted with nationally representative samples of non-Hispanic Americans.Footnote 8 It focuses on attitudes toward Latino or Hispanic immigration, as 54 percent of contemporary immigrants to the United States are from Latin America.Footnote 9 Latinos are among the fastest growing ethnic groups in the United States, and as of 2011, they accounted for 16 percent of the US population. This demographic change is already having profound political consequences: the Latino share of the American electorate has grown by more than 300 percent since 1988.Footnote 10
By varying features of a Latino immigrant shown in a news clip, these experiments enable us to examine two immigrant–native distinctions that are evident even during brief encounters: skin tone and language. Unlike religious differences, these types of inter-group distinction are widely applicable to contemporary immigrants in the United States.Footnote 11 And unlike educational differences,Footnote 12 these immigrant–native distinctions have not already been subject to extensive study. Language in particular has become a central symbol in contemporary American immigration debates.Footnote 13 Both of these types of immigrant–native distinction are salient in Canada and Europe as well.Footnote 14
The rich and varied literature on ethnocentrism and stereotyping yields divergent hypotheses about how differentiated out-group hostility is likely to be. One prominent theoretical approach, based on claims about ethnocentrism and social identities,Footnote 15 leads us to expect that indicators of out-group membership will heighten negative attitudes toward immigrants. In this view, the specific source of distinction is less important than the fact of inter-group distinction.Footnote 16 The use of a foreign language, the use of English with a non-native accent, and darker skin tones are all salient indicators of group membership that could enable distinctions between immigrants and the native-born and increase hostility accordingly. At its core, this theoretical approach conceives of out-group hostility as relatively undifferentiated – and the approach is both prominent and parsimonious.
But differences in language or skin tone might also operate in more subtle and content-specific ways, a possibility suggested by research on stereotypes.Footnote 17 How non-Hispanic Americans respond to an immigrant's language use might hinge on specific elements of the situation, such as how well the particular immigrant fits with their preconceptions about immigrants and the specific norms that the immigrant evokes.Footnote 18 In the domain of immigration, the relevant norms are typically those about work, assimilation, and cultural adaptation. For example, immigrants who speak English with a pronounced non-native accent might counteract negative stereotypes about immigrants’ unwillingness to assimilate. As we will see, the disparate predictions that emerge from such approaches have an underlying commonality: they all view out-group hostility as differentiated and target-specific.
To test these and related hypotheses, this article uses population-based survey experiments conducted by Knowledge Networks (KN)Footnote 19 that together include nearly 3,000 respondents. KN's survey participants are recruited through two stages of probabilistic sampling from the US population, making these results likely to generalize widely. In both experiments, respondents assigned to treatment conditions watched professionally edited ABC News clips about immigration policy. Imitating a common television practice, the clips show a blurred, still photograph of an undocumented immigrant voicing support for the policy proposal in question. In these images, the immigrant's skin tone is experimentally manipulated to be light or dark. Also, the immigrant's voice-over is randomly assigned to be fluent Spanish, broken/accented English, or fluent English. The ‘broken English’ condition allows us to test whether markers of out-group status are sufficient to produce negative attitudes, or whether concerns about language are primarily concerns about communication. In short, the experiment was designed to vary two salient immigrant–native distinctions in a setting that was as realistic as possible.
As the results illustrate, salient immigrant–native distinctions do not always evoke ethnocentrism. Seeing an immigrant with darker skin is not associated with any change in support for a pathway to naturalization. Also, immigrants who speak fluent Spanish have no significant effect as compared to those speaking fluent English. The widespread expectation that a less assimilated, more culturally distinctive immigrant would earn less supportFootnote 20 proves not to be the case. Instead, when immigrants signal adherence to American norms, out-group markers such as pronounced non-native accents can actually generate more pro-immigrant attitudes. These results reinforce the centrality of norms around language and assimilation in shaping immigration-related attitudes.Footnote 21 In this case at least, anti-immigration attitudes prove target-specific.
At the same time, these findings help us understand the similarities and differences between attitudes on policies affecting blacks and attitudes on immigration policies, a point developed in the Conclusion. Skin-tone primes have been shown to influence non-Hispanic whites’ attitudes toward blacks. Yet within the broader category of Latino immigrants, dark-skinned immigrants do not generate more hostile policy attitudes. Still, out-group members in both domains can evoke more sympathetic policy responses when acting in accordance with widely shared norms.Footnote 22 Thus immigration attitudes parallel whites’ attitudes toward blacks more in the mechanisms through which they operate than the specific cues which prove influential.
Theory
For generations, scholars have studied the factors that make inter-group hostility more or less likely.Footnote 23 Yet the varied theoretical approaches to this question reach different conclusions on a fundamental point: to what extent is out-group hostility target-specific? Put differently, does out-group hostility vary based on the specific traits and stereotypes associated with particular groups, or is it relatively undifferentiated? In this section, we first classify earlier approaches to inter-group relations and the study of immigration based on how the authors addressed those questions. Drawing from two theoretical traditions – one grounded in studies of ethnocentrism, the other in studies of stereotypes – we then develop specific hypotheses about skin tone, language, and their potential effects on immigration attitudes.
Theories Based on Ethnocentrism
One starting point in thinking about the impacts of immigrants’ cultural differences comes from theories of prejudice,Footnote 24 ethnocentrism,Footnote 25 and social identity.Footnote 26 To be sure, these viewpoints are themselves rich and varied. But they have in common an emphasis on individuals’ use of in-groups and out-groups as a basic tool to manage the social world. In Tajfel's words, individuals seek social meaning and self-esteem ‘through the creation of inter-group differences when such differences do not in fact exist, or the attribution of value to, and the enhancement of, whatever differences do exist’.Footnote 27 Similarly, Kinder and Kam define ethnocentrism as a ‘predisposition to divide human society into in-groups and out-groups’,Footnote 28 and follow Adorno et al. by terming it ‘prejudice, broadly conceived’.Footnote 29 Yet whereas prejudice ‘is hostility directed at a specific group’, ethnocentrism is less differentiated or specific to a given out-group.Footnote 30
One implication of the ethnocentrism-based approach is that the very fact of inter-group distinction is sufficient for some level of preference toward in-group members, irrespective of the distinctions that distinguish the groups.Footnote 31 Lending empirical support, Sniderman et al. demonstrate that Italian respondents report similar attitudes toward immigrants from Africa and Eastern Europe: it is the immigrant–native distinction, not distinctions among immigrants, that matters.Footnote 32 Similarly, Sniderman and Hagendoorn find the same structure in Dutch respondents’ views of immigrants from Turkey, Morocco, and Surinam, leading them to observe that ‘consistency – across criticisms and across groups – is the hallmark of prejudice’.Footnote 33 Kinder and Kam make a parallel argument about non-Hispanic white Americans’ attitudes toward other racial and ethnic groups, pointing out that ‘[w]hat whites think about one out-group is quite consistent with what they think about another, just as ethnocentrism requires’.Footnote 34 In the US case, non-Hispanic whites who hold negative views of Asian Americans or Latinos are likely to hold negative views of African Americans as well. The same holds true for non-Hispanic whites’ views of Muslims.Footnote 35 Kinder and Kam also find that general ethnocentrism predicts attitudes on immigration policy almost as well as group-specific attitudes.Footnote 36 Across various examples, this scholarship conceives of ethnocentrism as not distinguishing among targeted groups.
Certainly, not all types of inter-group distinction are equally likely to generate such dynamics. But scholars have considered interpersonal similarity to be a central element in how people define in-groups and out-groups since at least the work of Campbell.Footnote 37 From the undifferentiated perspective, we should expect salient, socially meaningful distinctions to produce negative attitudes, whether they are based on skin tone, language, or another cleavage. Simply put, immigrants who are more distinctive from the native-born should engender more hostility.Footnote 38
Theories Based on Stereotypes
Other scholarship suggests that not all inter-group distinctions are the same, and that the use of social categories such as ‘immigrant’ or ‘native’ depends on factors including those categories’ cognitive accessibility and their applicability to the situationFootnote 39 as well as their content.Footnote 40 In this view, not all stereotypes are equally applicable to a particular group or context, and so not all stereotypes are equally influential.Footnote 41 In the case of post-1994 immigration to the United States, for example, Valentino, Brader, and Jardina show that immigration attitudes correlate not with ethnocentrism generally but with attitudes toward Latinos specifically – and that media coverage of immigration was disproportionately coverage of Latino immigration during that period.Footnote 42 These general claims give rise to various theories, only a subset of which are discussed here.
One such theory holds that the social categories which are most likely to be employed are those which are most cognitively accessible. In the United States, past research indicates that distinctions between blacks and whites are likely to be highly accessible, as they are unparalleled in their capacity to induce group-based thinking.Footnote 43 Consider Winter, which outlines an individual-level mechanism through which racial thinking can influence attitudes on policies that are not obviously connected to race.Footnote 44 In making sense of today's immigrants, people are likely to draw on salient mental schemas from analogous areas. Black–white racial differences are one such area: ‘racial schema[s] should be accessible for most white Americans most of the time’,Footnote 45 and they provide a ready-made way of thinking about other inter-group dynamics. This assertion about the centrality of black–white thinking among native-born Americans has some empirical grounding as well: Schildkraut reports a strong correlation between measures of racial resentment and measures of immigrant resentment.Footnote 46
At the same time, the stereotype-based perspective also gives rise to the theoretical claim that when confronted with an atypical out-group member, people will not see that individual as a representative of the overall group, and so will not shift their views about the group as the result of the encounter.Footnote 47 This approach explains the stability of stereotypes, since opinions of group members who might challenge a stereotype are unlikely to be integrated with views about the group as a whole. Here, variation in cultural traits will influence perceptions of the individual's typicality rather than influencing perceptions of the group or related policies.Footnote 48
Still another theory derived from the stereotype-based approach encourages us to understand the stereotypes specific to a given group. As Fiske et al. write, ‘social psychologists have typically viewed only unflattering steretoypes as indicating prejudice, where prejudice is a uniform antipathy or contempt toward an out-group across a variety of dimensions’.Footnote 49 Building on that critique, Fiske et al. show that different social groups evoke stereotypes with different content.Footnote 50 Some out-groups are viewed as competent but not warm, making them likely to be deemed competitors; others are viewed as warm but not competent, making them likely to be deemed inferiors. In this view, negative stereotypes are not equal in their effects, meaning that scholars must take their content and situational relevance seriously.
The Interchangeable Out-group Hypothesis
These broad theoretical perspectives enable us to develop specific hypotheses about the potential impacts of skin tone and language use, two salient sources of immigrant–native distinction. The perspective emphasizing undifferentiated ethnocentrism leads to what we term the interchangeable immigrant out-group hypothesis: the claim that identifiable immigrant–native distinctions will induce group-based thinking and anti-immigrant hostility, regardless of their content. Prior research provides some evidence for this hypothesis, as prejudice and ethnocentrism have been shown to correlate robustly with immigration attitudes, in the United StatesFootnote 51 and outside it.Footnote 52 Differences in skin tone are one indicator of cultural difference, and so should induce restrictionist attitudes.Footnote 53
Still, skin tone is not the only form of immigrant–native distinction, and in the American case, it might not be the most salient.Footnote 54 There is a growing body of evidence showing that at least some respondents are hostile to brief uses of Spanish.Footnote 55 But why does Spanish produce hostility, and under what conditions might it (or other foreign languages) do so? Here, too, approaches grounded in ethnocentrism provide an answer. Spanish is a clear and explicit sign of out-group status, and so should provoke group-oriented thinking. As Gluszek and Dovidio remark, ‘four decades of research have shown that those who speak nonnatively accented language in general are perceived more negatively than are speakers with native accents’.Footnote 56 In fact, Kinzler et al. find that among American children, preferences for native accents are stronger than preferences based on racial groups.Footnote 57 If this mechanism is at work, the use of a foreign language or a non-native accent is a salient indicator of out-group status, providing sufficient reason to classify an immigrant as an outsider and view her more negatively.Footnote 58
The Skin-Tone Primacy Hypothesis
Under the hypothesis of inter-changeable out-groups, skin tone is influential because it is a marker of out-group status. But building on theories of stereotyping, one might also hypothesize that skin tone is an especially influential type of inter-group distinction. As Iyengar et al. note, skin tone is a visible and explicit cue that is correlated with racial categories but that can vary independently of them.Footnote 59 As compared to other sources of inter-group distinction, it is almost entirely immutable. Skin tone differences have the potential to evoke racial differences between non-Hispanic blacks and whites, which are themselves chronically accessible for many Americans.Footnote 60 Perhaps for that reason, among Americans, skin tone influences a wide range of attitudes, from views of political candidates to the appropriate sentences for criminals.Footnote 61 Such complexion-based biases are thought to be outside the control of individuals, although those biases do decline over the course of a political campaign.Footnote 62 Skin tone is also clearly visible,Footnote 63 making skin tone biases especially pronounced upon an initial encounter, before alternative sources of judgment are processed. Hence the skin tone primacy hypothesis that on account of their visibility and cognitive accessibility, darker skin tones will induce more support for restrictionist approaches to immigration policy.
The Upside of Accent Hypothesis
Other theories of stereotypes emphasize their content, making it necessary to identify the content of specific anti-immigrant stereotypes. In the case of attitudes toward blacks, past research illustrates that non-black respondents are not reflexively hostile to African Americans or policies to assist them.Footnote 64 Instead, non-black Americans respond negatively to the extent that African Americans are perceived to violate traditional norms surrounding hard work.Footnote 65 Extending this norm-based theorizing to the domain of immigration, Schildkraut notes that ‘[i]mmigrant resentment is similar to the modern resentment many whites have toward blacks … but differs in important respects that involve the nature of the norm being violated’.Footnote 66 As in past periods of immigration, contemporary immigrants are perceived to violate norms surrounding assimilation and integration.Footnote 67 Chavez summarizes this view by noting: ‘[a]ccording to the assumptions and taken-for-granted “truths” inherent in this narrative, Latinos are unwilling or incapable of integrating, of becoming part of the national community’.Footnote 68 Within this criticism, language is a central symbol of assimilation.Footnote 69 Indeed, while Americans do not always agree that one must live in the United States or be Christian to be American, the agreement that one must speak English is nearly universal.Footnote 70
Language also has an important feature that distinguishes it from skin tone: modes of speaking are sometimes thought to reflect the speaker's active choices, as listeners over-estimate the malleability of accents or the ease of learning new languages.Footnote 71 Immigrants are assumed to have some control over how they speak, an assumption which might make Americans more willing to judge immigrants based on their use of language.Footnote 72 If perceptions about norms of assimilation influence Americans’ attitudes, a pronounced non-native accent might generate positive responses by signaling an effort to assimilate. Positive responses to non-native accents are not unheard of. Gluszek and Dovidio report that within the United States, some British accents are viewed positively.Footnote 73
Additional evidence for this upside of accents hypothesis comes from the January 2010 Columbus, Ohio focus groups reported by Jones and Cox.Footnote 74 For example, in response to an opening question about participants’ associations with immigration, one woman suggested the example of her grandparents. They ‘emigrated here from Poland, but they did it the right way. They learned the language, they earned their way’. Another participant made the same connection between language and a desire to assimilate, saying that her father ‘learned how to speak English and he followed [many] American traditions because he wanted his family to be Americanized’. Both comments suggest that making an effort to learn English is connected with earning a place in American society. According to this hypothesis, Americans are not reflexively hostile to cues of immigrant background, or to signals of out-group status more generally. Instead, they respond based on the content of those cues.
The Communication and Job Threat Hypotheses
Alternatively, language might prove influential not because it signals out-group membership but because of Americans’ concerns about their inability to communicate with their new neighbors.Footnote 75 Huntington summarizes this view, stating: ‘without a common language, communication becomes difficult if not impossible, and the nation becomes the arena for two or more language communities whose members communicate far more intensely with members of their group than with those of the other group’.Footnote 76 Here, the mechanism is not simply that foreign languages signal out-group membership, but that they actively inhibit communication. If Americans are averse to foreign languages because of concerns about an inability to communicate with their neighbors, they should not be concerned about the use of accented English so long as the speaker is intelligible. Fluent Spanish will be penalized while fluent English will not. The content of communication matters, not the form.
Building on research emphasizing the role of individual-level material interests in immigration,Footnote 77 a final hypothesis cuts against many of those above. If immigrants speak fluent English, it is plausible that they might be perceived as more of a labor market threat, especially to well-educated Americans. Here, too, hostility toward immigrants is target-specific. We now turn to testing these possibilities.
Experimental Design
This section reports the design and results of an initial survey experiment testing the ethnocentrism-based hypothesis against the cue-specific alternative hypotheses. We developed a survey battery to be administered before and after viewing a 41-second news clip on immigration policy through the internet. The research made use of KN, a survey firm which maintains a nationally representative online panel of American respondents.Footnote 78 The survey took place August 6–23, 2010, and 2,063 respondents completed it.Footnote 79
Ninety-two percent of respondents watched one of the six experimentally manipulated videos, with the remaining respondents employed as a control group. The video was adapted from a May 2007 ABC News clip and was professionally edited to ensure its credibility. In it, the news anchor (Diane Sawyer) describes a Senate proposal to provide a pathway to naturalization for undocumented immigrants. The video then cuts to an immigrant advocating that policy, explaining: ‘I've worked hard, always paid my taxes. I'd really like the chance to be an American citizen’. This is a pro-assimilation message, and so might prime the assimilation-related norms outlined above. However, the clip balances that message by emphasizing questions of legality; the policy proposal involves a $5,000 fine and a background check before unauthorized immigrants can obtain legal status. One randomization determined whether the voice-over was fluent English with a subtle non-native accent (26 percent incidence), broken English with a pronounced non-native accent (26 percent), or fluent Spanish (40 percent). To reduce any spurious cues contained in the speakers’ voices, the ‘broken English’ and ‘fluent Spanish’ conditions were recorded by the same male, Mexican voice actor. The ‘fluent English’ condition was recorded by a separate male voice actor of Spanish-speaking descent who immigrated to the United States as a child. In all treatments, respondents saw English-language subtitles on the screen, so the visuals convey the same content across all of the voice-over manipulations. As Rothbart and John note, people are most likely to allow views of individual group members to influence their views of the larger social category when the individuals are exemplary of the group.Footnote 80 The immigrant is thus shown via a blurred, still photograph, a common practice when presenting unauthorized immigrants, and is dressed informally, wearing an open, collared shirt. Although the pictures were identical, the immigrant's skin tone varied substantially via a second randomization, as shown in Figure 1.Footnote 81
Dark and light images of the featured immigrant in the August 2010 experiment

After the video, respondents were asked several questions related to immigrants and immigration policy. Given prior questions about whether respondents watch such web-based videos,Footnote 82 the survey concluded by asking randomly selected respondents two questions that serve as manipulation checks. As explained in detail in the Appendix, one was an open-ended question asking respondents about the immigrant's likely country of origin, while the second asked respondents to guess how long the featured immigrant had been in the United States. To the first question, Mexico was the single most common response (49 percent). But respondents exposed to the dark skin tone were more likely to name a Central American country (where indigenous populations are larger),Footnote 83 showing that the respondents did shift their perceptions based on the skin-tone manipulation. Also, the fluent English speaker was perceived to have been in the country for longer than either the Spanish speaker or the broken English speaker.Footnote 84 There was no notable difference between perceptions of how long the Spanish speaker and the broken English speaker had been in the United States. The manipulation checks establish that the August 2010 respondents perceived the manipulations in sensible ways.
Results
The experimental manipulations shifted respondents’ perceptions about the immigrant himself. We know, too, from prior experiments on racial attitudes that primes about specific individuals can influence Americans’ views about groups and related public policies.Footnote 85 Can the attributes of a single immigrant reframe that issue as well, and so influence immigration attitudes more generally? By presenting the experimental impacts on the core dependent variable, this section provides a preliminary answer.
Immediately after viewing the video, respondents were asked whether they approved or disapproved of the policy it proposed. Specifically, the question asked, ‘Do you support or oppose a national policy of allowing illegal immigrants already living in the United States for a number of years to stay in this country permanently and earn US citizenship’? Support is measured from strong opposition to strong support. For all analyses, we set aside respondents who report being Hispanic, under the assumption that their ethnic background might lead immigration-related cues to operate differently. This reduces the dataset by 10 percent, to 1,854.Footnote 86 Here, we use a linear model which includes indicators for treatment statusFootnote 87 as well as measures of partisanship, ideology, race, gender, and education assessed in prior surveys.Footnote 88 The inclusion of covariates can improve statistical precision,Footnote 89 but as expected, their inclusion has no substantive impact on the results. We also confirmed the central findings’ statistical significance using ANOVA.
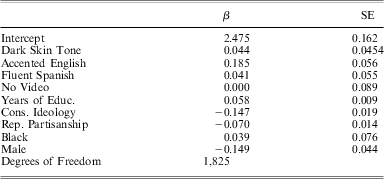
Table 1 presents the estimated treatment effects, with respondents who saw a light-skinned immigrant speaking fluent English as the benchmark. The dependent variable ranges from 1 ‘strongly oppose’ to 4 ‘strongly support’, with a mean of 2.39 and a standard deviation of 1.01. As the table illustrates, the two skin-tone manipulations are statistically indistinguishable, and differ by only 0.04 (4 percent of the dependent variable's standard deviation) on average. If anything, those who saw the darker immigrant are more supportive of a pathway to naturalization, but the difference is far from significant, with a two-sided p-value of 0.53. The skin tone cue shifts perceptions of where an immigrant is from, but it does nothing to influence attitudes about immigration-related policy. A total of 1,701 respondents in this analysis saw one of the two images, so the lack of statistical significance is not simply imprecision.Footnote 90 This undermines the hypothesis of immigrant out-group interchangeability, which holds that any meaningful out-group cue will induce negative attitudes. It also challenges the hypothesis of skin-tone primacy, which holds that visible, race-related primes such as skin tone are especially likely to do so.
OLS Regression of Support for a Pathway to Naturalization on Indicators of Treatment Group Status and Other Independent Variables

Note: Dependent variable: support for a pathway to naturalization, measured from 1 (‘strongly oppose’) to 4 (‘strongly support’). The baseline respondent heard fluent English and saw a light-skinned immigrant.
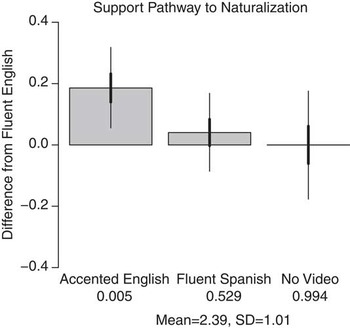
Figure 2 uses the same model to illustrate the impacts of the language-related manipulations. Positive gray bars indicate increased support for a pathway to naturalization, while negative gray bars indicate the reverse. The thick vertical lines indicate treatment effects within one standard error of the mean, while the thin vertical lines indicate the 95 percent confidence intervals. As a benchmark, under each treatment is the corresponding two-sided p-value indicating whether the treatment group is different from the baseline group. The baseline group remains those who saw a light-skinned immigrant speaking fluent English with only a very slight accent, although as the figure's right-most bar illustrates, this group proves essentially indistinguishable from the 8 percent of respondents who saw no video at all.
August 2010 Experiment: Language and immigration attitudes Note: The gray bars indicate the change in respondents’ support for a pathway to naturalization compared with that of respondents who saw a light-skinned immigrant speaking fluent English. Thick vertical lines indicate one standard deviation above or below the mean, while thin vertical lines indicate the 95 percent confidence interval. The p-values under each treatment reflect the two-sided test that this treatment group differs from those in the control group.

If immigrants generate more opposition as they become more distinctive, we should expect the effect of accented English to be negative, and the effect of the fluent Spanish to be more so. But that is not what we see in Figure 2. Instead, respondents who heard accented English are markedly more supportive of a pathway to naturalization than those who heard fluent English (p = 0.005). Holding skin tone constant, the mean difference between the accented English treatment and the fluent English condition is 0.19, with a 95 percent confidence interval from 0.06 to 0.32. Given that the dependent variable's standard deviation is 1.01, these results are substantively as well as statistically significant: this effect is 32 percent of the marked 0.58 gap between Democratic identifiers and leaners and their Republican counterparts. Partisanship is one of the most powerful predictors of political attitudes generally,Footnote 91 and that holds true for immigration attitudes as well,Footnote 92 so an effect of this size is striking. Accents appear to have an upside, even when compared to fluent English.Footnote 93
By contrast, the communication hypothesis finds little support from these data, as there is no discernible difference between being exposed to fluent English and Spanish, as the middle bar in Figure 2 shows. Not being able to understand the immigrant did not in itself increase restrictionist attitudes. Those who saw no video are indistinguishable from those who heard fluent English as well. This pattern of results limits the concern that the video was an especially pro-immigration prime, since the attitudes of those who saw multiple variants of the video were nearly identical to those who saw no video at all. It is important to add that we find no evidence that the treatment effects interact – that is, those who heard Spanish and saw the darker skin tone were not especially opposed to a pathway to naturalization.
In short, those exposed to an immigrant speaking accented English are markedly more supportive of creating a pathway to naturalization than those exposed to fluent English or Spanish – or those who saw no video at all. The coming sections aim to understand and confirm this finding. They pay particular attention to the possibility that the anomalous finding is really that for the fluent English speaker, whether because of heightened job threat, perceptions about the speaker, or for other reasons. Perhaps the accented English signals an effort to assimilate in a way that even an immigrant using fluent, effortless English does not.
Additional Tests
The fact that hearing English with an accent generates more pro-immigration attitudes than hearing the same voice speaking Spanish is in line with multiple hypotheses. But it is less clear why the thick, non-native accent generates more pro-immigration attitudes than does hearing fluent English. If Americans were more negative toward explicit signals of foreign birth, the opposite would be the case. The norm-based explanation can make sense of this anomaly, as the thick accent might be perceived as a signal of effort. But there are rival explanations that have not been effectively dismissed. It is plausible that the fluent English speaker poses a more concrete job threat. Perhaps events specific to August 2010 influenced how respondents interpreted the treatments. Alternately, respondents might have thought the fluent English speaker was actually an interpreter, or else perceived him to be atypical due to his fluency.Footnote 94
This section probes these alternatives in three ways, including analyses of additional dependent variables, a follow-up experiment using Amazon's Mechanical Turk, and a second KN experiment. Together, it provides various pieces of evidence which bolster the ‘upside of accents’ hypothesis. For instance, in the original KN experiment, it is on questions related to immigration's social and cultural impacts that a thick accent is most rewarded. The Mechanical Turk results provide added insight into how the thick accent increases perceptions that the immigrant is making an effort to speak English. And the results of the second KN experiment illustrate that the pattern reappears several months later on a second population-based sample, even when the immigrant's country of origin and length of residence are stated explicitly.
Analyzing Other Attitudes
We begin by analyzing the first experiment's impacts on other survey questions which assessed various immigration-related attitudes. We consider the effects on five new attitudes:Footnote 95 agreement that immigrants strengthen American society, agreement that they enhance social trust, perceptions of job threat, perceptions of generic threat, and support for legal immigration. For each, the Appendix details the question wording.Footnote 96 Our primary focus is on the difference between clear English and broken English, although the figures present results comparing all treatments to the fluent English, light-skinned baseline condition. If the norm-based explanation holds, we should expect that broken English will show the same positive impact on assessments that immigrants strengthen American society, as that question is closely related to perceptions about their cultural and social impacts. By contrast, if the effect above stems from concerns that a fluent English speaker might be a labor market competitor, we should see pronounced impacts on the questions about job threat and perhaps legal immigration.Footnote 97
When considering several dependent variables simultaneously, we should also be aware of the problem of multiple comparisons. As the number of dependent variables increases, the probability of finding a statistically significant effect increases as well, irrespective of the underlying reality.Footnote 98 Following the free step-down resampling method,Footnote 99 this analysis presents both standard, two-sided p-values and two-sided p-values corrected for the six hypothesis tests that the impact of accented English is different from that of clear English. This specific adjustment enables researchers to account for the observed dependence between the dependent variables. As the outcomes in question become more highly correlated, adjustments that assume independence grow increasingly conservative.
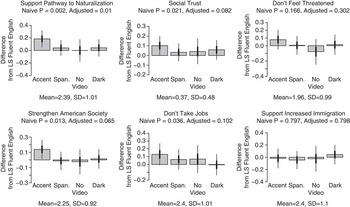
For example, the bottom left panel of Figure 3 shows opinions on whether today's immigrants strengthen American society. (As a point of comparison, the top left panel again illustrates the treatment effects on support for a pathway to naturalization.) The effects are compared to the control group that saw no video. For this four-category dependent variable, we estimate a linear model that takes into account the treatment indicators as well as respondents’ education, party identification, ideology, race, and gender. The full results from linear or logistic regression models are presented in Tables 2 and 3 in the Appendix.Footnote 100 The observed p-value from a naïve, two-sided test of the difference between the coefficient for broken English and that for fluent English is 0.013. Given the six dependent variables and their empirical correlations, the adjusted, two-sided p-value for the same hypothesis is 0.065.Footnote 101 Here, the scale varies from 1 (‘strongly disagree’ that today's immigrants strengthen American society) to 4 (‘strongly agree’), with a standard deviation of 0.92. Respondents who were exposed to the broken English were on average 0.14 more likely to say that immigrants strengthen American society than their counterparts who heard fluent English.Footnote 102 The finding is very similar to that above: accented English induces more pro-immigration and pro-immigrant attitudes. And as the central panel on the top row of Figure 3 indicates, accented English induces higher levels of social trust than does fluent English, an observation in keeping with the norms-based explanation. Indicators of out-group status are not always negative.
August 2010: Treatment effects on various immigration attitudes Note: The gray bars depict the mean attitudinal change for each experimental group as compared to the group exposed to a light-skinned immigrant speaking fluent English. The p-values at top are naïve and adjusted two-sided comparisons of the fluent English and accented English conditions. Tables 2 and 3 in the Appendix show the full fitted linear or logistic regression models.

Turning our attention to job threat in the bottom middle panel, we see an adjusted, two-sided p-value of 0.10. This dependent variable is also a scale with four values, where 1 indicates that immigrants taking jobs is ‘not at all likely’ while 4 indicates that it is ‘extremely likely’. Its standard deviation is 1.01. When respondents hear broken English, they are 0.12 less likely to believe that immigrants take jobs from people who are already here.Footnote 103 On its own, this could be evidence for a threat-based interpretation of the fluent English finding. There is, however, no discernible impact on support for increased legal immigration. Presumably, job threats from legal migrants are more pronounced for most native-born Americans. Even in the control condition, job threat and support for a pathway to naturalization are correlated at 0.49 (polychoric).
This conclusion about the absence of job threat is reinforced by sub-group analyses in which we consider groups defined by labor force participation. Specifically, we re-estimate the effect of the experimental treatments on support for a pathway to naturalization separately for respondents in and outside the labor force. There are no significant differences in the treatment effect for accented English. If anything, the treatment effect is larger for those outside the labor force by 0.184, with an admittedly wide 95 percent confidence interval from −0.07 to +0.44. Put differently, the experimental effect on the four-category measure of support for a pathway to naturalization appears larger for those outside the labor force, although not at conventional levels of significance.Footnote 104 This evidence undercuts the claim that respondents react to the fluent English by growing worried about their employment prospects. Given these findings, and given Americans’ strong preference for well-educated immigrants,Footnote 105 job threat is unlikely to explain the relative preference for a more accented English speaker.
Three other aspects of these results are noteworthy as well. First, the initial finding with respect to supporting a pathway to naturalization remains strong and statistically significant, even after adjusting for multiple comparisons (adjusted, two-sided p-value = 0.01). Second, none of the treatments influence attitudes toward legal immigration, suggesting that such attitudes might have distinctive antecedents. Our most consistent measure of immigration attitudes dating back to the 1990s is this question about legal immigration, and yet it might not accurately reflect debates or dynamics about unauthorized immigration. Third, Figure 3 makes it clear that the null results for skin tone hold across all six dependent variables.
Manipulation Checks Using Mechanical Turk
To further understand the unexpected pattern of results, we conducted a separate study using Amazon's Mechanical Turk to show one of three videos with different modes of immigrant speech to 460 subjects. While such subjects are not selected so as to allow for any generalizations to the population of Americans, they are more diverse than student samples,Footnote 106 and provide added insight about perceived differences between the accented and fluent English conditions.
After viewing one of the three videos by random assignment, subjects then indicated how well a number of statements described the immigrant they saw and heard using a four-point scale that varied from ‘very well’ to ‘not at all’. The treatment with a pronounced non-native accent was perceived appropriately, with subjects giving that immigrant a score of 3.55 when assessing whether ‘[h]e speaks English with a foreign accent’. This figure is significantly higher than the 2.16 given in the less accented (or ‘fluent English’) condition (p < 0.001). Subjects were also less likely to agree that the immigrant in the thickly accented English condition was well educated (2.40 vs. 2.93, p < 0.001), an observation which heightens our puzzlement given that Americans strongly prefer well-educated immigrants.Footnote 107 At the same time, other perceived differences reinforce the interpretation proposed above. Those subjects who heard the thickly accented English were more likely to say that ‘English does not come easily for him’ (1.91 vs. 1.34, p < 0.001), that the immigrant was ‘making an effort to speak English’ (3.67 vs. 3.30, p < 0.001), and that he was ‘typical of immigrants coming to the US today’ (2.70 vs. 2.20, p < 0.001). Such results reinforce two potential and complementary explanations, both in keeping with the emphasis of Rothbart and John (Reference Rothbart and John1985) and Brown (Reference Brown2000) on the fit between a given stereotype and a specific situation. One explanation is that accented English is seen as a signal of effort to assimilate. The second is that the subtlety of the accent in the fluent English case renders that immigrant atypical, and means that attitudes about him do not influence attitudes about the broader category of immigrants.
January 2011 Experiment
To rule out the claim that August 2010 was an unusual political context and to understand respondents’ perceptions of the treatments better, we conducted a second experiment designed to test the robustness of the core finding. As with the original experiment, this follow-up survey was conducted through KN, meaning that the sample is drawn to be representative. The sample size was 1,137.Footnote 108 The initial experiment's results provided directional hypotheses, so the p-values reported for this analysis are one-sided.
Aside from its smaller sample size, the second experiment made a few modifications to the design and experiment above. The use of an accent could influence attitudes because it signals a willingness to assimilate, but also because it signals the speaker's region of origin and time in the United States. A fluent English speaker who is nonetheless an undocumented or illegal immigrant might be atypical, and could even evoke negative responses given that he has not naturalized despite many years of residence. To reduce this heterogeneity, the updated video introduced the immigrant by adding that ‘[h]e came here ten years ago from Mexico’. Also, to ensure that responses were not specific to the image of the immigrant used in the first experiment, this experiment used a separate image of a Hispanic male shown in Appendix Figure 2. Here, there was no skin-tone treatment and no group that did not see the video: respondents were assigned with equal probability to hear an immigrant speaking fluent Spanish, thickly accented English, or fluent English.
One concern about the initial experiment is that respondents might have perceived the fluent English speaker to be an interpreter. To address this possibility, the second experiment inquired about the strength of the speaker's accent after assessing immigration attitudes. The manipulation worked as intended. An overwhelming 97.8 percent of those who heard the thick accent thought the speaker had an accent of some sort, while 63.6 percent of those hearing ‘fluent English’ reported hearing an accent. There was a slight increase in the percentage who were not sure if they heard an accent, from 7.8 percent in the ‘accented English’ condition to 11.8 percent in the ‘fluent English’ condition.Footnote 109 Thus a significant majority of respondents perceived the fluent English speaker as intended. They saw him as an immigrant with a slight but discernible accent – and not as someone using an interpreter.
The sample size here is only half that in the prior experiment, so we have to be careful to focus on the observations where the treatment effect is likely to be operating. We developed filters to remove inattentive respondents by analyzing the first KN experiment and then applying them to the second.Footnote 110 After applying the filters, 827 non-Hispanic respondents remain.Footnote 111
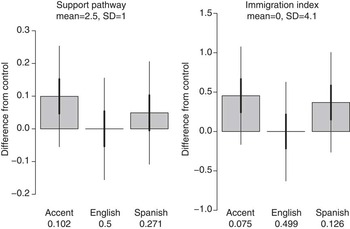
Having defined the population and considered how respondents perceived the manipulation, we then estimated the same model of immigration policy attitudes as those employed above, with the results shown on the left side of Figure 4. The underlying regression model is available in Appendix Table 4. The baseline respondent heard the fluent English voice-over. The figure confirms the counter-intuitive trend from above: Americans who heard accented English are the most supportive of a pathway to naturalization, and they are more supportive than those who hear fluent English (p = 0.10). Here again, we employ a four-point scale, where 4 indicates strong support for a pathway to naturalization. Compared to fluent English, the average impact of accented English is approximately half the size of that detected above. Here, it is 0.09, with a 95 percent confidence interval from −0.05 to +0.25. Still, the striking pattern reappears in this survey experiment with different respondents administered six months later. Those respondents exposed to accented English are most supportive of creating a pathway to naturalization.
January 2011. Dependent variables – support pathway to naturalization, index of immigration attitudes Note: This figure reports the mean treatment effect for each sub-group as compared to respondents exposed to fluent English. The index of immigration attitudes includes perceptions of immigrants’ interest in assimilation. The numbers under each treatment correspond to one-sided p-values indicating the extent to which the treatment differs from hearing fluent English.

We then investigated whether the treatment influenced a composite index of immigration-related attitudes.Footnote 112 The use of a single index is a standard survey-analytic approach that enables us to reduce measurement error and avoid multiple comparisons. In all, the index includes standardized responses to six questions, including the measures of generic threat, job threat, support for a pathway to naturalization, and immigration's societal impacts that were employed in the first survey. In addition, the index includes two new questions about immigrants’ cultural integration taken from Schildkraut (Reference Schildkraut2011).Footnote 113 By design, the index emphasizes the perceptions of immigrant integration and assimilation that are the focus of norms-based explanations. It is coherent, with a Cronbach's alpha of 0.78.
The results, illustrated on the right side of Figure 4, provide still more evidence that pronounced accents can be a positive influence on immigration attitudes. Here, the average impact of hearing broken English as compared to fluent English is 0.45, which is 11 percent of the index's standard deviation. The 95 percent confidence interval spans from −0.16 to +1.07 (p = 0.075). It is not just that those who hear broken English are more supportive of a pathway to naturalization. They also score higher on an index tracking several immigrant-related attitudes, an index which emphasizes perceptions of immigrants’ willingness to assimilate and to contribute to the broader community.
Given the elements of the index, the norms-based explanation grows more convincing. We should also acknowledge the potential role of typicality: the immigrant in the fluent English treatment is perceived as less typical of immigrants, a fact which might reduce his ability to shape attitudes toward immigrants generally. Irrespective of the relative influence of these two pathways, we can decisively reject the claim, grounded in theories of ethnocentrism, that simply hearing a foreign language necessarily induces negative attitudes. Even with explicit information about the immigrant's country of origin and timing of arrival, respondents nonetheless draw conclusions about these factors from hearing an immigrant speak. It is not simply that speaking a foreign language is penalized, or that speaking fluent English is rewarded. Instead, hearing accented English prompts more support for creating a pathway to naturalization and reduces concerns about immigrant integration.
Conclusion
For scholars of politics outside the United States, the claim that language is an important source of political identity and political division is not controversial.Footnote 114 But in the United States, the prominence of black–white differences as a political cleavage has led scholars to devote less attention to inter-group distinctions that are not closely connected to those between non-Hispanic whites and blacks. This article's results make clear the disadvantage of an exclusive focus on black–white differences: the cues that influence whites’ attitudes toward blacks and those that influence attitudes toward immigrants are not always the same. Past research has shown that skin-tone differences can have a profound influence on many race-related attitudes. But such effects do not appear with respect to immigration. As the first experiment demonstrates, when an immigrant's skin tone varies markedly, attitudes toward immigration-related policies do not. In a context where respondents are likely to ascribe Hispanic ethnicity to an immigrant in any event, skin-tone variation has little influence.
Writing in 1982, Cairns observed that ‘social scientists have so embedded the ethnocentrism syndrome with its attendant emphasis upon out-group hostility that they have often failed to recognize its absence as a genuine phenomenon’.Footnote 115 Here, too, the absence of ethnocentrism is theoretically meaningful. The null skin-tone finding inveighs against the skin-tone primacy hypothesis and against claims that visible inter-group distinctions necessarily engender negative attitudes. That conclusion is reinforced by the language-related findings, which show that hearing fluent Spanish does not induce more anti-immigration views. The respondents in the two survey experiments reported here are not averse to inter-group differences. In fact, one such difference – the use of a pronounced accent – led to more pro-immigration attitudes. That was true in both the August 2010 experiment and in the January 2011 follow-up, making it difficult to dismiss as idiosyncratic. Accented English shapes support for a pathway to naturalization, and influences scores on an index measuring assimilation-related attitudes as well.
But why might broken English lead to more pro-immigration attitudes among American respondents while fluent English does not? The results outlined here lend support to explanations emphasizing the fit between a stereotype and a specific situation.Footnote 116 They suggest that on immigration, norms about assimilation and perceptions of typicality are likely to be influential. Intriguingly, recent research does not detect a similar effect of attempting to speak English when Americans evaluate hypothetical, written applications from legal immigrants,Footnote 117 indicating that these results might well be specific to unauthorized immigration, and to associated stereotypes about Latino immigrants’ unwillingness to assimilate.Footnote 118 The pattern of results uncovered here might also be more likely in a video presentation, as audio or visual cues can be processed automatically. Chavez describes a popular discourse in which Latinos are too often depicted as ‘unable, or unwilling, to learn English and generally integrate into American society’.Footnote 119 Here, we find that an unauthorized Latino immigrant who speaks English with an accent can challenge this stereotype, and thus induce more pro-immigration views from many non-Hispanic Americans. Follow-up studies could productively consider whether the same mechanism operates for other immigrant groups that are subject to similar stereotypes, both within and outside the United States.
This finding in turn suggests a way in which whites’ attitudes toward blacks are parallel to their attitudes on immigration: in both cases, perceptions about effort and deservedness influence Americans’ policy preferences. Future research might consider the other ways that immigrants signal a willingness to assimilate, either individually or collectively. To provide a baseline, the experiments reported here employed a potentially pro-assimilation cue, with the featured immigrant saying that he has ‘worked hard, always paid my taxes’ after the proposed fines and background check have been described. Additional experiments could productively vary the content of that message. They might also continue to probe the psychological mechanisms underpinning the finding by examining the specific perceptions about immigrants that are shaped by accented speech. And future work might manipulate other aspects of the immigrant presented, from gender to country of origin.
One common thread linking the work-related norms that influence white Americans’ attitudes toward blacks and the assimilation-related norms that seem to be shaping their immigration attitudes is the perception of control. It is easier to judge other people based on stigmas, behaviors, or other distinctions that they are thought to be able to influence.Footnote 120 Language is often perceived as a choice, a perception which distinguishes it from skin tone. Future research could measure such perceptions of control, and in doing so, it could develop our understanding of the politically relevant sources of native–immigrant distinction. From this study, attitudes toward immigration appear to parallel black–white attitudes more in the types of cues that influence them than in the specific cues at work.