With the progress of urbanization, large quantities of abandoned engineering muck (EM) are generated during the excavation of development projects such as building construction and underground projects. It is estimated that by 2030 EM from subway excavation in China will exceed 20 billion m3 (Zhang et al., Reference Zhang, Duan, Sun, Li, Zuo and Mao2020c; Lei et al., Reference Lei, Yang and Chen2024). However, large amounts of EM have been arbitrarily stored or dumped in the past, causing environmental problems and serious safety accidents such as landslides and mudslides in landfill sites (Chen et al., Reference Chen, Jiang, Xing and Hou2021). One such landslide in Guangming New District, Shenzhen City, China, resulted in 73 deaths and direct economic losses of over 120 million US dollars (Yin et al., Reference Yin, Li, Wang, Zhan, Xue and Gao2016). At present, EM is mainly used for site levelling, roadbed filling, land reclamation, mountain landscaping and as a resource for the preparation of sintered bricks, ceramics and recycled aggregates (Riviera et al., Reference Riviera, Bellopede, Marini and Bassani2014; Su et al., Reference Su, Yu, Chen, Li, Liu, Zhang and Liu2023). However, only 25% of EM is used for such purposes (Ferdous et al., Reference Ferdous, Manalo, Siddique, Mendis, Zhuge and Wong2021; Gao et al., Reference Gao, Zhang, Ren, Zhong and Jiang2023), making the pursuit of efficient EM utilization an urgent environmental and engineering challenge.
Normally, EM is formed through the weathering of feldspar-rich rocks (e.g. granite), a process that involves the hydrolysis and leaching of feldspar and the subsequent formation of kaolinite. Other minerals, such as vermiculite, dioctahedral mica and dioctahedral smectite, are also formed during weathering (Cheng et al., Reference Cheng, Hong, Ji, Li and Wang2022; Dong et al., Reference Dong, Bao, Cui, Xu and Chen2023). The chemical components are mainly SiO2, Al2O3, CaO, Fe2O3 and MgO, while the mineral components are mainly clay minerals (mostly kaolinite, halloysite and dioctahedral mica), feldspar and quartz (Jiao et al., Reference Jiao, Ding, Wan, Gao and Xue2024; Yuan et al., Reference Yuan, Liang, Li, Zhang, Luo and Sabri2024). The composition of EM is closely related to the weathering degree of its igneous rocks (e.g. granite). Specifically, a greater degree of weathering leads to a greater content of clay minerals, especially kaolinite, and in some cases the kaolinite content can exceed 90% (Mei et al., Reference Mei, Jian, Zhang, Fu and Zhang2021; Lyu & Lu, Reference Lyu and Lu2024).
Clay minerals develop high geopolymerization reactivity upon calcination, a process that forms a reactive amorphous phase. Due to this property, calcined clay minerals are increasingly utilized in advanced construction materials (Mourak & Hajjaji, Reference Mourak and Hajjaji2024). Hence, sustainable utilization of EM may be achieved by focusing on the potential applications of its clay mineral components. A ‘geopolymer’ refers to an inorganic polymer with a three-dimensional network structure composed of cross-linked tetrahedra of [SiO4], [AlO4] or [PO4] units, depending on the activator used. They are typically synthesized by dissolving aluminosilicates in an acid or alkaline activator solution, followed by reorganization, polycondensation and hardening (Davidovits, Reference Davidovits1989). The geopolymerization process has lower energy consumption and CO2 emissions compared to ordinary Portland cement (OPC) production, making it an ideal OPC substitute for adhering to the global carbon-neutral strategy (Dong et al., Reference Dong, Bao, Cui, Xu and Chen2023). Generally, the activator solutions used for preparing geopolymers are either alkaline or acidic. The alkaline activator commonly used is a mixture of metal hydroxides (NaOH or KOH) and silicate solutions (Na2SiO3 or K2SiO3), while the commonly used acid activator is phosphoric acid (Liew et al., Reference Liew, Heah, Mohd Mustafa and Kamarudin2016). The other raw materials for geopolymer preparation are aluminosilicate precursors such as clay minerals (Tarantino et al., Reference Tarantino, Occhipinti, Maraschi, Zema, Riccardi, Profumo and Sturini2024), industrial waste (e.g. fly ash and slag, but their limited availability in many regions restricts their broader use; Yuksel, Reference Yuksel, Siddique and Cachim2018; Aldawsari & Kampmann, Reference Aldawsari and Kampmann2025) and other aluminosilicate-rich materials with sufficiently reactive alumina and silica (Sathonsaowaphak et al., Reference Sathonsaowaphak, Chindaprasirt and Pimraksa2009; García-Díaz et al., Reference García-Díaz, Delgado-Plana, Bueno-Rodríguez and Eliche-Quesada2024). Among them, clay minerals, which are naturally occurring and globally abundant, are some of the most important raw materials for geopolymer preparation (Khalifa et al., Reference Khalifa, Cizer, Pontikes, Heath, Patureau, Bernal and Marsh2020; Dihaji et al., Reference Dihaji, Azerkane, Bih, Essaddek and Haily2025).
As stated earlier, EM is rich in clay minerals, which highlights its potential as a geopolymer precursor. To date, several studies have investigated the potential of alkali-activated EM-based geopolymers for this purpose. Zhou et al. (Reference Zhou, Li, Liu, Zou, Peng and Lyu2023) employed alkali activators to prepare EM-based geopolymers. The results showed that the as-obtained geopolymer exhibited a high compressive strength of 50 MPa. Yuan et al. (Reference Yuan, Liang, Li, Zhang, Luo and Sabri2024) found that EM exhibited enhanced geopolymerization reactivity after calcination at 850°C. The obtained EM-based geopolymer achieved a 7 day compressive strength of 50 MPa and could potentially emit ∼11–65 kg CO2 t–1 less CO2 during production than OPC-based concrete. Therefore, alkali-activated EM geopolymerization is a feasible resource utilization method. However, it is worth mentioning that the excellent mechanical properties of EM-based geopolymers substantially depend on the high content of amorphous phases from the clay minerals (especially kaolinite). In fact, EM from some areas contains too little kaolinite, exhibiting low reactivity with alkaline solutions. Dassekpo et al. (Reference Dassekpo, Zha and Zhan2017) prepared an alkali-based EM-based geopolymer and found that its 7 day compressive strength was only 13.89 MPa. They attributed this low compressive strength to the low content of highly reactive clay minerals. Such compressive strength values only meet the mechanical requirements of certain applications and are obstacles to the widespread use of EM-based geopolymers.
In contrast, acid activation technology for geopolymer preparation was first proposed by Wagh & Jeong (Reference Wagh and Jeong2003). During the geopolymerization of clay minerals, the various reaction mechanisms can lead to the formation of geopolymers with better performance in the acid system than in the alkali system under specific conditions (Liu et al., Reference Liu, Zhao, Qiu, Meng, Wang and Zhou2023). Louati et al. (Reference Louati, Hajjaji, Baklouti and Samet2014, Reference Louati, Baklouti and Samet2016a,Reference Louati, Baklouti and Sametb) demonstrated that the content of amorphous phases and the microstructure of phosphoric acid-based geopolymers were optimized at an aluminium to phosphorus (Al/P) molar ratio of 1.0. Furthermore, a lower Al/P molar ratio reduced the content of dioctahedral mica in the geopolymer, while a higher kaolinite content led to a faster geopolymerization rate, a more compact microstructure and better performance of the phosphoric acid-based geopolymer. Previous studies have also indicated that acid-activated clay-based geopolymers have better properties (e.g. mechanical and fire resistance) than alkali-activated clay-based geopolymers (Perera et al., Reference Perera, Hanna, Davis, Blackford, Latella, Sasaki and Vance2008; Liu et al., Reference Liu, Cui, Qiu, Yu and Zhang2010, Reference Liu, Cui, He and Yu2011, Reference Liu, Cui, He, Liu and Gong2012). For example, Zhang et al. (Reference Zhang, Guo, Yuan, Deng, Zhong and Li2020a,Reference Zhang, Guo, Yuan, Deng, Zhong and Lib) found that, under the same curing conditions, halloysite experiences faster dissolution in an alkaline activator than in an acid activator, although the 7 day compressive strengths of alkali-activated and acid-activated halloysite-based geopolymers were similar at 58.7 and 65.0 MPa, respectively.
Understanding how the structure and reactivity of clay minerals influence their interactions with acid or alkali activators is foundational to utilizing clay mineral-rich resources such as EM for geopolymer preparation (Komadel, Reference Komadel2003; Abdullayev et al., Reference Abdullayev, Joshi, Wei, Zhao and Lvov2012). For example, acid etching of calcined kaolinite selectively removes alumina, generating mesopores within the acid-resistant silica framework to produce mesoporous silica; in contrast, alkali etching selectively dissolves the amorphous silica-enriched phase, producing mesopores in situ within the residual alumina-enriched framework (Shu et al., Reference Shu, Li, Zhou, Chen, Yu and Wang2014). In 1 mol dm–3 H2SO4, halloysite dissolution starts at the inner surface (aluminium oxide) of nanotubes, forming amorphous spheroidal SiO2 nanoparticles, whereas in 1 mol dm–3 NaOH, dissolution of the inner surface (silica) of nanotubes is accompanied by the formation of Al(OH)3 nanosheets (White et al., Reference White, Bavykin and Walsh2012). However, the degradation rate of kaolinite and halloysite in HCl solution is slightly lower than in H2SO4 (White et al., Reference White, Bavykin and Walsh2012; Shu et al., Reference Shu, Li, Zhou, Chen, Yu and Wang2014). Acid or alkali treatment (5–15% HCl/NaOH) does not significantly damage the crystal structure of dioctahedral mica but does increase its pore volume (Jozefaciuk et al., Reference Jozefaciuk, Slawinski and Vrzhashch2009; Lakevičs et al. Reference Lakevičs, Stepanova, Skuja, Dusenkova and Ruplis2014). Therefore, it can be deduced that 1:1-type clay minerals (e.g. kaolinite and halloysite) have different dissolution characteristics, and they are more susceptible to acid and alkali treatment than 2:1-type clay minerals (e.g. dioctahedral mica). The optimal activation method can be selected based on the mineral composition of the EM.
A direct comparison between acid and alkali activation of EM for geopolymer preparation has not been systematically conducted to date. The present work comparatively investigates the similarities and differences in the mechanical properties, composition, microstructure and geopolymerization mechanisms between acid and alkali-activated EM-based geopolymers. This work focuses mainly on the effects of water/binder mass ratios and Al/P or SiO2/Na2O molar ratios on acid/alkali-activated EM-based geopolymers through a combination of techniques such as X-ray diffraction (XRD) analysis, Fourier-transform infrared (FTIR) spectroscopy, scanning electron microscopy (SEM) coupled with Energy-dispersive X-ray spectroscopy (EDX) and mercury intrusion porosimetry (MIP). The findings provide a theoretical basis for the preparation of acid/alkali-activated EM-based geopolymers, highlighting a green approach to achieving the high-efficiency utilization of EM (especially those that are rich in clay minerals).
Experiment and methods
Materials
The EM used was obtained from Shenzhen (High School Park Project), Guangdong Province. The original EM is of varying sizes, mostly in the form of blocks (Fig. 1). To enhance the geopolymerization activity, the raw EM (300 g for each sample) was first crushed for 60 s using a commercial crush (Baihaojia, 800A) at a blade rotational speed of 35 000 rpm and then sieved through a 60 mesh sieve. The fine fraction passing through the sieve was collected and calcined in a muffle furnace at 700°C for 2 h with a heating rate of 10°C min–1, yielding the calcined product designated as EM700°C. According to the preliminary experimental results, the EM was calcined at a temperature of 700°C to obtain the best geopolymerization reactivity.
Experimental process of acid and alkaline EM-based geopolymer preparation.

Figure 1 Long description
The flowchart details the preparation of EM-based geopolymers. It begins with raw EM materials, which are crushed and sieved through a 60 mesh. The EM powder is then calcined to produce calcined EM powder. This is followed by mixing with acid or alkaline solutions. The acid activator uses phosphoric acid and ultrapure water, resulting in rough, porous and light-colored samples. The alkaline activator uses sodium silicate solution and NaOH pellets, resulting in smooth, few-pored and deep-colored samples. The process concludes with evaluation and comparison of mechanical properties, composition and microstructure using an ultrasonic testing machine, XRD, FTIR and SEM.
Phosphoric acid (85 mass%) was used as the acidic activator, and it was purchased from Guangdong Guangshi Reagent Technology Co., Ltd.
The alkaline activator used in this experiment was a mixed solution of NaOH and sodium silicate (Fig. 1). The NaOH pellets, with a purity of ≥96.0%, were purchased from Guangdong Guangshi Reagent Technology Co., Ltd. Sodium silicate was bought from Foshan Kening New Material Technology Co., Ltd, with a modulus of 3.31 (mass fractions of SiO2 and Na2O are 28.01% and 8.73%, respectively), a density of 1.387 g cm–3 (20°C) and a semi-transparent viscous liquid appearance.
Preparation of acid- and alkali-activated EM-based geopolymers
The effects of water/binder mass ratio and Al/P molar ratio on the properties of the phosphoric acid-activated EM-based geopolymer (PG) and the effects of water/binder mass ratio and SiO2/Na2O molar ratio on the properties of the alkali-activated EM-based geopolymer (AG) were investigated.
As shown from the mixture proportions listed in Table 1, EM700°C and the activator solution were put into a cement slurry mixer (NJ-160A, Wuxi Jianye Instrument, China) for ∼5 min to obtain a uniformly mixed geopolymer slurry. Then, the obtained slurry was poured into 2.0 × 2.0 × 2.0 cm3 silicone moulds that were vibrated for 1 min to remove the air bubbles from the slurry. All specimens were put into sealed bags for curing to prevent moisture evaporation, and then they were placed into a 70°C oven (for 7 days, acid activation) or kept under ambient conditions (25°C, alkali activation) for curing, followed by demoulding and curing at room temperature until the test day.
Mixture design of PG and AG.

Table 1 Long description
The table lists mixture recipes using a constant 100 g of EM700°C binder for two series: phosphoric-acid-activated mixes (PG) and alkaline-activated mixes (AG). For PG, each row gives phosphoric acid mass, added water mass, the resulting Al to P molar ratio, and the water to binder mass ratio. In the PG set with Al to P fixed at 1.0, phosphoric acid stays at 35.5 g while water increases from 24.5 g to 44.5 g as the water to binder ratio rises from 0.6 to 0.8. In the PG set with water to binder fixed at 0.7, phosphoric acid decreases from 50.6 g to 32.2 g while water increases from 19.4 g to 37.8 g as Al to P increases from 0.7 to 1.1. For AG, each row gives alkaline activator mass, the SiO2 to Na2O molar ratio, and the water to binder mass ratio. With SiO2 to Na2O fixed at 1.50, activator increases from 60 g to 80 g as the water to binder ratio rises from 0.6 to 0.8. With water to binder fixed at 0.6, activator stays at 60 g while SiO2 to Na2O varies from 1.25 to 2.00. Values reflect designed proportions and do not indicate performance outcomes.
Note: M in PG stands for the Al/P molar ratio, while W in AG stands for the molar ratio of SiO2/Na2O.
The acid-activated EM-based geopolymer was denoted as ‘water/binder mass ratio PG-molar ratio of Al/P’, and the alkali-activated EM-based geopolymer was denoted as ‘water/binder mass ratio AG-molar ratio of SiO2/Na2O’; for example, 0.7PG-0.7M represents that the geopolymer prepared from acid-activated EM700°C and their water/binder mass ratio, as well as Al/P molar ratios (M), were both 0.7; 0.6AG-1.50W represents the geopolymer prepared from alkali-activated EM700°C with a water/binder mass ratio and a SiO2/Na2O molar ratio (W) of 0.6 and 1.5, respectively.
The acidic activator used in this experiment was a diluted phosphoric acid solution (Table 1). Phosphoric acid was diluted by ultrapure water to obtain various Al/P molar ratios (M = Al/P molar ratios = 0.7, 0.8, 0.9, 1.0 and 1.1), as the optimal Al/P molar ratio of PG was reported previously to be 1.0 (Louati et al., Reference Louati, Hajjaji, Baklouti and Samet2014; Zribi et al., Reference Zribi, Samet and Baklouti2020).
The modulus of the alkaline activator (denoted as W; W = SiO2/Na2O molar ratios = 1.25, 1.50, 1.75 and 2.00), based on the results from previous studies (Liew et al., Reference Liew, Heah, Mohd Mustafa and Kamarudin2016; Yu et al., Reference Yu, Chen, Guo, Zhang, He and Zheng2023a; García-Díaz et al., Reference García-Díaz, Delgado-Plana, Bueno-Rodríguez and Eliche-Quesada2024), was adjusted by adding certain amounts of NaOH pellets and sodium silicate.
Characterization methods
The major oxide compositions in the EM were quantified by X-ray fluorescence spectroscopy (XRF) using a wavelength-dispersive sequential scanning spectrometer (Shimadzu XRF-1800), in accordance with the Chinese Standard GB/T 4734-2022 (2022). For the XRF analysis, the sample was prepared via the fusion method, involving mixing with a fluxing agent at a predetermined ratio and fusing it into a homogeneous glass bead. The loss on ignition (LOI) was measured by heating 1 g of the sample to 1150°C.
The compressive strength development of the geopolymer was obtained by using unconfined compression strength tests. In detail, an STS100K microcomputer-controlled electronic universal testing machine (Guangdong Lugong Precision Instrument Co., Ltd) was used to measure the compressive strength of the geopolymer, with a loading rate of 5 mm s–1. At least five replicate specimens were tested in each experimental group.
Measurement of the specific surface area of the EM and EM700°C was carried out by physisorption analysis using a Micromeritics instrument (Micromeritics Co., Norcross, GA, USA) at a liquid nitrogen temperature of –196°C. The EM and EM700°C powders were degassed at 120°C for 12 h before testing. The specific surface area of the sample was calculated using the multi-point Brunauer–Emmett–Teller (BET) method, with a relative pressure ranging from 0.05 to 0.35.
The thermogravimetry (TG) and derivative thermogravimetry (DTG) curves of the EM were determined using a TGA2 instrument (Mettler Toledo, Switzerland). The sample was heated in a corundum crucible from 30°C to 1000°C at a heating rate of 10°C min–1 under an N2 atmosphere (50 mL min–1).
XRD traces were collected using a Rigaku MiniFlex 600 (Japan) with Cu-Kα radiation (λ = 1.5406 Å) operated at 40 kV and 15 mA. The instrument was equipped with a Ni-Kβ filter, a divergence slit (DS), a scattering slit (SS), a receiving slit (RS) and Soller slits (5°). A D/teX Ultra2 one-dimensional silicon strip detector was used. The data were recorded in the range of 3–75°2θ at a scanning speed of 3°2θ min–1. The EM powder was further grounded and sieved (200 mesh) before testing. The samples were tested using the disorientated powder method; specifically, the testing samples was prepared by putting the random powders into the holders and smoothing them gently to prevent the powder from splashing. The semi-quantitative analysis of the raw EM was conducted using whole powder pattern fitting (WPPF) and the Rietveld refinement method within Jade 9 software.
The cay minerals were identified by examining the XRD traces of the clay-fraction isolates subjected to three treatments according to SY/T 5163-2018 (2018): air-dried orientated mounts (denoted as EM-N), mounts saturated with ethylene glycol (EG) at 60°C for more than 8 h (denoted as EM-E) and mounts saturated with EG followed by heating to 500°C for 2 h (denoted as EM-T). EG treatment facilitated the recognition of expandable clays such as smectite. Detailed identification of clay minerals was based on SY/T 5163-2018 (2018).
A Bruker Vertex 70V spectrometer (Karlsruhe, Germany) was used to record the FTIR spectra of the EM, EM700°C and geopolymer in the range of 4000–400 cm–1. Approximately 0.8 mg of sample powder and 80 mg KBr were ground together and pressed into a thin and transparent disc. Each sample was tested at a resolution of 4 cm–1 over 64 scans.
Microstructural observations were conducted using an SU8010 field-emission SEM device (Hitachi, Japan) operated under a vacuum level of ∼2 × 10⁻³ Pa. The instrument was equipped with secondary electron (SE) and backscattered electron (BSE) detectors for imaging, as well as an Octane Super EDX detector (active area: 60 mm2) for elemental analysis. Samples were prepared by mounting small fragments on conductive adhesive tape, followed by platinum (Pt) coating. The accelerating voltages were set at 3 kV for SEM imaging and 15 kV for EDX analysis.
An Autopore IV 9500 device (Micromeritics, USA) at a contact angle of 130° and a pressure of mercury ranging from 0.10 to 61 000 psia (pounds per square inch absolute) was used to determine the total porosities and the pore-size distributions of the PG and AG.
Results and discussion
Characterization of the raw materials
The composition of the EM was analysed using XRF (Table 2). The results showed that the EM mainly contains SiO2 and Al2O3, accounting for 86.33 wt.% of the total composition, followed by the content of Fe2O3 and K2O. Other constituents are present at less than 1.00 wt.%. The LOI was relatively low, which can be attributed to the loss of free water and the dehydroxylation of clay minerals and goethite (Nayak & Singh, Reference Nayak and Singh2007; Ounissi et al., Reference Ounissi, Mahmoudi, Valentini, Bennour, Garbin, Artioli and Montacer2020).
Chemical composition of the EM and EM700°C (wt.%).

Table 2 Long description
The table reports oxide composition by weight percent for EM and the same material after heating to 700 degrees C. In both samples, SiO2 is the dominant component, increasing from 70.66 wt.% in EM to 74.61 wt.% after heating. Al2O3 is the second largest component and decreases slightly from 15.67 to 14.80 wt.%. Fe2O3 also drops from 5.28 to 4.85 wt.%, and K2O decreases from 2.02 to 1.90 wt.%. Na2O increases from 0.20 to 0.48 wt.%, while TiO2 changes little from 0.74 to 0.76 wt.%. Minor oxides remain low: MgO decreases from 0.29 to 0.17 wt.%, CaO rises from 0.18 to 0.30 wt.%, and Others stays at 0.24 wt.% in both. LOI decreases notably from 4.72 to 2.6 wt.%, indicating reduced volatile or moisture-related loss after heating. Values are given as weight percent and should be interpreted as bulk composition for each condition.
Semi-quantitative analysis revealed that the minerals in the EM (Fig. 2a) are mainly quartz (37 wt.%), kaolinite and halloysite (25 wt.%), dioctahedral mica (21 wt.%), feldspar (15 wt.%, mainly K-feldspar) and goethite (2 wt.%). From the XRD traces of the clay-fraction isolates, it can be seen that kaolinite/halloysite and dioctahedral mica are the dominant phases in the clay fraction, with small amounts of dioctahedral mica/smectite and chlorite in the clay fraction (Fig. 2b). After calcination at 700°C, the reflections of goethite disappeared and new reflections of hematite appeared, indicating the transformation of goethite to hematite due to dehydration and dehydroxylation (Equation 1). This transformation has been previously reported to occur at ∼300°C (Kar & Equeenuddin, Reference Kar and Equeenuddin2019). Similarly, dehydroxylation led to the disappearance of kaolinite reflections and the emergence of a broad, weak amorphous hump, indicating the transformation of kaolinite into amorphous metakaolin (Equation 2; Teklay et al., Reference Teklay, Yin, Rosendahl and Bøjer2014). By contrast, the reflection of dioctahedral mica was slightly decreased due to dehydroxylation (Drits, Reference Drits2003; Kogure et al., Reference Kogure, Kameda and Drits2007), while the reflection of quartz remained unchanged.
 \begin{align}{300^\circ \text{C: }\alpha \text{- FeOOH (goethite) }} \to \alpha {\text{ F}}{{\text{e}}_{\text{2}}}{{\text{O}}_{\text{3}}}{\text{ (hematite) + }}{{\text{H}}_{\text{2}}}{\text{O (gas) }}
\end{align}
 \begin{align}& {\text{450--750}^\circ \text{C: A}}{{\text{l}}_{\text{2}}}{{\text{(OH)}}_{\text{4}}}{\text{S}}{{\text{i}}_{\text{2}}}{{\text{O}}_{\text{5}}}{\text{ (kaolinite) }}\nonumber\\
& \qquad \to {\text{ A}}{{\text{l}}_{\text{2}}}{{\text{O}}_{\text{3}}} \cdot {\text{2Si}}{{\text{O}}_{\text{2}}}{\text{ (metakolin) + 2}} {{\text{H}}_{\text{2}}}{\text{O (gas) }}
\end{align}
(a & b) XRD traces, (c) FTIR spectra, (d) TG/DTG results and SEM images of (e) EM and (f) EM700°C.

Figure 2 Long description
The image A showing an XRD line plot comparing EM and EM700. The y-axis is labeled Intensity (a.u.). The x-axis is labeled Cu-Kalpha (2theta) and shows tick labels from 10 to 70. Two traces are labeled EM and EM700. A legend lists phase labels: Dioctahedral mica, Kaolinite/halloysite, Goethite, Feldspar, Quartz, Hematite. Multiple peaks are marked with symbol indicators aligned to the legend entries. The image B showing an XRD line plot with three traces labeled EM-N, EM-B and EM-T. The y-axis is labeled Intensity (a.u.). The x-axis is labeled Cu-Kalpha (2theta) with tick labels at 5, 10, 15, 20 and 25. A legend lists: Dioctahedral mica/Smectite, Chlorite, Dioctahedral mica, Kaolinite/halloysite. Peak-spacing annotations shown on the plot are 10.0 A, 7.1 A, 5.0 A, 3.8 A and 3.6 A. An additional spacing annotation 14.2 A is shown near the EM-B trace. The image C showing an FTIR line plot comparing EM and EM700. The y-axis is labeled Transmittance (percent). The x-axis is labeled Wavenumber (cm superscript -1) and runs from 4000 down to 500, with a break mark between the higher and lower wavenumber regions. Two traces are labeled EM and EM700. Vertical dashed guide lines are labeled at 3695, 3620, 1638, 1106, 1031, 1006, 1077, 796, 754, 694 and 538. The image D showing a TG and DTG plot. The x-axis is labeled Temperature (degrees C) and spans 0 to 1000 with tick labels at 200, 400, 600, 800 and 1000. The left y-axis is labeled Mass loss (percent) with tick labels 94, 95, 96, 97, 98, 99 and 100. The right y-axis is labeled DTG (percent per degrees C) with tick labels 0.010, 0.005, 0.000, minus 0.005, minus 0.010, minus 0.015 and minus 0.020. The mass curve shows stepwise decreases with bracket annotations reading Mass loss: 0.7 percent, Mass loss: 1.1 percent, Mass loss: 2.7 percent and Mass loss: 0.8 percent. The DTG curve shows labeled minima at 255.8 degrees C and 478.0 degrees C. The image E showing an SEM micrograph labeled EM. Text on the micrograph reads Tubular halloysite. A large irregular particle is shown with a highlighted inset region. The inset shows clustered elongated tubular features. The scale bar reads 5 micrometer. The image F showing an SEM micrograph labeled EM700. Text on the micrograph reads Platy clay. A highlighted inset region shows stacked sheet-like features. The scale bar reads 1 micrometer.
The specific surface areas determined using the using the multi-point BET method of EM and EM700°C were 8.04 and 7.83 m2 g–1, respectively, with the difference being attributed to the sintering of EM after calcination at 700°C (Altuntas et al., Reference Altuntas, Oguzhan and Yildirim2025). The particle-size distribution curves demonstrated that the D 10 values of EM and EM700°C were 2.90 and 5.90 μm, respectively, while the D 50 values of both were 32.3 μm (Fig. S1).
The FTIR spectra of EM and EM700°C are shown in Fig. 2c. For the EM, the bands at 3697 and 3650 cm–1 were attributed to the O–H stretching of inner-surface hydroxyl groups in clay minerals (kaolinite, halloysite and dioctahedral mica), while the band at ∼3620 cm–1 corresponded to the O–H stretching of inner hydroxyl groups (Madejová & Komadel, Reference Madejová and Komadel2001). The band at ∼913 cm–1 was also attributed to the O–H vibration of inner hydroxyl groups. Collectively, these bands served as indicators of the ordered structure of kaolinite (Parker, Reference Parker1969). Additionally, the band at 1103 cm–1 was assigned to perpendicular Si–O stretching, and the bands at 1032 and 1008 cm–1 were related to in-plane Si–O stretching vibrations (Zhang et al., Reference Zhang, Yu, Guo, Chen, Liu and Yuan2023; Dihaji et al., Reference Dihaji, Azerkane, Bih, Essaddek and Haily2025). After calcination, significant changes were observed. The characteristic kaolinite bands in the range of 3697–3620 cm–1 and at 913 cm–1 disappeared. Meanwhile, the distinct Si–O stretching bands at 1106, 1031 and 1009 cm–1 were replaced by a broad and asymmetric band centred at 1080 cm–1, which was assigned to the symmetrical stretching vibration of Si–O–T (T = Si or Al). These spectral changes indicated the transformation of kaolinite/halloysite into metakaolin/metahalloysite.
The calcined EM changed from its original yellow colour to a dark red colour (Fig. 1). According to the XRD results shown in Fig. 2a, this may be due to the transformation of goethite into hematite after high-temperature oxidation. Figure 2d shows that the EM exhibited two distinct stages of mass loss. The mass loss of 1.1% observed in the 200–400°C interval is ascribable to the dehydration of interlayer water in clay minerals and the dehydroxylation of goethite (Kar & Equeenuddin, Reference Kar and Equeenuddin2019), while the mass loss of 2.7% observed in the 400–700°C interval is ascribable to the dehydroxylation of clay minerals such as kaolinite (Ounissi et al., Reference Ounissi, Mahmoudi, Valentini, Bennour, Garbin, Artioli and Montacer2020). Notably, the LOI value (Table 2) of the EM was consistent with its TG behaviour, while the higher LOI observed for EM700°C was probably influenced by post-calcination moisture adsorption. SEM images (Fig. 2e,f) indicate that nanotubular clay minerals (halloysite) and platy clay minerals (kaolinite and dioctahedral mica) were present in EM and EM700°C.
Mechanical properties of the acid/alkali-activated EM-based geopolymers
The compressive strength of PG exhibited a trend of first increasing and then decreasing with increasing water/binder mass ratios (Fig. 3a). PG prepared from a water/binder mass ratio of 0.7 and an Al/P molar ratios of 1.0 exhibited the highest compressive strengths of 21.94 and 18.19 MPa after 7 and 28 days of curing, respectively. The low water/binder mass ratio caused the geopolymer slurry to become too viscous to mix evenly, preventing the EM700°C particles from fully reacting with the acid activator and hindering the geopolymerization. Therefore, increasing the water/binder mass ratio was conducive to the diffusion of monomers in the solution. However, adding excessive water also increased the pH of the acid activator, which was not beneficial to the dissolution of Al2O3 in EM700°C and resulted in insufficient levels of [AlO4] and [PO4] monomers for polymerization. The decrease in gel formation ultimately led to a reduction in the compressive strength of the geopolymer (Perera et al., Reference Perera, Hanna, Davis, Blackford, Latella, Sasaki and Vance2008).
Compressive strength of PGs with different (a) water/binder mass ratios and (b) Al/P molar ratios. Compressive strength of AGs with different (c) water/binder mass ratios and (d) SiO2/Na2O molar ratios. d = day.

Figure 3 Long description
Four sub-images labeled (a), (b), (c) and (d), each showing a grouped bar chart with error bars. The sub-image (a) includes the text “water/binder” and a legend with “7 d” and “28 d”. The vertical axis label is “Compressive strength (MPa)”, with tick labels 0, 5, 10, 15, 20, 25, 30, 35. The horizontal axis categories are “0.6PG-1.0M”, “0.7PG-1.0M” and “0.9PG-1.0M”. Bar heights: for “0.6PG-1.0M”, 7 d is 17 and 28 d is 15; for “0.7PG-1.0M”, 7 d is 22 and 28 d is 18; for “0.9PG-1.0M”, 7 d is 21 and 28 d is 18. The sub-image (b) includes the text “Al/P” and a legend with “7 d” and “28 d”. The vertical axis label is “Compressive strength (MPa)”, with tick labels 0, 5, 10, 15, 20, 25, 30, 35. The horizontal axis categories are “0.7PG-0.7M”, “0.7PG-0.8M”, “0.7PG-0.9M”, “0.7PG-1.0M” and “0.7PG-1.1M”. Bar heights: for “0.7PG-0.7M”, 7 d is 12 and 28 d is 11; for “0.7PG-0.8M”, 7 d is 23 and 28 d is 21; for “0.7PG-0.9M”, 7 d is 26 and 28 d is 23; for “0.7PG-1.0M”, 7 d is 23 and 28 d is 19; for “0.7PG-1.1M”, 7 d is 19 and 28 d is 16. The sub-image (c) includes the text “water/binder” and a legend with “7 d” and “28 d”. The vertical axis label is “Compressive strength (MPa)”, with tick labels 0, 5, 10, 15, 20, 25, 30, 35. The horizontal axis categories are “0.6AG-1.50W”, “0.7AG-1.50W” and “0.8AG-1.50W”. Bar heights: for “0.6AG-1.50W”, 7 d is 8 and 28 d is 10; for “0.7AG-1.50W”, 7 d is 4 and 28 d is 5; for “0.8AG-1.50W”, 7 d is 2 and 28 d is 3. The sub-image (d) includes the text “SiO2/NaO” and a legend with “7 d” and “28 d”. The vertical axis label is “Compressive strength (MPa)”, with tick labels 0, 5, 10, 15, 20, 25, 30, 35. The horizontal axis categories are “0.6AG-1.25W”, “0.6AG-1.50W”, “0.6AG-1.75W” and “0.6AG-2.00W”. Bar heights: for “0.6AG-1.25W”, 7 d is 6 and 28 d is 7; for “0.6AG-1.50W”, 7 d is 7 and 28 d is 9; for “0.6AG-1.75W”, 7 d is 7 and 28 d is 12; for “0.6AG-2.00W”, 7 d is 4 and 28 d is 11.
To study the impact of various Al/P molar ratios on various aspects of the geopolymerization reaction, two common approaches can be taken: one is to change the Al content in the raw material by adding supplementary phases such as Al2O3 powder, and the other, which was used in this study, is to change the [PO4] content by adjusting the amount of phosphoric acid activator while water/binder mass ratio remained fixed (Alvi et al., Reference Alvi, Li, Hu, Onyekwena, Hou and Hakuzweyezu2024). The compressive strength of PG with different Al/P molar ratios showed a trend of first increasing and then decreasing (Fig. 3b). With the Al/P molar ratio of 0.9, the highest compressive strength values of 27.31 and 24.37 MPa were achieved after 7 and 28 days of curing, respectively. By reducing the Al/P molar ratio through increasing the amount of phosphoric acid in the mixture, more [AlO4] was dissolved from metakaolin/calcined halloysite and dioctahedral mica calcined at 700°C, and more [PO4] and [AlO4] monomers were available for polymerization. However, the excessive phosphoric acid levels caused the geopolymer slurry to become too viscous to stir evenly (Alvi et al., Reference Alvi, Li, Hu, Onyekwena, Hou and Hakuzweyezu2024). As a result, the degree of geopolymerization decreased, ultimately leading to a decrease in the compressive strength of the geopolymer. By contrast, increasing the Al/P molar ratio improved the fluidity of the geopolymer slurry, promoting the diffusion of monomers in the solution to facilitate the geopolymerization reaction. However, the lower phosphoric acid levels were not conducive to the depolymerization of EM700°C and could not provide enough [PO4] and [AlO4] monomers for polymerization, resulting in a low degree of geopolymerization and low compressive strength. Overall, the Al/P molar ratio should be adjusted based on the desired workability of the paste and final compressive strength.
Increasing water/binder mass ratios impacted the compressive strength of AG in a different fashion from that observed for PG (Fig. 3c). When the water/binder ratio was 0.5, the insufficient alkaline activator made the slurry difficult to stir, leading to poor geopolymer formation. When the water/binder mass ratio was 0.6, the highest compressive strengths of the prepared 0.6AG-1.50W were only 7.21 and 9.36 MPa after 7 and 28 days of curing, respectively. As the water/binder mass ratio continued to increase, the compressive strength of AG gradually decreased. Although the high water/binder mass ratio increased the flowability of the geopolymer slurry and made the geopolymerization between EM700°C and the alkali activator more thorough, the microstructure of the geopolymer was more porous as more water was evaporated during curing (Huang & Wang, Reference Huang and Wang2024). Therefore, the high water/binder mass ratio was not conducive to increasing the compressive strength of AG.
The compressive strengths of the AG geopolymer samples prepared with increasing SiO2/Na2O molar ratios showed a trend of an initial increase, followed by a loss of compressive strength (Fig. 3d). AG prepared with a SiO2/Na2O molar ratio of 1.75 exhibited the highest compressive strengths of 7.82 and 11.66 MPa after 7 and 28 days of curing, respectively. The 28 day compressive strengths of AG-1.25W, AG-1.50W, AG-1.75W and AG-2.00W were 22.4%, 30.6%, 50.0% and 182.1% higher than their 7 day compressive strengths, respectively. This indicated that an increase in the molar ratios of SiO2/Na2O was beneficial for the development of later-age compressive strength in AG. However, excessively high SiO2/Na2O molar ratios resulted in low degrees of geopolymerization, as the [SiO4] and [AlO4] monomers produced by the alkaline activation process could not effectively diffuse, resulting in a loss of geopolymer compressive strength (Duxson et al., Reference Duxson, Provis, Lukey, Mallicoat, Kriven and van Deventer2005; Khale & Chaudhary, Reference Khale and Chaudhary2007; Liew et al., Reference Liew, Heah, Mohd Mustafa and Kamarudin2016; Khalifa et al., Reference Khalifa, Cizer, Pontikes, Heath, Patureau, Bernal and Marsh2020; Zhang et al., Reference Zhang, Yu, Guo, Chen, Liu and Yuan2023). Geopolymers prepared at SiO2/Na2O molar ratios of 2.50 and 3.00 could not solidify into distinct shapes. Therefore, the SiO2/Na2O molar ratio of 1.75 could be considered the optimal choice for AG in terms of the development of early and later compressive strength. In a study by Yuan et al. (Reference Yuan, Chen, Zhao, Li, Liu, Guo and Zhang2022), AG with SiO2/Na2O molar ratios of 0.5 exhibited the highest compressive strength. The different results observed here and in the study by Yuan et al. (Reference Yuan, Chen, Zhao, Li, Liu, Guo and Zhang2022) regarding the SiO2/Na2O molar ratios might be due to the different composition in EM, as the EM700°C used in the current study has less of the amorphous phase derived from kaolinite than the calcined EM used by Yuan et al. (Reference Yuan, Chen, Zhao, Li, Liu, Guo and Zhang2022).
In summary, the optimal water/binder mass ratio for PG and AG is different due to variations in the active phase and activator composition. Moreover, even though visual inspection suggested that AG exhibited a smoother surface than PG, the compressive strength values of PG were higher than those of AG, which can be attributed to the different geopolymerization products formed in the acidic and alkaline systems (Perera et al., Reference Perera, Hanna, Davis, Blackford, Latella, Sasaki and Vance2008; Zhang et al., Reference Zhang, Guo, Yuan, Li, Wang, Deng and Liu2020b). To further validate these findings and better assess the engineering relevance of the materials, future work will employ standardized mortar tests (e.g. ASTM C109) to enable direct comparison and to obtain a clearer evaluation of the practical applicability of these materials.
Compositions and microstructures of the geopolymers
Phase assemblage of the acid/alkali-activated EM-based geopolymers
The main crystal mineral components of EM-based PG were dioctahedral mica and quartz, similar to that of EM700°C (Figs 2a & 4). This indicated that the crystal structures of quartz were difficult to destroy with phosphoric acid and that dioctahedral mica had a very limited participation in geopolymerization (Perera et al., Reference Perera, Hanna, Davis, Blackford, Latella, Sasaki and Vance2008). Nevertheless, dioctahedral mica also slightly contributed to the compressive strength development of PG, and part of the dioctahedral mica or quartz might have acted as fillers in the skeleton of geopolymer. In addition, variscite (AlPO4·2H2O, 20.8 and 29.3°2θ) and vashegyite (Al6(PO4)5(OH)3·23H2O, 12.8, 15.8, 25.7 and 28.1°2θ) appeared in PG, probably due to varying degrees of polycondensation between [AlO4] generated by the dissolution of EM700°C and [PO4] provided by the acidic activator (Onac et al., Reference Onac, Zaharia, Kearns and Veres2006). According to Guo et al. (Reference Guo, Zhang, Deng, Yuan, Li and Wang2021), the main component of PG is generally amorphous silico-aluminophosphate (Si–O–Al–O–P; SAP), with a hump centred at 27°2θ. However, this phenomenon could not be clearly observed in this experiment, which may be due to the high reflection of quartz resulting in unclear envelope peaks.
XRD results of PGs with different (a) water/binder mass ratios and (b) Al/P molar ratios. XRD results of AGs with different (c) water/binder mass ratios and (d) SiO2/Na2O molar ratios.

Figure 4 Long description
The figure consists of four XRD plots, each showing intensity versus Cu-Kalpha two theta in degrees. The x-axis is labeled ′Cu-Kalpha (2θ) in degrees′ and the y-axis is labeled ′Intensity (a.u.)′. Each plot compares different sample conditions. In plot (a), titled ′water/binder′, four traces are shown: 0.9PG-1.0M, 0.7PG-1.0M, 0.6PG-1.0M and 0.5PG-1.0M. Peaks are marked for dioctahedral mica, quartz, feldspar, vashegyite and variscite. A dominant peak appears around 20–25 degrees, with variations in peak intensity and additional peaks indicating phase differences. Plot (b), titled ′Al/P′, includes traces for 0.7PG-1.1M, 0.7PG-1.0M, 0.7PG-0.9M, 0.7PG-0.8M and 0.7PG-0.7M. Similar phase markers are used, with notable intensity changes and peak shifts reflecting compositional effects on phase formation. Plot (c), titled ′water/binder′, shows traces for 0.8AG-1.50W, 0.7AG-1.50W, 0.6AG-1.50W and 0.5AG-1.50W. Peaks for dioctahedral mica, quartz, faujasite and feldspar are marked, with significant peaks around 20–25 degrees and additional peaks indicating phase presence. Plot (d), titled ′SiO/NaO′, includes traces for 0.7AG-2.00W, 0.7AG-1.75W, 0.7AG-1.50W and 0.7AG-1.25W. The same phase markers are used, with variations in peak intensity and positions highlighting the impact of SiO/NaO ratios on phase development. Overall, the plots illustrate how varying water/binder, Al/P and SiO/NaO ratios affect phase formation and intensity in the samples, with key peaks around 20–25 degrees indicating dominant phases.
XRD analysis of the PG matrix showed that the reflections of variscite and vashegyite became more intense with increasing water/binder ratio (Fig. 4a). This could be attributed to the lower concentration of [PO4] and [AlO4] monomers generated by acid activation, being more inclined to form variscite rather than the highly polymerized SAP gel.
From the XRD traces of the PG samples with various Al/P molar ratios, it could be inferred that the smaller the Al/P molar ratio, the stronger the reflections of variscite and vashegyite (Fig. 4b). This could be explained as follows: a smaller Al/P molar ratio means a higher phosphoric acid content in the acid activator used and a lower pH in the solution. The Al in the raw material was more easily dissolved to form [AlO4] monomers than in geopolymers with a higher Al/P molar ratio. Therefore, there would be more [PO4] monomers present in the solution to undergo condensation reactions with the [AlO4] monomers generated by acid activation, resulting in higher aluminium phosphate mineral generation.
The XRD traces of the AG samples prepared using various water/binder ratios showed that the main mineral components in AG were dioctahedral mica and quartz contained in EM700°C (Fig. 4c), indicating that their alkali-based geopolymerization reactivity was low and such mineral phases could not fully participate in the geopolymerization. However, these unreacted minerals can fill spaces between the network structure of geopolymerization products to supplement the compressive strength. Nevertheless, octahedral zeolite (i.e. faujasite; 6.2, 11.9, 23.6 and 31.4°2θ) was formed in the geopolymer, and its reflection intensity became higher with increasing water/binder ratio, indicating that higher water levels promoted the formation of faujasite through the reaction of clay minerals and the alkaline solution (Wu et al., Reference Wu, Huang, Xiao, Li, Yao, Deng and Tan2021). However, according to the compressive strength results, a high water/binder ratio led to a geopolymer with low compressive strength. Hence, the formation of faujasite may have negative effects on the compressive strength of AG.
In terms of the comparison of the XRD traces of AG prepared with various SiO2/Na2O molar ratios (Fig. 4d) and EM700°C, the reflection intensities of dioctahedral mica and quartz were basically the same, but the reflection intensity of faujasite decreased with increasing SiO2/Na2O molar ratio. This can be explained by consideration of the highly alkaline environment required for faujasite synthesis, and that EM700°C could be depolymerized to form more nuclei for the formation of faujasite at higher pH values (Zhang et al., Reference Zhang, Yu, Guo, Chen, Liu and Yuan2023).
FTIR spectra of the acid/alkali-activated EM-based geopolymers
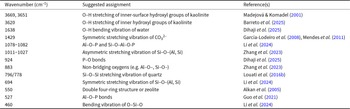
Figure 5 displays the FTIR spectra of the EM after acid/alkaline activation in the scanning range of 400–2000 cm–1 after 28 days of curing. The wavenumbers corresponding to possible vibration modes in PG and AG are given in Table 3. The FTIR spectroscopy results of PG under various Al/P molar ratios were consistent, and the characteristic peak positions remain unchanged (Fig. 5a), indicating that the Al/P molar ratio had little effect on the composition and structure of PG. The peaks at 796 and 778 cm–1 remained unchanged in all PG specimens, indicating that quartz did not participate in the geopolymerization (Louati et al., Reference Louati, Baklouti and Samet2016b), which was consistent with the XRD results. The characteristic absorption peak at 1077 cm–1 belonging to the asymmetric stretching vibration of Si–O–T (T = Al, Si) groups in EM700°C (Fig. 1b) shifted to the left to ∼1080 cm–1 after geopolymerization induced by phosphoric acid, indicating the occurrence of chemical alterations. This might be due to the overlap of the asymmetric stretching vibration band assigned to the Al–O–P bonds (Li et al., Reference Li, Zhang, Lang, Dong and Huang2024; Niu et al., Reference Niu, Elakneswaran and Hiroyoshi2024) or due to the partial replacement of [SiO4] by [PO4], resulting in a red shift of the absorption peak (Louati et al., Reference Louati, Baklouti and Samet2016b), where some Si–O–Al–O–Si bonds in geopolymer were transformed into the amorphous gel of SAP (Guo et al., Reference Guo, Zhang, Deng, Yuan, Li and Wang2021).
FTIR spectra of (a) PGs with various Al/P molar ratios and (b) AGs with various SiO2/Na2O molar ratios.

Figure 5 Long description
The image A showing FTIR transmittance spectra for a PG sample series. The y-axis label is Transmittance percent. The x-axis label is Wavenumber (cm superscript minus 1). The x-axis runs from 2000 to 400 with labeled ticks at 2000, 1800, 1600, 1400, 1200, 1000, 800, 600 and 400. The plotted variable is transmittance percent versus wavenumber, with multiple absorption bands marked by vertical dashed guide lines. Five spectra are labeled: 0.7PG-1.1M, 0.7PG-1.0M, 0.7PG-0.9M, 0.7PG-0.8M and 0.7PG-0.7M. Vertical dashed guide lines are labeled at 1638, 1384, 1078, 1080, 1081, 924, 883, 796, 778, 694, 550, 527 and 460. Numeric peak labels printed near the curves include 1078 (on 0.7PG-1.1M), 1080 (on 0.7PG-1.0M), 1080 (on 0.7PG-0.9M), 1081 (on 0.7PG-0.8M) and 924 (on 0.7PG-0.7M). Across the PG series, the marked band in the 1078 to 1081 region is shown with labels 1078, 1080, 1080 and 1081 on different PG spectra, while the same set of dashed reference positions at 1638, 1384, 924, 883, 796, 778, 694, 550, 527 and 460 is shown for the group. The image B showing FTIR transmittance spectra for an AG sample series. The y-axis label is Transmittance percent. The x-axis label is Wavenumber (cm superscript minus 1). The x-axis runs from 2000 to 400 with labeled ticks at 2000, 1800, 1600, 1400, 1200, 1000, 800, 600 and 400. The plotted variable is transmittance percent versus wavenumber, with multiple absorption bands marked by vertical dashed guide lines. Four spectra are labeled: 0.6AG-2.00W, 0.6AG-1.75W, 0.6AG-1.50W and 0.6AG-1.25W. Vertical dashed guide lines are labeled at 1638, 1452, 1384, 1027, 1026, 1013, 924, 883, 796, 778, 694, 550, 527 and 460. Numeric peak labels printed near the curves include 1027 (on 0.6AG-2.00W), 1026 (on 0.6AG-1.75W), 1013 (on 0.6AG-1.25W) and 924 (printed near a lower AG spectrum). Additional labeled guide-line values shown for the AG group include 883, 796, 778, 694, 550, 527 and 460. Across the AG series, the labeled band in the 1013 to 1027 region is shown with labels 1027, 1026 and 1013 on different AG spectra, while the same set of dashed reference positions at 1638, 1452, 1384, 924, 883, 796, 778, 694, 550, 527 and 460 is shown for the group.
Wavenumbers and assignments of the FTIR spectroscopy peaks.

Table 3 Long description
The table lists FTIR peak wavenumbers in inverse centimeters with suggested vibrational assignments and literature references. High-wavenumber bands at 3669 and 3651 are assigned to inner-surface hydroxyl stretching in kaolinite, and 3620 to inner hydroxyl stretching in kaolinite. A mid-range band at 1638 is attributed to water hydroxyl bending. Carbonate is indicated by a band at 1429 assigned to symmetric carbonate stretching. Silicate and aluminosilicate features include bands around 1078 to 1082 and 1011 to 1027, plus a band at 694, all linked to silicon oxygen frameworks with aluminum substitution and, in some cases, phosphate involvement. Phosphate-related signals appear at 924 and 527, while 883 is attributed to non-bridging oxygen sites. Quartz is identified by a paired band at 796 and 778, and a low-wavenumber band at 460 is assigned to oxygen silicon oxygen bending; a band at 550 is linked to a double four-ring or zeolite-type structure. Assignments are suggested interpretations and may overlap across minerals, so confirmation typically depends on sample context and supporting analyses.
The FTIR spectra of AG prepared with various SiO2/Na2O molar ratios were represented in Fig. 5b. The absorption peak at 1638 cm–1 corresponds to the bending vibration of the hydroxyl group of water (Niu et al., Reference Niu, Elakneswaran and Hiroyoshi2024). The broad peak between 1011 and 1027 cm–1 indicated that the AG samples mainly consisted of amorphous phases. The new absorption band at 550 cm–1 was attributed to zeolite (faujasite; Alkan et al., Reference Alkan, Hopa, Yilmaz and Güler2005; Marsh et al., Reference Marsh, Heath, Patureau, Evernden and Walker2018; Zhang et al., Reference Zhang, Guo, Yuan, Li, Wang, Deng and Liu2020b). As the molar ratios of SiO2/Na2O increased, the ‘main band’ of the geopolymer gradually shifted from 1011 to 1027 cm–1, mainly due to higher Si content. Due to the shorter bond length of the Si–O bond compared to the Al–O bond, an increase in the Si content caused the Si–O–T (T = Si, Al) stretching vibration peak to shift towards higher wavenumbers (Zhang et al., Reference Zhang, Wang, Provis, Bullen, Reid and Zhu2012, Reference Zhang, Provis, Wang, Bullen and Reid2013, Reference Zhang, Guo, Yuan, Li, Wang, Deng and Liu2020b). As SiO2/Na2O increased, the absorption band of CO32– (1452 cm–1), resulting from the carbonization of specimens with CO2 in the air, gradually weakened (Yu et al., Reference Yu, Chen, Guo, Zhang, He and Zheng2023a). This could be explained by considering that a higher SiO2/Na2O molar ratio means lower alkalinity of the activator, corresponding to lower alkali content in the geopolymer, thereby making it less prone to carbonization by atmospheric CO2.
SEM results of the acid/alkali-activated EM-based geopolymers
The SEM images and EDX results of PG with various Al/P molar ratios are displayed in Fig. 6 & Table S1, respectively. Platy clay minerals of metakaolin and calcined dioctahedral mica reacted with the phosphoric acid, contributing to the development of the compact PG microstructure. Particles stacked layer by layer in a spiral shape were found in specimen 0.7PG-0.7M (Fig. 6a), with the EDX results revealing that these particles could be ascribed to variscite (Fig. 6b, 1#). The matrix of 0.7PG-0.7M was mainly composed of O, Si, Al, P and traces of Fe and K elements according to the EDX analysis (Fig. 6c, 2#), which indicated the occurrence of geopolymerization. Some petal-shaped particles (Fig. 6d, 3# & Fig. 6e, 5#) were found in the specimen with Al/P = 0.9. EDX analysis showed that those particles were mainly composed of P, Al and Si, which should be attributed mainly to SAP gel. Spherical particle clusters (Fig. 6f, 6#) with the main elements of P and Al may be attributed to variscite (Kirsten et al., Reference Kirsten, Andreas and Gerhard2007). Similarly, the matrix of 0.7PG-0.9M mainly comprised O, P, Al, Si, Fe and traces of K elements according to the EDX analysis (Fig. 6d, 4#).
SEM images of PG with various Al/P molar ratios: (a–c) Al/P = 0.7, (d–f) Al/P = 0.9 and (g–i) Al/P = 1.1.

Obvious cracks were found in specimen 0.7PG-1.1M (Fig. 6g,h), and the EDX results showed that the particles were mainly composed of Si and Al elements and small amounts of K and Na. P was undetectable. These particles should be attributed to the residual EM700°C. The irregular granular particle (Fig. 6h, 7#) was sandwiched between the layers of the EM700°C particles, and the EDX analysis (Fig. 6i, 8#) showed that it had high P and Al contents and low Si content, which can be attributed to SAP gel. The platy clay particles (metakaolin or calcined dioctahedral mica) were not completely reacted (Fig. 6i, 9#). No variscite was found in the specimen with Al/P = 1.1, but a large amount of variscite was found in the specimen with Al/P = 0.7. Variscite was also produced in the specimen with Al/P = 0.9, consistent with the XRD results. An increased Al/P molar ratio means that there is less phosphoric acid content in the acid activator and fewer [PO4] monomers could react with [AlO4]. Therefore, less variscite was formed.
The SEM images and EDX results for AG with various SiO2/Na2O molar ratios are shown in Fig. 7 & Table S2. Many unreacted platy clays (metakaolin or calcined dioctahedral mica) with low Na contents were found to be embedded in the geopolymer matrix (1#, 5# and 6#), causing the formation of many cracks and destroying the homogeneous structure of the geopolymer. Zeolite particles were found in the sample range of 0.6AG-1.25W and 0.6AG-1.50W (Fig. 7a–f, 3#), while almost no zeolite particles were found in sample 0.6AG-1.75W, consistent with the XRD traces (Fig. 4) and with the findings from a previous study (Wang et al., Reference Wang, Alrefaei and Dai2019). The zeolite content of the geopolymer decreased with increasing SiO2/Na2O molar ratio. A honeycomb-like gel was found in specimens of 0.6AG-1.50W and 0.6AG-1.75W, and the EDX results indicated that these gels were mainly composed of Si, Al and Na (2# and 4#), which could be attributed to a sodium aluminosilicate hydrate (N–A–S–H; N = Na, A = Al, S = Si, H = H2O) gel (Fig. 7g–i). Compared with specimen 0.6AG-1.25W, more N–A–S–H gel was formed in 0.6AG-1.75W. Thus, the microstructure of the latter was more compact than that of the former.
SEM images of AG with various SiO2/Na2O molar ratios: (a–c) W = 1.25, (d–f) W = 1.50 and (g–i) W = 1.75.

Pore structures of the acid/alkali-activated EM-based geopolymers
The pore structures of PG with various Al/P molar ratios and AG with various SiO2/Na2O molar ratios are displayed in Fig. 8. PG exhibited lower total porosity than AG (Fig. 8a), consistent with the compressive strength results and the superior mechanical performance of PG compared to AG. PG possessed a more compact microstructure than AG, which mainly resulted from the higher degree of geopolymerization achieved in acid-activated clay mineral-rich EM700°C than that in alkali-activated clay mineral-rich EM700°C. Following the International Union of Pure and Applied Chemistry (IUPAC) classification on pores, pore-size distributions are commonly classified as micropores (diameter <2 nm), mesopores (diameter 2–50 nm) and macropores (diameter >50 nm). Accordingly, PG demonstrated a higher proportion of macropores (consistent with Fig. 1, which highlights the rough surface of the specimen) but fewer micropores and mesopores than AG. Generally, a smaller critical pore size (defines as the pore diameter corresponding to the peak in the differential intrusion curve) results in higher compressive strength (Yu et al., Reference Yu, Zhang, Yuan, Guo, Liu and Chen2023b). Although samples 0.6AG-1.50W and 0.6AG-2.00W exhibited similar total porosities, their critical pore sizes were mainly 400 and 100 nm, respectively (Fig. 8b), which resulted in the higher compressive strength of 0.6AG-2.00W. Therefore, the rough surface and the low total porosity (Fig. 8) of PG indicate that the performance of geopolymers cannot be solely evaluated based on surface observations.
Pore structures of PG with various Al/P molar ratios and AG with various SiO2/Na2O molar ratios: (a) total porosity and (b) pore-size distribution.

Figure 8 Long description
The image A showing a line graph with four curves and a legend listing 0.7PG-1.0M, 0.7PG-1.1M, 0.6AG-2.00W and 0.6AG-1.50W. The x-axis label is Pore Diameter (nm). The x-axis shows logarithmic tick labels 10 to the power of 1, 10 to the power of 2, 10 to the power of 3, 10 to the power of 4, 10 to the power of 5 and 10 to the power of 6. The y-axis label is Total Porosity (percent). The y-axis ranges from 0 to 35 with tick marks every 5. Text annotations near the left side read 33.48 percent (twice), 19.06 percent and 17.08 percent. The 0.6AG-1.50W curve starts near 33.48 percent at about 10 nanometer and stays near that level until roughly 100 nanometer, then drops steeply to near 0 by about 1000 nanometer. The 0.6AG-2.00W curve starts near 33.48 percent at about 10 nanometer and drops steeply to near 0 by about 100 nanometer. The 0.7PG-1.0M curve starts near 17.08 percent at about 10 nanometer and decreases gradually, approaching near 0 by about 100000 nanometer. The 0.7PG-1.1M curve starts near 19.06 percent at about 10 nanometer and decreases gradually, approaching near 0 by about 1000000 nanometer. The image B showing a line graph with four curves and a legend listing 0.7PG-1.0M, 0.7PG-1.1M, 0.6AG-2.00W and 0.6AG-1.50W, plus a small inset plot at the right. The x-axis label is Pore Diameter (nm). The x-axis shows logarithmic tick labels 10 to the power of 1, 10 to the power of 2, 10 to the power of 3, 10 to the power of 4, 10 to the power of 5 and 10 to the power of 6. The y-axis label is Differential Intrusion (cm superscript 3 g superscript -1 nm superscript -1). The y-axis tick labels include 0.0000, 0.0005, 0.0010, 0.0015, 0.0020, 0.0025 and 0.0030. The 0.6AG-2.00W curve has multiple peaks between about 20 and 200 nanometer, including a tallest peak near 100 nanometer reaching about 0.0030. The 0.6AG-1.50W curve stays near 0 for most diameters and shows a smaller peak near about 200 nanometer reaching about 0.0006. The 0.7PG-1.0M and 0.7PG-1.1M curves remain close to 0 across the plotted range. The inset plot shows the same four series over a narrower y-range, with the same x-axis label Pore Diameter (nm) and a y-axis label that is too small to read clearly.
Comparison of the acid/alkali-activated EM-based geopolymers
As a type of construction waste, the production of EM has grown in pace with urban construction, but the utilization rate of EM remains low. Considering that the main components of EM are clay minerals, quartz and feldspar, the present study utilized calcined EM via acid/alkali activation to achieve a low-carbon cementitious material geopolymer. The acid- and alkali-activated geopolymers were compared based on mechanical properties, mineral composition and microstructure, and the report further elaborated on the mechanisms of geopolymerization in PG and AG.
Kaolinite clay minerals greatly contributed to the development of compressive strength in the EM-based geopolymers. The content of kaolinite/halloysite in the EM used in this experiment was 25 wt.%. After calcination at 700°C, kaolinite is completely dehydroxylated and transformed into amorphous metakaolin (containing both SiO2 and Al2O3), which reacts more easily with activators to form a geopolymer network structure. After calcination at 700°C followed by acid and alkaline activation, both dioctahedral mica and quartz exhibited limited geopolymerization reactivity. However, owing to its topotactic dehydroxylation behaviour (Drits, Reference Drits2003; Kogure et al., Reference Kogure, Kameda and Drits2007), dioctahedral mica may still partially participate in the geopolymerization process. In contrast, the crystal structure of quartz remained intact, serving mainly as a filler material.
The findings further contrasted other aspects of the acid- and alkali-based geopolymerization pathways.
The curing conditions
PG required a high curing temperature (70°C) and a longer curing duration (7 days), while AG could be produced by curing at room temperature for 1 day. Considering the limited reactivity of [SiO4] with the acidic activator, the depolymerization reaction could only start from [AlO4], which would release the monomer at a slow rate, prolonging the curing time (Davidovits, Reference Davidovits2008; Liew et al., Reference Liew, Heah, Mohd Mustafa and Kamarudin2016). In addition, the greater accessibility of [AlO4] – formed when the AlO6 octahedra in clay minerals were destroyed during calcination – in 1:1-type clay minerals (kaolinite and halloysite) explains their faster geopolymerization rate than 2:1-type clay minerals such as dioctahedral mica during acid activation due to the different structures between 1:1- and 2:1-type clay minerals (Guggenheim et al., Reference Guggenheim, Adams, Bain, Bergaya, Brigatti and Drits2006; White et al., Reference White, Bavykin and Walsh2012). In contrast, when the clay minerals react with the alkaline activator, the amorphous phase (i.e. Al2O3·2SiO2) depolymerizes to release [SiO4] and [AlO4] monomers (Davidovits, Reference Davidovits2008). Therefore, the monomer release rate is fast, and so the setting times can be relatively quick.
Activation mechanisms and geopolymerization products
For PG, acid protons (H⁺) initially attack and depolymerize the aluminosilicate framework in EM700°C, releasing reactive species such as Si–O–Al+, Al3+ and amorphous SiO2 into the solution. Subsequently, these released species undergo a co-condensation (polymerization) reaction along with H+, H2PO4– and PO43–. This process forms a three-dimensional amorphous gel network, characterized by amorphous gel (i.e. SAP). In addition, aluminium phosphate networks may also form under certain conditions (Alvi et al., Reference Alvi, Li, Hu, Onyekwena, Hou and Hakuzweyezu2024; Dihaji et al., Reference Dihaji, Azerkane, Bih, Essaddek and Haily2025). Therefore, geopolymerization in acid-activated EM700°C mainly yielded SAP gel and phosphate-containing crystalline minerals, such as variscite and vashegyite. For AG, the high pH of the alkaline solution promotes the dissolution of Si and Al from EM700°C, releasing [SiO4] and [AlO4] species into the solution. These dissolved species, together with Na+ ions (which balance the negative charge on the [AlO4]), polymerized to form N–A–S–H gels. Therefore, the main geopolymerization product of alkali-activated EM700°C is the N–A–S–H gel, simultaneously accompanied by the production of faujasite. Because SAP gels generally exhibit a higher binding strength than N–A–S–H gels (Perera et al., Reference Perera, Hanna, Davis, Blackford, Latella, Sasaki and Vance2008), PG developed a higher compressive strength than AG. In this study, the contrast was evident: the 7 day compressive strengths of 0.7PG-1.0M and 0.6AG-1.50W reached 21.94 and 7.21 MPa, respectively. Similar results were found in a previous study by Kamwa et al. (Reference Kamwa, Noumbissie, Tome, Idriss, Nemaleu and Tommes2023), in which they reported that natural pozzolan (mainly containing feldspar, calcite, etc.) reacted better under acidic activation than under alkaline activation, due to the bonds formed by acid activation being more stable than those formed by alkaline activation and the easier carbonization of the alkaline activation geopolymer. Tantono et al. (Reference Tantono, Belibi, Baenla and Elimbi2023) investigated the geopolymerization of calcined laterites via acid and alkaline activation, and they found that the compressive strengths of the alkali-activated geopolymer and acid-activated geopolymer were ∼2.0–18.8 and 18.9–52.4 MPa, respectively. This difference could be attributed to the additional reaction between phosphoric acid and certain oxides within the calcined laterites.
Furthermore, it should be noted that the environmental implications of the activators are different for PG and AG. Specifically, the production of alkali activators for AG is highly energy-intensive, leading to substantial CO2 emissions. Conversely, the environmental footprint of PG is more closely tied to resource consumption and byproduct (e.g. phosphogypsum) management stemming from its phosphoric acid production. Although phosphoric acid and alkali activators were used to investigate the geopolymerization mechanism of the clay mineral-rich EM, these findings suggest that there might be a potential application for these materials in wastewater-integrated geopolymer systems, where acidic or alkaline wastewaters may serve as alternative activators and/or hazardous elements could be immobilized within the geopolymer matrix (Meskhi et al., Reference Meskhi, Beskopylny, Stel’makh, Shcherban, Mailyan and Shilov2021).
Conclusion
The current study investigated the effects of water/binder mass ratios and Al/P or SiO2/Na2O molar ratios on the mechanical properties, compositions and microstructures of PG and AG. The findings showed that the EM was composed of clay minerals (dioctahedral mica, kaolinite and halloysite), quartz and goethite. EM700°C demonstrated greater geopolymerization reactivity in the acid solution compared with the alkaline solution. The acid activation of EM700°C produced phosphate-containing compounds and SAP gels. In AG, EM700°C reacted with the alkaline activator, and the main geopolymerization product was the N–A–S–H gel, with zeolite being a byproduct. Metakaolin substantially contributed to the compressive strength development of the EM-based geopolymers. However, calcined dioctahedral mica and quartz mainly acted as fillers in the skeletons of the geopolymers. Moreover, the mechanical properties of PG prepared under the conditions of a water/binder mass ratio of 0.7 and Al/P = 0.9 were superior to those of other PG formulations, with a 28 day compressive strength of 24.37 MPa. The mechanical properties of the AG prepared under the conditions of a water/binder mass ratio of 0.6 and a SiO2/Na2O molar ratio of 1.75 were the best among the AG formulations. Excessive or insufficient water levels had adverse effects on the geopolymerization process, thereby worsening the final mechanical properties.
This study provides a preliminary basis for the practical application of acid/alkali-activated EM-based geopolymers in engineering while highlighting a promising path towards the high-efficiency utilization of clay mineral-rich solid wastes. Nonetheless, the composition and mineralogy of EMs from different geographical regions are highly variable, thus necessitating detailed characterization of the EM itself for geopolymer applications. Future work should extend this foundational study to include systematic evaluations of long-term durability and a comprehensive techno-economic analysis, both of which are essential to fully assessing the viability and scalability of this promising approach.
Supplementary material
The supplementary material for this article can be found at https://doi.org/10.1180/clm.2026.10048.
Financial support
The authors gratefully acknowledge the financial support provided by the National Natural Science Foundation of China (Nos. 423020012, 41972045 and 52161145405) and the Guangdong Basic and Applied Basic Research Foundation (No. 2023A1515012180).
Competing interests
The authors declare none.