Introduction
Psychometrics and statistics are the two pillars of clinical neuropsychology (Hilsabeck, Reference Hilsabeck2017). Their use has a major impact on the accuracy of neuropsychological assessment and thereby on important decisions regarding patients’ care. However, the foundations on which these pillars were built may be weaker than originally thought. In recent years, many authors have signaled that neuropsychological assessment needs to innovate through the adoption of new methods that maximally exploit the possibilities of modern technology and new psychometric theory (Bilder, Reference Bilder2011; Bilder & Reise, Reference Bilder and Reise2019; Miller & Barr, Reference Miller and Barr2017).
A topic that has received less attention, however, is the statistical framework on which neuropsychological assessment relies. That is, the traditional diagnostic methods in neuropsychology rely on the frequentist Null Hypothesis Significance Testing (NHST) framework. This statistical framework has been critiqued in the general domain of psychology. One of the main issues with frequentist NHST is the fact that it is very difficult to correctly interpret the p-value and confidence interval (Morey et al., Reference Morey, Hoekstra, Rouder, Lee and Wagenmakers2016; Wagenmakers, Reference Wagenmakers2007). An alternative framework, Bayesian Hypothesis testing, has been proposed which supports more intuitive interpretations (Kass & Raftery, Reference Kass and Raftery1995; Kruschke, Reference Kruschke2014; Kruschke, Reference Kruschke2010; Kruschke & Liddell, Reference Kruschke and Liddell2018b, Reference Kruschke and Liddell2018a; Morey et al., Reference Morey, Hoekstra, Rouder, Lee and Wagenmakers2016; Wagenmakers, Reference Wagenmakers2007; Wagenmakers et al., Reference Wagenmakers, Wetzels, Borsboom and van der Maas2011). The Bayesian statistical framework has a long tradition (e.g., de Finetti, Reference de Finetti1974; Jeffrey, Reference Jeffrey1956; Kass & Raftery, Reference Kass and Raftery1995) and is based on Bayes theorem which was described as early as in 1763 by Thomas Bayes (and first used as an inferential method by Pierre-Simon Laplace).
Although Bayes theorem is not new in the field of neuropsychology (e.g., Crawford et al., Reference Crawford, Garthwaite and Betkowska2009; Elwood, Reference Elwood1993; Gavett, Reference Gavett2015; Gelman & Geurts, Reference Gelman and Geurts2017; Jones, Reference Jones1989), Bayesian hypothesis testing has received less attention. Bayesian inference has been critiqued to be too difficult, which has often impeded widespread adoption of Bayesian methods. However, in recent years many endeavors have been made to make Bayesian methods more accessible. JASP, a simple point-and-click platform, allows researchers to perform analyses from simple t-tests to more complex regression models (Bergh et al., Reference Bergh, Doorn, Marsman, Draws, Kesteren, Derks and Wagenmakers2020; Marsman & Wagenmakers, Reference Marsman and Wagenmakers2017; Wagenmakers et al., Reference Wagenmakers, Love, Marsman, Jamil, Ly, Verhagen and Morey2018). The R package BEST offers an accessible method to compare two groups with much richer information than a traditional t-test (Meredith & Kruschke, Reference Meredith and Kruschke2020). Furthermore, in 2017, a software package called brms was released which allows to estimate complex Bayesian models with a simple line of code (Bürkner, Reference Bürkner2017). These developments have made Bayesian methods more accessible to researchers, but lack ready-to-use Bayesian methods for comparing a patient (i.e., single case) to a control group.
Nevertheless, Bayesian methods are also becoming more accessible for neuropsychology. For instance, Crawford and Garthwaite (Reference Crawford and Garthwaite2007) developed a Bayesian t-test to compare a single case to a control group and incorporated it into a simple to use program accessible to clinicians (available at https://homepages.abdn.ac.uk/j.crawford/pages/dept/abnolims.htm). Crawford et al. also developed a program to estimate Bayesian interval estimates of percentile ranks (Crawford, Garthwaite, & Slick, Reference Crawford, Garthwaite and Slick2009) and to estimate the probability that a patient has a condition of interest given a certain test result with graphical support (Crawford, Garthwaite, & Betkowska, Reference Crawford, Garthwaite and Betkowska2009). More recently, Scandola and Romano (Reference Scandola and Romano2021) released a new software package to perform more advanced Bayesian single-case analyses than the t-test. Their new package offers many opportunities, such as the possibility to compare more than two conditions and solutions for non-normal test scores (Scandola & Romano, Reference Scandola and Romano2021). Thus, accessible Bayesian single-case statistics for clinicians are materializing and the time has now come to renew attention for Bayesian methods.
Aims
In the current paper, our primary aim is to clarify why Bayesian hypothesis testing may be a solid foundation for neuropsychological assessment. In addition, we briefly mention two salient advantages of the Bayesian framework for estimation relevant to neuropsychology. In the current paper we mainly focus on hypothesis testing rather than estimation. Many researchers have advocated for a new statistics: a shift away from hypothesis testing and move toward parameter estimation in psychology (Cumming, Reference Cumming2014; Kruschke, Reference Kruschke2014; Kruschke & Liddell, Reference Kruschke and Liddell2018b). Indeed, parameter estimation provides much richer information than mere hypothesis testing (e.g., Kruschke & Liddell, Reference Kruschke and Liddell2018b; Meredith & Kruschke, Reference Meredith and Kruschke2020). However, neuropsychologists do need to make dichotomous decisions in some situations. For instance, when deciding who to in- or exclude in a specific treatment program. This need for dichotomous decisions is perhaps even more pronounced in research where decisions about patients must be made following a standardized protocol (in which one mostly relies on statistical rules and one cannot consider the richness of data that is typically considered in clinical decision-making). For this reason, hypothesis testing will continue to play an important role in neuropsychological assessment. In addition, our focus on hypothesis testing does not imply that diagnosis needs to be reduced to black-and-white thinking. First of all, Bayesian diagnostic hypothesis testing allows to define a gray zone of diagnosis. Second, continuous interval estimates of the probability that a patient has a certain condition of interest given their test result can complement binary decisions about hypotheses. Moreover, we do not imply that clinical decision-making can be reduced to mere hypothesis testing. Clinicians must integrate information from several sources (both qualitative and quantitative) and statistical tests are only one source of information within this complex decision-making process.
As the fundamentals of Bayesian hypothesis testing and advantages of Bayesian over frequentist hypothesis testing have already been discussed in the context of psychological research (e.g., Etz et al., Reference Etz, Gronau, Dablander, Edelsbrunner and Baribault2018; Kruschke, Reference Kruschke2010; Kruschke & Liddell, Reference Kruschke and Liddell2018a, Reference Kruschke and Liddell2018b; Morey et al., Reference Morey, Hoekstra, Rouder, Lee and Wagenmakers2016; Wagenmakers, Reference Wagenmakers2007; Wagenmakers et al., Reference Wagenmakers, Wetzels, Borsboom and van der Maas2011), we directly explain Bayesian concepts in the context of diagnostic hypothesis testing. In Part I, we explain Bayes theorem and Bayesian diagnostic hypothesis testing. In Part II, we discuss advantages of Bayesian diagnostic hypothesis testing and in Part III we discuss Bayesian estimation. We hope that this renewed attention for Bayesian methods will promote a paradigm-shift in the field, similar to the paradigm-shift that is already taking place in psychology (van de Schoot et al., Reference van de Schoot, Winter, Ryan, Zondervan-Zwijnenburg and Depaoli2017) and will motivate test developers to incorporate Bayesian methods in the design of assessment tools.
Part I. Bayesian diagnostic hypothesis testing
Applications of Bayes Theorem in Clinical Neuropsychology
Kruschke and Liddell (Reference Kruschke and Liddell2018a) explain how Bayesian methods rely on a simple and intuitive reasoning (p. 156):
“The main idea of Bayesian analysis is simple and intuitive. There are some data to be explained, and we have a set of candidate explanations. Before knowing the new data, the candidate explanations have some prior credibilities of being the best explanation. Then, when given the new data, we shift credibility toward the candidate explanations that better account for the data, and we shift credibility away from the candidate explanations that do not account well for the data.”
A more formal way to express this fundamental idea is Bayes’ theorem (Kruschke & Liddell, Reference Kruschke and Liddell2018a). Bayes’ theorem clarifies how we can quantify the probability of a certain hypothesis (H) given the observed data (D) (i.e., posterior probability,
 $$p\left( {H{\rm{|}}D} \right)$$
) (Equation 1). Equation 1 clarifies that the posterior probability is a function of the likelihood of the data given the hypothesis (
 $$p\left( {D{\rm{|}}H} \right)$$
) and the prior probability of the hypothesis (p(H)).
 $$p\left( {H{\rm{|}}D} \right) = \;{{p\left( {D{\rm{|}}H} \right)\;p\left( H \right)} \over {p\left( D \right)}}$$
In a diagnostic context, D is the test result and H is the hypothesis that the patient has or does not have a certain condition of interest (COI) and the posterior probability is better known as the posttest probability (Crawford et al., Reference Crawford, Garthwaite and Betkowska2009) or positive and negative predictive values. That is, the posttest probability reflects the probability that a patient has a COI (COI+) given a positive test result (Test+; a test result that exceeds a cutoff) or the probability that a patient does not have a COI (COI-) given a negative test result (Test-; a test result that does not exceed a cutoff). In short, Bayes’ theorem implies that the probability that a patient has a COI given a positive or negative test result not only depends on the test result and the properties of the test, but also depends on the base rate prevalence of the COI (i.e., pretest or prior probability). For instance, if a test has a sensitivity and specificity of 80%, a patient with a positive test result does not necessarily have an 80% probability to have the COI. If the COI has a prevalence of 1%, the patient’s probability to have the COI is only 4%. A more extensive explanation of Bayes’ theorem is provided in Appendix A.
Bayesian Diagnostic Decisions Are Informed by Prior Beliefs
The implications of Bayes’ theorem for clinical neuropsychological diagnosis have been discussed as early as in 1955 (Crawford, Garthwaite, & Betkowska, Reference Crawford, Garthwaite and Betkowska2009; Elwood, Reference Elwood1993; Frederick & Bowden, Reference Frederick and Bowden2009; Gavett, Reference Gavett2015; Gordon, Reference Gordon1977; Gouvier, Reference Gouvier2001; Ivnik et al., Reference Ivnik, Smith, Cerhan, Boeve, Tangalos and Petersen2001; Jones, Reference Jones1989; Labarge et al., Reference Labarge, McCaffrey and Brown2003; Meehl & Rosen, Reference Meehl and Rosen1955; O’Bryant & Lucas, Reference O’Bryant and Lucas2006; Satz et al., Reference Satz, Fennell and Reilly1970; Slick, Reference Slick, Strauss, Sherman and Spreen2006). Despite these early insights, a review in 2003 observed that it was uncommon to consider the impact of base rates in diagnostic accuracy studies (Woods et al., Reference Woods, Weinborn and Lovejoy2003). Moreover, the importance of base rates and Bayes’ theorem are not always covered by neuropsychological text books (e.g., Brooks et al., Reference Brooks, Sherman, Iverson, Slick, Strauss, Schoenberg and Scott2011; Crawford, Reference Crawford, Goldstein and McNeil2003; Lezak et al., Reference Lezak, Lezak, Howieson, Howieson, Loring, Loring and Fischer2004) and clinicians are inclined to neglect the base rate when estimating the probability that a patient has a COI given a positive test result (Labarge et al., Reference Labarge, McCaffrey and Brown2003). Base rates thus remain an important matter.
Bayes theorem illustrates how Bayesian inference is informed by prior beliefs (i.e., base rate in the diagnostic context). A frequent critique voiced toward Bayesian statistics is the idea that Bayesian inference is too strongly influenced by prior beliefs and is therefore too subjective. Indeed, within a diagnostic context clinicians may find it difficult to determine the prior probability of a COI. Estimates of prevalence of neuropsychological conditions can vary widely across studies. For instance, for hemispatial neglect due to stroke, prevalence estimates range from 0 to 100% (Bowen et al., Reference Bowen, McKenna and Tallis1999). There has also been variability in prevalence estimates of poststroke dementia (Rasquin et al., Reference Rasquin, Lodder and Verhey2005), poststroke visual impairments (Hepworth et al., Reference Hepworth, Rowe, Walker, Rockliffe, Noonan, Howard and Currie2016), ADHD (Polanczyk et al., Reference Polanczyk, de Lima, Horta, Biederman and Rohde2007), cognitive impairments associated with cancer (Pendergrass et al., Reference Pendergrass, Targum and Harrison2018) and global cognitive impairment in cerebral palsy (Stadskleiv, Reference Stadskleiv2020). In addition, it can be difficult to estimate the prior probability of a COI for individual patients, as risk factors for a COI and the context of the referral may increase or decrease the prior probability of the COI (Crawford et al., Reference Crawford, Garthwaite and Betkowska2009). Thus, to support clinical neuropsychologists in using base rate information, it has been recommended that test developers include information in their test manuals about positive predictive values using different cutoffs and assuming different base rates (Frederick & Bowden, Reference Frederick and Bowden2009). Moreover, research to establish base rates of conditions in various clinical settings should become a standard part of test development.
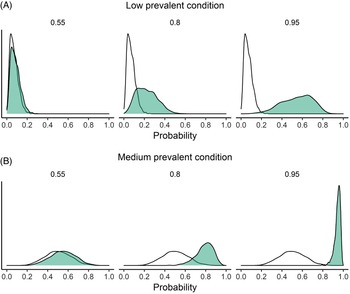
Nonetheless, neuropsychologists may be reluctant to incorporate beliefs about local base rates into clinical decisions. The latter is however not a good reason to neglect base rates. There is an alternative to deal with this uncertainty. Rather than committing to a single estimate of the base rate, one can also reflect the uncertainty about the base rate by representing the prior probability as a distribution of probable prevalence values (i.e., pretest distribution) (Figure 1, white distribution). If the prevalence estimates are uncertain, one can make the prior distribution of prevalence values wider, reflecting this uncertainty.
The pretest (white) and posttest probability distribution (green shaded) for a positive test result for a condition with a prevalence of 5% (A) and 50% (B) for tests with a sensitivity and specificity of 55% (left panel), 80% (middle panel) or 95% (right panel). Pretest distribution = distribution of the probability that the patient has a COI before administering a test (i.e., base rate). Posttest distribution = distribution of the probability that the patient has a COI after administering a test. The posttest distribution only represents the uncertainty of the base rate, not the uncertainty about the sensitivity and specificity.

In addition, it can be very informative to see how test scores change the prior belief. If there is little change, this signals a need for a more informative test instrument. In Figure 1 we show the probability that the patient has a COI before administering a test (white) and after a positive test result (green). A test with a sensitivity and specificity of 55% does not inform diagnosis much in addition to a prior estimate of the prevalence of the COI, as the pretest (white) and posttest (green) probability distributions largely overlap (Figure 1, left panels). In other words, the diagnosis is almost equally accurately informed by the prior prevalence estimate of the COI than by combining this prior estimate with the test that was administered. In contrast, when a test has high sensitivity and specificity, the prior belief has less impact on the posttest probability. This is illustrated in Figure 1 (right panels), where there is little overlap between the posttest and pretest probability distribution for a test with a sensitivity and specificity of 95%. Here, a positive test result increases the probability that the patient has the COI even when the COI is not prevalent.
Comparing Diagnostic Hypotheses: The Posterior Odds and the Bayes Factor
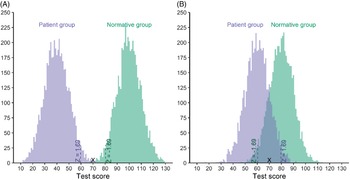
In Equation 1, only one hypothesis was under consideration. However, we often compare two hypotheses. For instance, in neuropsychology we may wish to know whether a person’s test score either belongs to a group of individuals with a COI or a group of individuals without a COI. To answer this question, we typically compare the patient’s test scores to the ones obtained in a normative group without the COI. This comparison can be done using z-scores, t-scores, or percentiles (Brooks et al., Reference Brooks, Sherman, Iverson, Slick, Strauss, Schoenberg and Scott2011; Crawford, Reference Crawford, Goldstein and McNeil2003; Crawford & Garthwaite, Reference Crawford and Garthwaite2007). When one only compares a patient’s test score to a normative group, it remains unclear to what extent the patient’s test score is likely if he belonged to the clinical group (Ivnik et al., Reference Ivnik, Smith, Cerhan, Boeve, Tangalos and Petersen2001; Scandola & Romano, Reference Scandola and Romano2021). For instance, if a patient’s test score exceeds the cutoff value, it is tempting to infer that the patient has a certain COI. However, it may also be possible that the patient’s test score is unlikely in reference to the patient group (Figure 2A). In contrast, if the patient’s test score does not exceed the prespecified criterion, it is tempting to conclude that the patient does not have the COI. However, this is not necessarily the case. Indeed, in this scenario it may also be possible that the patient’s test score is common in the patient group (Figure 2B). Thus, it would be more ideal if we would compare two hypotheses using information of the distribution of test scores in the normative and clinical group (Ivnik et al., Reference Ivnik, Smith, Cerhan, Boeve, Tangalos and Petersen2001; Scandola & Romano, Reference Scandola and Romano2021). For a more elaborate illustration please see Appendix B.
Illustration of the traditional diagnostic approach using z-scores. Illustration of a patient’s test score (X) that is lower than a z-score of -1.69 based on the normative group (A) and a patient’s test score (X) that is not lower than a z-score of −1.69 based on the normative group (B). Values on the y-axis are the number of simulated cases with a certain test score.

Comparison of two hypotheses in the Bayesian framework can be achieved by a simple application of Bayes’ theorem in which we calculate the posterior odds. In Figure A2, we provide an overview of how the formulas relate to the test’s sensitivity, specificity, and posttest probabilities. To obtain the posterior odds, one can combine the Bayes Factor (BF) with the prior odds (Equation 2 and 3 ).
 $${{p({H_1}|D)} \over {p({H_0}|D)}} = BF\;{{p\left( {{H_1}} \right)} \over {p\left( {{H_0}} \right)}}$$
 $$BF = {{p(D|{H_1})} \over {p(D|{H_0})}}$$
The prior odds represents someone’s prior belief regarding the probability ratio of both hypotheses before collecting data. In a diagnostic context, H1 is the hypothesis that the patient has the COI, and H0 is the hypothesis that the patient does not have the COI. These prior odds in diagnosis are the prevalence of the COI divided by the prevalence of not having a COI (p(COI+)/p(COI-)). If the prior odds equal 1 (i.e., prevalence of COI of 50%), both hypotheses are deemed equally likely before collecting data and the BF is then equal to the posterior odds. The BF thus acts as an updating factor, indicating how strongly one should update one’s prior beliefs once data has been observed. In research, the BF is frequently used to test hypotheses. Jeffreys (Reference Jeffreys1961) proposed an interpretation rule for the BF, where BFs between 1 and 3 indicate inconclusive (i.e., “not worth more than a bare mention”) evidence and BFs above 3 indicate substantial evidence (> 10: strong evidence, > 30: very strong). However, in diagnosis it is recommended to inform decisions not merely on the BF, given that the prior odds are unlikely equal to 1 (Kruschke & Liddell, Reference Kruschke and Liddell2018b). That is, with a BF of 3 and prior probability of the COI of 25%, the posterior odds are equal to 1. In this situation it would be equally likely that the patient has the COI and does not have the COI given their test result. Thus, the BF alone is an insufficient metric to inform diagnosis and simple interpretation rules commonly used in research are not appropriate in diagnosis. Note that other methods than the BF are available to test hypotheses that lie beyond the scope of the current paper (Kruschke, Reference Kruschke2011; Lakens et al., Reference Lakens, Scheel and Isager2018).
Bayes Theorem has Broad Applications
In the previous paragraph, Bayes’ theorem was applied to diagnosis, but the above reasoning can also be applied to differential diagnosis. In that case, we compare the hypothesis that the patient has a certain COI (e.g., left-sided hemispatial neglect), to the hypothesis that the patient has a different COI (e.g., right-sided hemispatial neglect) using the same methods as described earlier. Moreover, the same methods can be applied to test whether there are differences between certain COIs within patients. For instance, neuropsychologists often evaluate dissociations between cognitive functions (e.g., discrepancy between performal and verbal IQ) or evaluate the development of a patient’s test performance over time. There are also COIs that require the diagnostician to determine whether patient’s performance differs between the left and right visual field, such as in hemispatial neglect due to stroke. Last, one can also test whether the observed difference in a patient between two conditions of interest differs from the observed differences in a normative group (Crawford, Reference Crawford, Goldstein and McNeil2003).
Part II. Advantages of Bayesian diagnostic hypothesis testing
Apart from the importance of incorporating the influence of the base rate, the Bayesian approach has other advantages for neuropsychological assessment that have received less attention. In the next paragraphs we explain why Bayesian hypothesis testing has the potential to be a solid foundation for neuropsychological assessment.
-
1. Bayesian hypothesis testing answers the diagnosticians’ questions
The Bayesian framework provides an elegant way to directly answer the question that the clinician wants to answer: what is the probability that a patient has a certain COI (or not) given an observed test score (p(COI+|Test+)) or (p(COI-|Test-))? In contrast, this question cannot be answered using traditional diagnostic methods relying on z-scores, t-scores or percentiles, which all answer the question what the probability is that a certain test score is observed given the absence of a COI (p(Test+|COI-)). That is, the Bayesian framework allows us to estimate an unknown (presence of COI) on the basis of what is known (test result), which contrasts traditional diagnostic methods that all focus on the prediction of a known (test result) based on an unknown (presence of COI).
To illustrate the difference between both approaches, we assessed how they inform the diagnosis of poststroke hemispatial neglect using scores on a cancelation task (see Huygelier et al. (Reference Huygelier, Moore, Demeyere and Gillebert2020) for details about the study). A cancelation task is a visual search array in which patients are asked to mark certain shapes (targets) and ignore other shapes (distractors). To diagnose hemispatial neglect according to the traditional approach, the difference in the number of canceled targets between the left and right side of the cancelation page (R-L score) is compared to two fixed percentile cutoffs, such as the 5th and 95th percentile, based on a normative control group (Huygelier et al., Reference Huygelier, Moore, Demeyere and Gillebert2020). If the R-L score of the patient exceeds either one of these percentiles, neglect is diagnosed (i.e., the alternative hypothesis is confirmed). Alternatively, if the R-L score lies within these two percentiles, neglect is not diagnosed (i.e., the null hypothesis is confirmed). Note that this reflects the reasoning that is commonly used in the field, but that is not statistically accurate as the traditional frequentist approach cannot provide evidence in favor of the null hypothesis. It would be more accurate to interpret these results as inconclusive. To diagnose hemispatial neglect according to the Bayesian diagnostic approach, we can use the liberal criterion that the posterior odds have to be smaller than 1/3 to conclude that a patient does not have neglect and larger than 3 to conclude that a patient has neglect. In contrast, posterior odds between 1/3 and 3 are then interpreted as inconclusive. Details of the calculation of the Bayes Factor are reported in Appendix C. Note that the threshold of 3 and 1/3 is liberal (i.e., posterior odds of 3 correspond to a posttest probability of the COI given a positive test result of 75%) and that for individual diagnosis more stringent criteria are recommended (i.e., posterior odds of 10 correspond to a posttest probability of the COI given a positive test result of 90%).
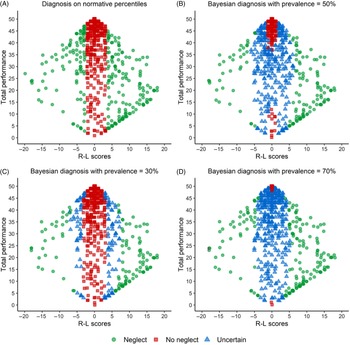
Using the traditional approach and the 5th and 95th percentiles as cutoffs, 39% of stroke patients were classified as having hemispatial neglect and thus 61% were classified as not having neglect (Figure 3A). In contrast, using the Bayesian approach and assuming a neglect prevalence of 50% (Figure 3B), only 22% of patients were classified as having hemispatial neglect (posterior odds > 3). More importantly, only 31% of patients were classified as not having neglect (posterior odds < 1/3). The remaining 47% of patients were not classified, as the posterior odds indicated inconclusive evidence. Thus, the traditional approach suggests that stroke patients with test scores between the 5th and 95th normative percentiles do not have neglect, while the Bayesian approach indicates that further assessment is needed to obtain a clear diagnosis for most of these patients.
Illustration of diagnosis of hemispatial neglect on a cancelation task. Cancelation data of 651 patients are shown with the total number of canceled targets on the y-axis and the difference between cancelations on the 20 leftmost and 20 rightmost targets on the x-axis (R-L scores). More details about these data can be found in Huygelier et al. (Reference Huygelier, Moore, Demeyere and Gillebert2020). Diagnosis based on the frequentist normative 5th and 95th percentiles (A) and the posterior odds assuming a neglect prevalence of 50% (B), 30% (C), and 70% (D). Bayes Factors were calculated with the contingency table test of the BayesFactor package in R.

Note that we assumed a neglect prevalence of 50% and thus prior odds equal to 1. While this assumption may not be realistic, it clearly illustrates the difference between the traditional and Bayesian diagnostic approach when the diagnosis entirely relies on the observed test scores. Depending on the prevalence of hemispatial neglect the picture will change. For instance, with a prevalence of 30%, 19% of patients were classified as having neglect and 62% were classified as not having neglect (Figure 3C). In contrast, with a prevalence of 70%, 28% of stroke patients were classified as having neglect, 7% as not having neglect, and there was uncertainty about the diagnosis for the remaining 65% (Figure 3D). Note that this illustration assumes a known base rate prevalence, but in reality it is advised to use a distribution of probable prevalence values as described in Crawford, Garthwaite, & Betkowska (Reference Crawford, Garthwaite and Betkowska2009).
-
2. The Bayesian approach can indicate that both hypotheses are equally likely given the data
A major advantage of the Bayesian approach is that the posterior odds can indicate that it is equally likely that the patient has the COI or does not have the COI given the patient’s test score (posterior odds ≈ 1). In clinical decision-making, it is indeed better to withhold from drawing firm conclusions than to draw potentially erroneous conclusions. Although this may appear overly conservative, it is imperative for neuropsychologists to be cautious in certain situations such as when providing advice on the presence or absence of cognitive impairments in the context of legal insurance matters, when differentiating true from feigned cognitive impairments (see for instance Lee et al., Reference Lee, Lodewyckx, Wagenmakers, Raaijmakers, Goldstone, Nosofsky and Steyvers2015) or when advising rehabilitation/care needs of patients. More importantly, the Bayesian method does not increase the uncertainty, but reveals the uncertainty that is inherent in the test scores. Indeed, in the empirical example above (Figure 3), the Bayesian approach revealed that it was unclear for many patients whether they had or did not have neglect, while for many of those patients the traditional approach made it tempting to conclude that these patients did not have neglect.
-
3. Balancing efficiency and accuracy of diagnostic testing works well in the Bayesian framework
Another scenario in which Bayesian diagnostic hypothesis testing offers opportunities is the use of screening tools. It is common practice in clinical neuropsychology to first perform a general screening for cognitive impairments and to then zoom in on the candidate-impaired cognitive functions per patient or to zoom in on those patients with potential cognitive impairments using more refined assessment tools. This approach optimizes the investment of limited resources such as the time it takes to administer tests and interpret results. Screening tools are a recommended practice in several clinical guidelines (Eskes et al., Reference Eskes, Lanctôt, Herrmann, Lindsay, Bayley and Bouvier2015; Intercollegiate Stroke Working Party, 2016; National Stroke Foundation, 2010). Moreover, it seems intuitive to first separate the wheat from the chaff before collecting more data to achieve higher precision (Schönbrodt et al., Reference Schönbrodt, Wagenmakers, Zehetleitner and Perugini2017).
Deciding who or which cognitive domain to assess conditional on screening results, resembles the approach of deciding whether to conduct a full-powered study conditional on results of an under-powered pilot study (i.e., conditional testing). Research has shown that conditional testing is not a good idea, as the under-powered pilot study is associated with high false-positive and false-negative rates. This leads to biased estimates of effect sizes which can eventually lead to an under-powered final study (Albers & Lakens, Reference Albers and Lakens2018; Westlund & Stuart, Reference Westlund and Stuart2016).
Conditional testing (i.e., screening) can also be a problem for diagnosis. Imagine a scenario in which a diagnostician uses a cancelation task with 50 targets to screen for hemispatial neglect. The first diagnostician decides to only test patients with an elaborate neglect test when patients show hemispatial neglect on the screen. In this scenario, false-negative rates inflate as the screen is insufficiently sensitive to pick up small to moderate spatial biases (Figure 4, scenario 1). In contrast, consider a second diagnostician who decides to only test patients with an elaborate neglect test when there is no evidence for hemispatial neglect on the screen. In this second scenario, false-negative rates are reduced (Figure 4B, scenario 2), but false-positive rates increase as a result of multiple testing (Figure 4A, scenario 2). Consider now a third diagnostician who uses Bayesian hypothesis testing to quantify the strength of evidence in favor or against the hypothesis that the patient has hemispatial neglect. The third diagnostician only tests patients further if the screen was inconclusive. In this third scenario, false-negative and false-positive rates are lower than in the two other scenarios (Figure 4, scenario 3). See Appendix D for details of the calculations.
False-positive and false-negative rates for conditional testing with three different screening scenarios for different spatial biases. The horizontal line is located at 5% which is often used as the maximal error rate that is deemed acceptable in diagnosis.

An alternative approach to conditional testing is sequential and adaptive testing. That is, rather than administering a fixed number of test items of a test battery (i.e., fixed n-design) and comparing patient’s test scores to normative criteria afterward, we could also administer test items and continuously compare patient’s test scores to normative criteria until we have administered sufficient test items to clarify that the patient has or does not have a COI. Sequential testing may not be feasible to assess all cognitive functions (e.g., memory assessed with list learning), but can contribute to more efficient assessment of many cognitive functions (e.g., attention, inhibitory control, language). In addition, we can adapt test items to individual patients to quickly use the most informative test items (Bilder & Reise, Reference Bilder and Reise2019; Myung et al., Reference Myung, Cavagnaro and Pitt2013).
Sequential testing methods have been developed for research where one desires to reduce the number of participants required to test a hypothesis. In this context, sequential testing has been shown to be more efficient than fixed-n designs in the frequentist and in the Bayesian framework (Lakens, Reference Lakens2014; Schönbrodt et al., Reference Schönbrodt, Wagenmakers, Zehetleitner and Perugini2017). However, to control false-positive rates when using sequential testing in the frequentist approach, one must plan the number of interim analyses and it is not allowed to continue data collection once the final planned test has been conducted (Schönbrodt et al., Reference Schönbrodt, Wagenmakers, Zehetleitner and Perugini2017). Here again, the Bayesian framework may provide a solid foundation as evidence updating is a fundamental characteristic of the Bayesian method and optional stopping rules are less of an issue (Etz et al., Reference Etz, Gronau, Dablander, Edelsbrunner and Baribault2018). The increased flexibility of the Bayesian framework for sequential testing may be especially important for neuropsychological assessment as patients can fail to complete a full test due to lack of motivation or as a result of fatigue.
Imagine a diagnostician who has 12 parallel versions of the cancelation task, each consisting of 50 targets in total (25 on the left, 25 on the right side). After each cancelation task, he sums up all the information and evaluates whether the data provide evidence to diagnose neglect. Once the diagnosis is clear, he stops collecting data. The first diagnostician uses the frequentist framework and determines decision thresholds for each interim analysis that control the overall false-positive rate. The second diagnostician uses the Bayesian framework and does not need to plan his analyses in advance. Consider now a first scenario in which all patients complete all tests that are required to obtain a clear diagnosis or until a maximum of 12 tests was administered (Figure 5). In this scenario, both diagnosticians are able to diagnose neglect for patients with small to severe spatial biases at similar rates (Figure 5, black lines). However, consider now a second scenario in which some patients suddenly ask to discontinue data collection (Figure 5, gray lines). In this second scenario, the diagnostician who used the Bayesian framework is more successful in diagnosing neglect than the diagnostician who used the frequentist framework. This scenario clearly illustrates the advantages of Bayesian sequential testing for neuropsychological assessment (see Appendix E for details).
Percentage of patients diagnosed with neglect as a function of the severity of the spatial bias and different sequential testing scenarios. Note that false-positives (size of spatial bias = 0) are below 5% for all scenarios. The early termination has more impact for the frequentist than Bayesian method on the ability of the diagnostician to diagnose neglect for patients with a spatial bias.

Part III. Bayesian estimation in neuropsychological assessment
The Bayesian framework provides elegant methods for hypothesis testing, but also for parameter estimation. A major advantage of Bayesian estimation is the fact that interval estimates directly reflect what we aim to know as a diagnostician. In addition, Bayesian estimation methods are easily applied to custom models.
-
1. Bayesian interval estimates are easy to interpret
In addition to making dichotomous decisions about the presence or absence of a COI, clinical neuropsychologists use interval estimates to represent the uncertainty about the observed test scores of patients. One typically construes such an interval estimate by calculating the standard error of measurement based on the standard deviation of the test scores (Sx) and the reliability of the test (rxx) and adding or subtracting the standard error from the observed test score (Crawford, Reference Crawford, Goldstein and McNeil2003; Jones, Reference Jones1991). One may also correct the observed test score for the test’s reliability (Crawford, Reference Crawford, Goldstein and McNeil2003; Jones, Reference Jones1991). To obtain a 95% confidence interval, one can multiply the standard error with the z-score 1.96 (Equation 4).
 $$Test\,score \pm 1.96\,\,{S_x}\,\sqrt {1 - \;{r_{xx}}} \;$$
This approach of constructing an interval estimate is rooted in the frequentist approach. However, frequentist confidence intervals (CI) are notorious as they are commonly misinterpreted. One of the more common misinterpretations is the idea that a 95% CI clarifies that we can be 95% certain that the true parameter lies within the interval (Morey et al., Reference Morey, Hoekstra, Rouder, Lee and Wagenmakers2016). This interpretation is inaccurate because the 95% refers to the procedure through which the interval is calculated rather than the interval itself. That is, using the frequentist CI procedure, 95% of the intervals will contain the true parameter value. Given the widespread misinterpretation of the CI, Bayesian credible intervals can be considered superior (Morey et al., Reference Morey, Hoekstra, Rouder, Lee and Wagenmakers2016). Here, a 95% credible interval effectively summarizes the 95% most probable values for a specific parameter. Thus, Bayesian intervals are easier to interpret than frequentist intervals and actually represent the 95% most probable test scores for a patient in a diagnostic context.
-
2. Bayesian estimation methods can be easily applied to custom models
A last, important advantage of the Bayesian framework is the fact that Bayesian estimation methods are easily customized to specific types of data (Kruschke, Reference Kruschke2010). The latter implies that we can design and fit custom models that formalize our theories of the cognitive functions that underlie test scores. The approach of custom cognitive models can reveal more in-depth insight in cognitive impairments than simple outcome measures of neuropsychological tests. For instance, Grant et al. (Reference Grant, Hickock and Fridriksson2018) developed a model for picture naming that can distinguish between several processes such as the retrieval of correct lexical-semantic information, lexical-phonological information, and correct phonemes. A cognitive model of memory recall and recognition has also proven to be clinically valuable (Shankle et al., Reference Shankle, Pooley, Steyvers, Hara, Mangrola, Reisberg and Lee2013). That is, through modeling performance on a list learning task (Alexander et al., Reference Alexander, Satalich, Shankle and Batchelder2016; Lee et al., Reference Lee, Abramyan and Shankle2016; Pooley et al., Reference Pooley, Lee and Shankle2011), researchers were able to differentiate between patients with different levels of subjective memory complaints who could not be differentiated using traditional measures of performance (Shankle et al., Reference Shankle, Pooley, Steyvers, Hara, Mangrola, Reisberg and Lee2013). Custom cognitive models can also be designed for other neuropsychological tasks, such as for the Iowa gambling task (Haines et al., Reference Haines, Vassileva and Ahn2018), but also for experimental paradigms used in the context of autism research (Voorspoels et al., Reference Voorspoels, Rutten, Bartlema, Tuerlinckx and Vanpaemel2018) and to separate out several attention processes (Habekost, Reference Habekost2015).
Another study showed that the use of Bayesian models that represent variability in performance from trial to trial on the Stroop and Flanker task improved estimates of individual differences on these tasks, which in turn led to higher test-retest reliability than what is achieved with traditional methods (Rouder & Haaf, Reference Rouder and Haaf2019). Cognitive models of neuropsychological tests may thus provide deeper insight into the cognitive functions underlying test scores and may reveal more information about patient’s test behavior than what we can now infer from simple measures like accuracy. As Bayesian estimation is more easily applied to custom models, Bayesian methods form a solid foundation for cognitive psychometrics and thus for clinical neuropsychology.
Conclusions
In this review we argued that the Bayesian framework offers a solid foundation for neuropsychological assessment. The Bayesian framework provides elegant ways to estimate the probability that a patient has a certain COI given an observed test score. It can be readily applied to sequential and adaptive diagnostic testing. Last, it provides intuitively interpretable interval estimates and is easily applied for estimation of custom cognitive models. We recommend that test developers embrace and offer Bayesian tools to clinical neuropsychologists that will help them to more accurately interpret patient’s test scores. In addition, in order to make firm clinical recommendations and change clinical practice, it is paramount that future psychometric research empirically demonstrates the contribution of Bayesian methods to the accuracy of clinical decision-making.
Supplementary material
To view supplementary material for this article, please visit https://doi.org/10.1017/S1355617721001120
Acknowledgments
We would like to thank professor Dr. Nele Demeyere for giving us access to the dataset of 651 stroke patients who completed the cancelation task of the Oxford Cognitive Screen.
Financial Support
This work was funded by a research grant of the Flemish Fund for Scientific Research (FWO) awarded to H.H. (1171717N, 1171719N), C.R.G. (G072517N, G0H7718N) and Pieter Moors was supported by a postdoctoral fellowship of the FWO (12X8218N).
Conflict of interest
The authors have no conflict of interest to disclose.