INTRODUCTION
In spite of coverage in numerous papers in recent decades, radiocarbon (14C) dating of soil organic matter (SOM) remains a difficult task. SOM consists of an inherently complex mixture of substances from different sources as fresh organic tissues, degraded material, and old biologically refractory organic components (Lehmann and Kleber Reference Lehmann and Kleber2015). These materials have different 14C contents that may either correspond to the present atmospheric 14C, have partially lost its initial 14C by radioactive decay, or be largely depleted in the case of old inert organic materials. Due to the intrinsic heterogeneity of SOM, 14C ages have often been inconsistent with the stratigraphic sequence (Wang et al. Reference Wang, Amundson and Trumbore1996; Schmidt et al. Reference Schmidt, Zöller and Hambach2015). Possible causes of heterogeneity in the 14C activity of SOM fractions include bioturbation, leaching, incorporation of carbonates or deposition of windblown particles containing allochtonous C (Olsson Reference Olsson1974; Fowler et al. Reference Fowler, Gillespie and Hedges1986; Martin and Johnson Reference Martin and Johnson1995; Blyth et al. Reference Blyth, Hua, Smith, Frisia, Borsato and Hellstrom2017; Liu et al. Reference Liu, Zhao, Sun, Yang, Chen, Yang, Zeng and Zeng2017).
In an attempt to tackle these inconsistencies, SOM has traditionally been partitioned into fulvic acid, humic acid and humin fractions, which are defined by their solubilities in alkaline and acid solutions. Numerous studies found that fulvic acids provide younger 14C ages than humic acids, whereas humic acids are younger than humin (e.g in Perrin et al. Reference Perrin, Willis and Hodge1964; Balesdent Reference Balesdent1987; Becker-Heidmann et al. Reference Becker-Heidmann, Liang-wu and Scharpenseel1988; Pessenda et al. Reference Pessenda, Gouveia and Aravena2001; Cherkinsky and Wallace Reference Cherkinsky and Wallace2017; Reuther et al. Reference Reuther, Cherkinsky and Coffman2017). On the other hand, Tonneijck et al. (2006) demonstrated that humic acids from Andosols are immobilized and occluded by chemisorption reactions and aggregation, giving rise to older ages than humin, which contain more root derivatives which are relatively young. Martin and Johnson (Reference Martin and Johnson1995) found that there were no consistently older or younger 14C age relationships between total SOM (bulk SOM), humic and humin fractions in late Pleistocene loess deposits. The causes of these divergent results are not completely understood, but several studies point to the effects of the soil type-specific physico-chemical environment, which determines weathering and microbial degradation pathways (Balesdent Reference Balesdent1987; Balesdent et al. Reference Trumbore2000; Trumbore et al Reference Balesdent, Chenu and Balabane2009; Lehmann and Kleber Reference Lehmann and Kleber2015). Such decay processes have a strong effect on the composition of the SOM (Suárez-Abelenda et al. Reference Suárez-Abelenda, Buurman, Camps Arbestain, Kaal, Martinez-Cortizas, Gartzia-Bengoetxea and Macías2011; Wang et al. Reference Wang, Helgason, Westbrook and Bedard-Haughn2016), particularly in the clay-size fraction where degraded and recalcitrant SOM prevail, whereas the sand fraction has larger proportions of fresh (particulate) organic remains (Baldock et al. Reference Baldock, Oades, Waters, Peng, Vassallo and Wilson1992; Kögel-Knabner Reference Kögel-Knabner2000). For example, Gilet-Blein et al. (Reference Gilet-Blein, Marien and Evin1980) found that the 14C age of the humin fraction was older than the humic acid fraction in acidic soils, but younger in alkaline soils.
A large part of the research on 14C dating of different SOM fractions was undertaken to identify the “oldest” fraction, representative of the beginning of soil formation of a buried layer in a sedimentary sequence (Scharpenseel and Becker-Heidmann Reference Scharpenseel and Becker-Heidmann1992; Pessenda et al. Reference Pessenda, Gouveia and Aravena2001). In these cases, the oldest date, and therefore the oldest SOM fraction, is thought to be the most informative; the assumption here being that the younger ages of other SOM fractions are due to rejuvenation by roots, rootlets, low molecular weight mobile constituents (including root exudates), etc. (Wang et al. Reference Wang, Amundson and Trumbore1996; Puy et al. Reference Puy, Balbo and Bubenzer2016). However, in cumulative sequences where soils are formed in material developed elsewhere (upslope or upstream), the oldest date will probably not reflect the soil formation after deposition because it includes older SOM from the pre-erosion soil formation cycle instead, i.e. before redeposition. This applies also to samples from archaeological sites. In archaeological dating exercises we are not seeking the oldest age of a soil or sediment layer, but rather the age that corresponds to the human activity involved. It is thus evident that the assessment of 14C ages requires a good comprehension of the local conditions controlling SOM dynamics, such as the parent material, pH, and fire regime. In NW Spain, 14C dating of bulk and alkaline extracted fractions of buried soils under terrace fills has been used to obtain archaeologically consistent dates for the construction of ancient agrarian terraces (e.g. Ballesteros Arias et al. Reference Ballesteros Arias, Criado-Boado and Andrade Cernadas2006; Puy and Balbo Reference Puy and Balbo2013; Ferro-Vázquez et al. Reference Ferro-Vázquez, Martínez-Cortizas, Nóvoa-Muñoz, Ballesteros-Arias and Criado-Boado2014; Quirós-Castillo Reference Quirós-Castillo2014).
It is crucial to stress that even if a date does not fit with an archaeologist’s expectations, this does not imply that it is “wrong” (Fowler et al. Reference Fowler, Gillespie and Hedges1986): the calculated age will usually be analytically correct. It would rather mean that the chosen sample or fraction is not representative for the event or period of activity in question. In order to reduce uncertainty, the dated sample and the extraction procedure must meet the following requirements: first, that burial has indeed produced the isolation of the soil layer from posterior organic matter additions, including illuviation and percolation processes, to such an extent that the average 14C age is not or barely affected. Second, that the disturbance of the A horizon during or after burial (by, for example mixing or bioturbation processes) is limited, and lastly, that the extraction process effectively prevents older organic matter from being analyzed together with the target fraction (Gilet-Blein et al. Reference Gilet-Blein, Marien and Evin1980; Matthews Reference Matthews1980; Geyh et al. Reference Geyh, Roeschmann, Wijmstra and Middeldorp1983; Hetier et al. Reference Hetier, Guillet, Brousse, Delibrajs and Maury1983; Martin and Johnson Reference Martin and Johnson1995; Pessenda et al. Reference Pessenda, Gouveia and Aravena2001; Puy et al. Reference Puy, Balbo and Bubenzer2016). Selecting a fraction that gives the most reliable 14C age on the basis of the expectations of the researcher may be a source of bias to the interpretation (Fowler et al. Reference Fowler, Gillespie and Hedges1986), but, on the other hand, a thorough assessment of archaeological features may also help to reject unlikely ages.
Here we combine 14C analysis of three fractions (bulk, NaOH soluble and -insoluble SOM) of samples from archaeological settlements from different periods and spread throughout Galicia (NW Spain). The dated extracted and residual fractions were analyzed by analytical pyrolysis (Py-GC-MS) and thermally assisted hydrolysis and methylation (THM-GC-MS), to characterize the macromolecular materials that compose each fraction. These molecular fingerprints are used as input data in Partial Least Squares models for age and age differences between fractions of the same sample, in an attempt to unravel the relationship between SOM composition and age. Then, in the light of archaeological context of each sample, we aim to understand the processes behind the composition of the fractions that deliver 14C ages that are most consistent with the targeted archaeological event and elucidate the processes leading to the discrepancies between the different fractions.
METHODS
Archaeological Sites and Sample Selection
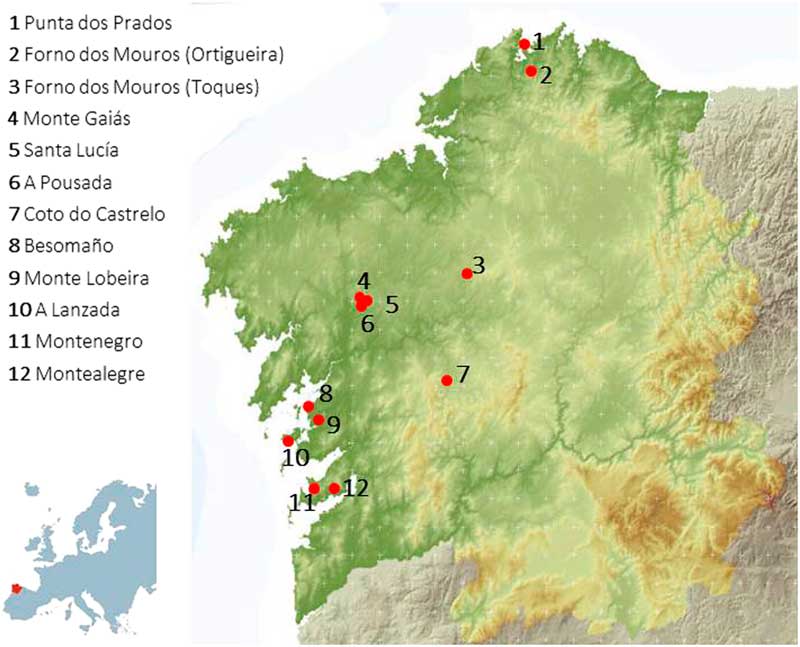
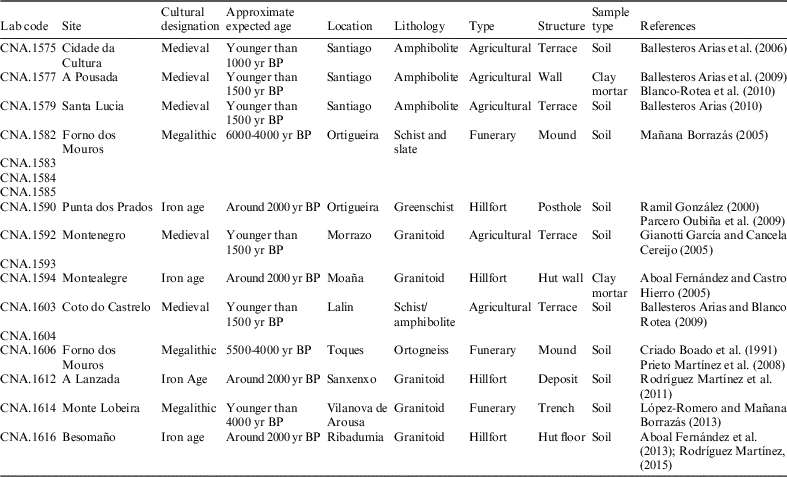
The locations and archaeological context of the 17 samples analyzed are provided in Figure 1 and Table 1. Galicia is located in the NW of the Iberian Peninsula, and its climate is mainly mild and humid: the sites are located within the “temperate with dry and temperate summer” (Csb) climate area, according to the Köppen classification (Chazarra et al. Reference Chazarra, Mestre and Pires2011). Lithological setting for each site has been assigned according to the online GEODE cartography from the Spanish Geological Survey (GEODE-IGME).
Map showing the geographic location of the archaeological sites.

Sample locations, laboratory codes, and archaeological and lithological settings. Approximate expected ages are in relation to archaeological evidence and other 14C dates from the same sites.

Sample Preparation and Radiocarbon Dating
Pretreatment
Samples were dispersed in ultrapure water for 16 hr and wet sieved through a <50 µm mesh, thereby eliminating sand- and gravel-sized minerals and macroscopic organic remains such as rootlets. The C and N contents were measured on the <50 µm samples before and after extraction using a LECO Truspec CHN elemental analyzer with an accuracy of 0.05‰ and precision of 0.5% for C content, and 0.08‰ and 0.05% for N, respectively.
Extractions
Sieved (<50 µm) samples were chemically fractionated using the standard acid–alkali–acid procedure for 14C samples. Prior to extraction, carbonates were removed by digestion with 1M HCl at 75°C for 12 h, followed by washing with ultrapure water until pH>5 and centrifugation (3000 rpm, 10 min). The fraction that remained after this acid digestion was air dried at 50°C and is referred to as SOMBULK.
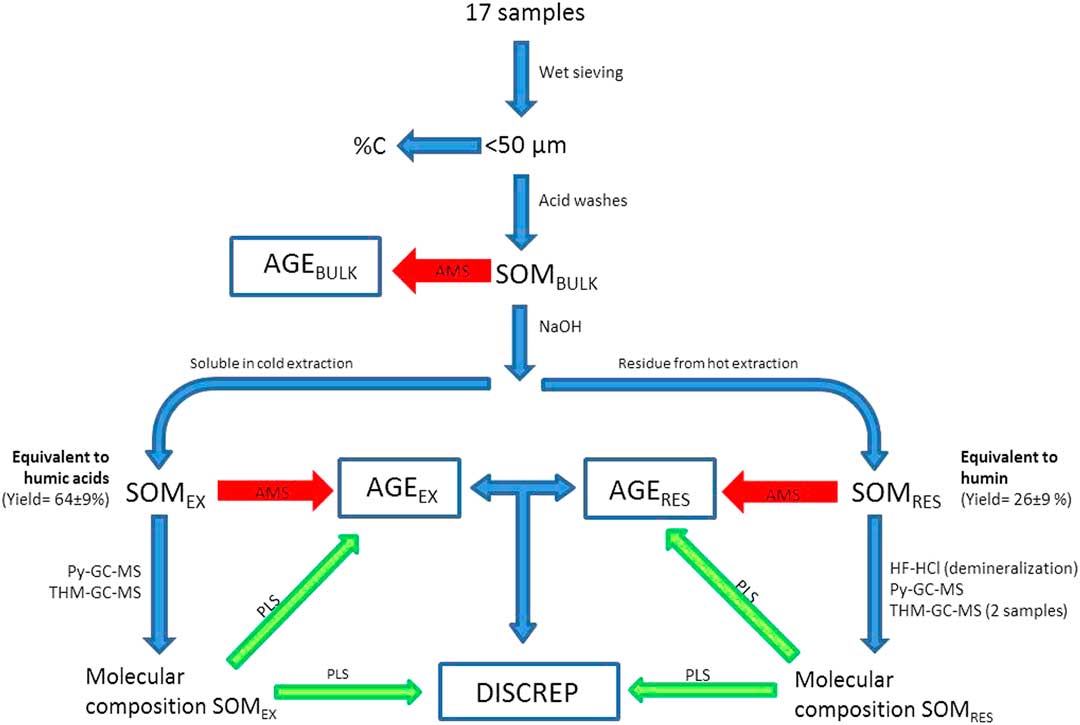
After homogenization, subsamples of 2 g of SOMBULK were used for the isolation of alkali soluble and alkali insoluble fractions following two protocols (Figure 2):
1. Hot extraction. After the elimination of carbonates as described above, the soil was extracted with 0.5M NaOH (30 min, 75°C). Typically, the solution turns dark due to the presence of humic and fulvic acids. Samples were centrifuged (4000 rpm, 10 min) and the process repeated until the solution was clear. The supernatant was discarded and the solid residue was demineralized by 3–5 times mild 2% HF treatment followed by washing of the residue using several ultrapure water-resuspension-centrifugation-decantation steps until pH exceeded 5. This treatment eliminates most of the reactive minerals that interfere with pyrolytic reactions (Zegouagh et al. Reference Zegouagh, Derenne, Dignac, Baruiso, Mariotti and Largeau2004). Residues obtained in this way were air dried (50°C) and are called SOMRES, which is considered representative of humin.
2. Cold extraction. After elimination of carbonates, the soil was repeatedly extracted with 0.5M NaOH (30 min, room temperature), until the supernatant was colorless. After centrifugation at 3000 rpm for 20 min the extracts from the successive extraction steps were combined and acidified with 1M HCl to pH=1 to precipitate humic acid. The supernatant was discarded and the precipitate was freeze-dried after repeatedly washing it to pH>5 with ultrapure water. The obtained organic matter (SOMEX) is considered representative of the humic acid fraction.
Diagram showing the extraction, analysis and data evaluation protocol.

Because these protocols were not only applied to soil but also two mortar samples, it is noted that these mortars are made using clay as a binder, not lime. Lime mortars would require different pretreatment and extraction methods (Heinemeier et al. Reference Heinemeier, Ringbom, Lindroos and Sveinbjörnsdóttir2010; Hajdas et al. Reference Hajdas, Trumm, Bonani, Biechele, Maurer and Wacker2012; Marzaioli et al. Reference Marzaioli, Nonni, Passariello, Capano, Ricci, Lubritto, De Cesare, Eramo, Castillo and Terrasi2013).
Extraction yields were estimated by measuring C contents by elemental analysis of soil material before and after extraction.
AMS Radiocarbon Dating
The AMS measurements were performed at Centro Nacional de Aceleradores (CNA) in Seville (Spain). Samples were graphitized using an AGE system that couples an elemental analyzer (for combustion) to the graphitization line (Wacker et al. Reference Wacker, Němec and Bourquin2010b). The amount of sample necessary to obtain ca. 1 mg of carbon is wrapped in tin foils and combusted in the elemental analyzer and the gas resulting from the combustion is trapped in a chromatographic column (Santos-Arévalo et al. Reference Santos Arévalo, Gómez Martínez and Agulló García2015). The reduction to graphite takes place in the presence of Fe and takes about 2 hr at 575°C. AMS measurements were done in two different facilities: SARA (Chamizo Calvo et al. Reference Chamizo Calvo, López-Gutiérrez, Ruiz-Gómez, Santos, García-León, Maden and Alfimov2008) which has been used until 2012, and Micadas (Wacker et al. Reference Wacker, Bonani, Friedrich, Hajdas, Kromer, Němec, Ruff, Suter, Synal and Vockenhuber2010a) afterwards. Comparative exercises have shown statistically similar results in both facilities (Santos Arévalo et al. Reference Santos Arévalo, Gómez Martínez and Agulló García2015). 14C ages were calculated using the NIST oxalic acid standard OxII, and corrected for isotopic fractionation using the simultaneously measured 13C/12C ratio (Stuiver and Polach Reference Stuiver and Polach1977). Typical background values correspond to ca. 45,000–50,000 yr, and modern samples can be measured to about 2–3‰ level (Santos-Arévalo et al. Reference Santos Arévalo, Gómez Martínez and Agulló García2015).
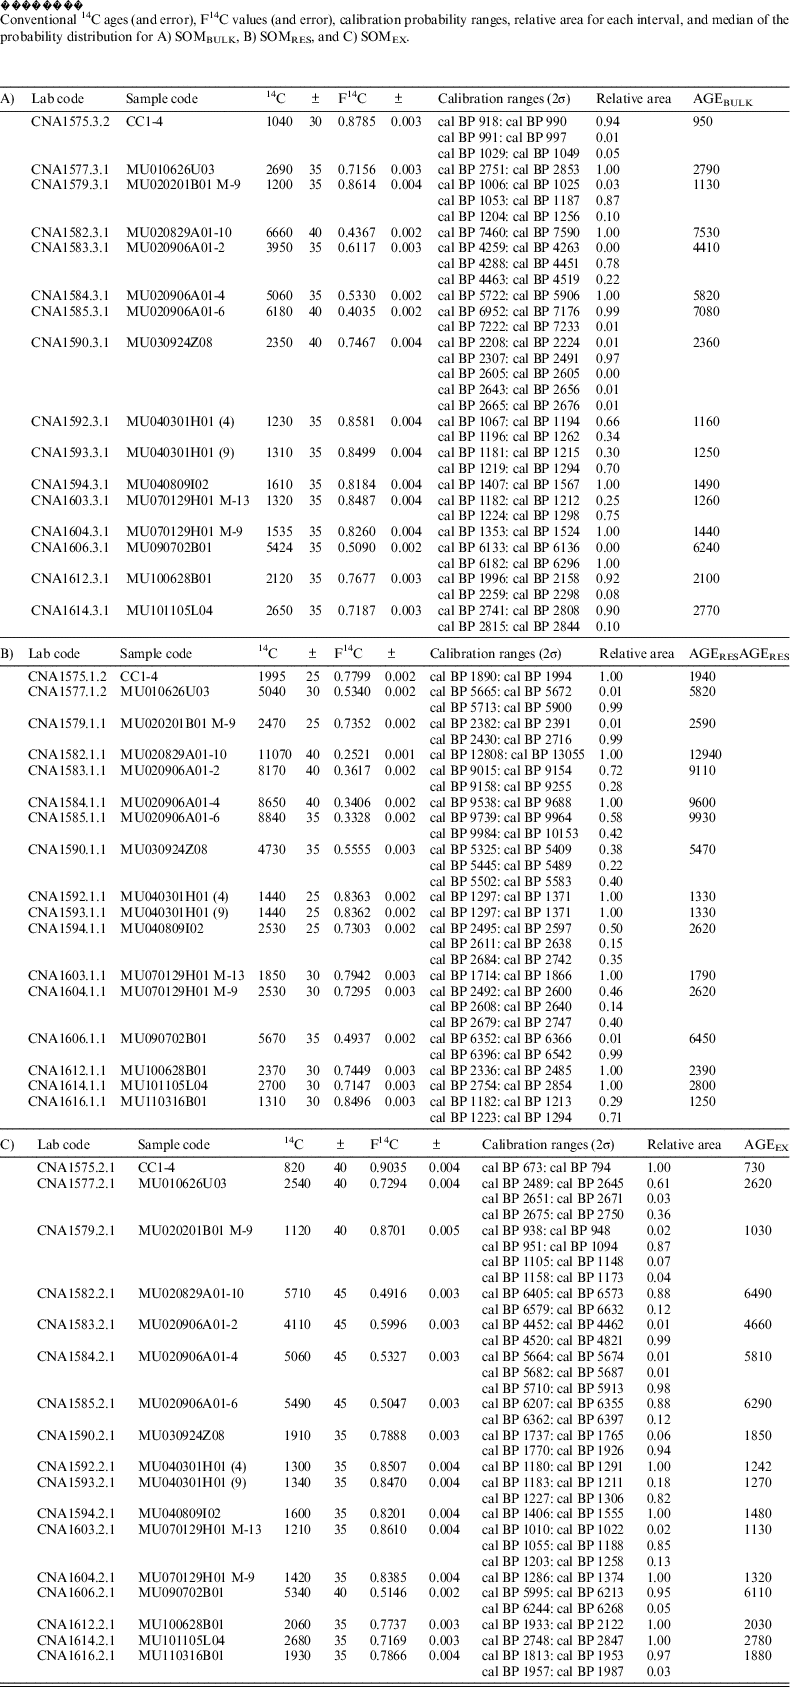
The 2σ calibrated ages for SOMBULK, SOMRES and SOMEX are given as median probability for the purposes of the multivariate statistical exercises (AGEBULK, AGERES and AGEEX, respectively), rounded up after Stuiver and Polach (Reference Stuiver and Polach1977). Following the recommendations on reporting of 14C activity levels from Reimer et al. (Reference Reimer, Brown and Reimer2004), conventional 14C ages, F14C values, calibrated age ranges and probabilities for each range are given in the Appendix. Calibrations were made using Calib 7.0.0, with the IntCal13 calibration curve (Stuiver and Reimer Reference Stuiver and Reimer1993; Reimer et al. Reference Reimer, Bard, Bayliss, Beck, Blackwell, Bronk Ramsey, Buck, Cheng, Edwards, Friedrich, Grootes, Guil- derson, Haflidason, Hajdas, Hatté, Heaton, Hoffmann, Hogg, Hughen, Kaiser, Kromer, Manning, Niu, Reimer, Richards, Scott, Southon, Staff, Turney and van der Plicht2013). AGEBULK, AGERES and AGEEX have a strong linear correlation with F14CBULK, F14CRES and F14CEX respectively (r2>0.9 in all three cases, p<0.001).
The discrepancy in F14C between SOMRES and SOMEX fractions, DISCREP(F14C) is calculated using equation 1 and reported as a percentage:
 $$DISCREP\left( {F^{{14}} C} \right)=100\,{\times}{{F^{{14}} C_{{RES}} {\minus}F^{{14}} C_{{EX}} } \over {F^{{14}} C_{{EX}} }}$$
The discrepancy between AGEEX and AGERES (DISCREP) has been calculated, using:
 $$DISCREP=100\,{\times}{{AGE_{{RES}} {\minus}AGE_{{EX}} } \over {AGE_{{EX}} }}$$
The resulting values are included in Table 2. DISCREP(F14C) and DISCREP are only weakly correlated (r2=0.35, p<0.05) because F14C is a direct measure of the 14C activity of the sample, which results from the atmospheric 14C and that has not been constant through time, while DISCREP is calculated using calibrated values.
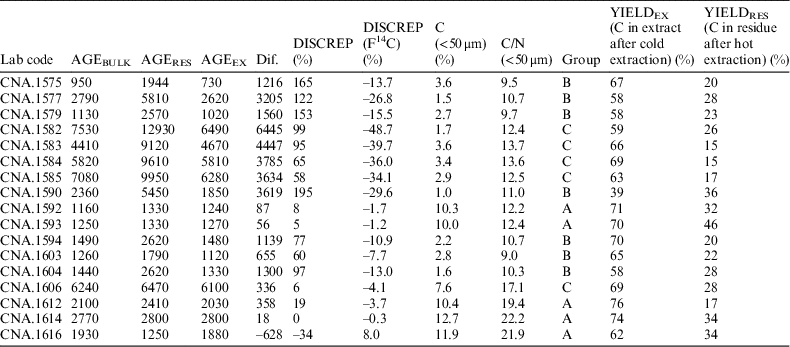
Sample codes, median age of the probability distribution of bulk, residual and extracted fractions (AGEBULK, AGERES, AGEEX), difference between AGERES and AGEEX in years (Dif.), age discrepancy (according to equation 1), F14C discrepancy (according to equation 2), elemental composition (% C and C/N [wt/wt] ratio), sample clusters based on the relation of AGEBULK and C content (Group, see text) and yields for the extractable and residual fraction (as % of total SOM).

Molecular Composition
Conventional Analytical Pyrolysis (Py-GC-MS)
Approximately 1 mg of sample was inserted into quartz tubes with quartz wool at both ends. Pyrolysis was performed with a CDS Pyroprobe 5250 for 20 s at 750°C (10°C/ms heating rate). The pyrolysis products were separated on a 6890N gas chromatograph (Agilent Technologies) under He flow (1 mL/min), using a HP-5MS polysiloxane-based column (temperature program 50–325°C at 20°C/min), and identified using an Agilent 5975 mass selective detector operating in 70 eV electron impact mode (m/z 50–500). The relative proportions of each pyrolysis product were calculated as the percentage of the sum of all peak areas (% of total quantified peak area, % TQPA). Replicate analyses were performed for the extracts only. Average values of the replicates were used to calculate coefficients of determination (r2) and for evaluation by means of multivariate statistics.
Thermally Assisted Hydrolysis and Methylation (THM-GC-MS)
The THM-GC-MS analyses were performed under the same conditions as for Py-GC-MS, but with prior addition of an aliquot of tetramethylammonium hydroxide (TMAH, 25% in water, Sigma Aldrich), and a pyrolysis set point temperature of 600°C instead of 750°C (Challinor Reference Challinor2001). The SOMEX fractions of all samples were analyzed but only two of the SOMRES samples were analyzed due to the poor signal obtained.
Data Evaluation
The data were evaluated using ANOVA (SPSS 24) for identification of differences in a continuous variable in relation to the values of an independent discrete variable. Correlations are presented in the text as r2, and significance reported as p values. Partial Least Squares Regression (PLS-R) was done using the PLS package of R statistical environment R3.2.1 (R Core Team 2014) to generate models that explain the relationship between molecular composition and age, and between molecular composition and the discrepancy between fractions (DISCREP) for both SOMEX and SOMRES. Further details on this technique can be found in (Abdi Reference Abdi2010). Given the strong correlation between calibrated ages and F14C values of each fraction (r2>0.9, p<0.001), the models built for AGERES and AGEEX are also valid for F14CRES and F14CEX. On the contrary, the models built targeting DISCREP cannot be extrapolated to DISCREP(F14C) because they do not covariate.
RESULTS AND DISCUSSION
Radiocarbon Data, Extraction Yields, and Age Discrepancy
The ages obtained for SOMBULK and SOMEX were similar (r2=0.98, p<0.001, Table 2) with a difference of only 6% (average)±15% (SD). The medians of the calibration intervals for the residues and the extracts are correlated (r2=0.82, p<0.001), AGERES being 70±65% older than AGEEX (ANOVA significance p<0.001). DISCREP is not correlated to the age of any of the fractions.
The estimated yields show that SOMEX corresponds to 63±9% of the SOM (measured as C %) of the samples, whereas SOMRES accounts for 26±9% of the SOM (Table 2). Hence, SOMEX represents a larger proportion of the SOM than SOMRES, which is in agreement with the fact that AGEEX is more similar to AGEBULK than is AGERES (Table 2).
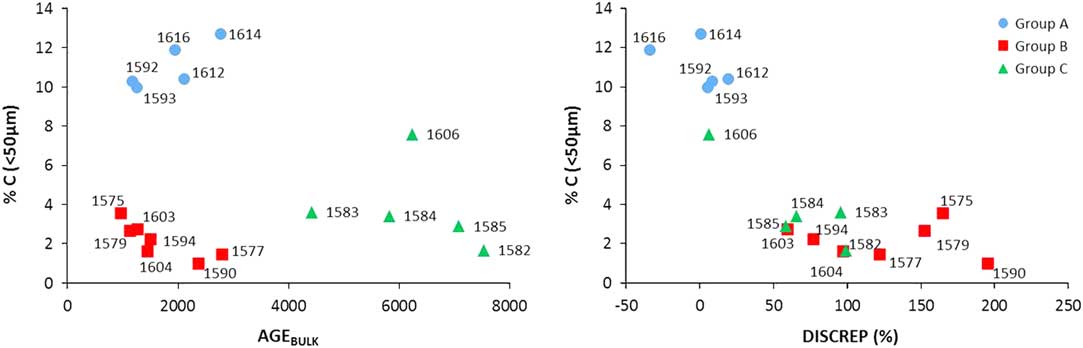
If age (AGEBULK, for illustration) is plotted against SOM content, the samples group in three clusters (Figure 3a). The relatively young samples (<4000 cal BP) split in two groups, one with high C content (10–15%; Group A) and one with low C content (<4%; Group B). The relatively old samples (>4000 cal BP) have low C content as well (2–8%; Group C). There is a clear negative correlation (r2=0.68; p<0.001) between SOM content and the discrepancy between fractions (DISCREP, Figure 3b), and DISCREP is significantly different (p<0.001) for the samples of Group A (0±20%), Group B (124±49%) and Group C (65±37%). SOM content is negatively affected by the intensity of mineralization, which is reflected by a positive correlation between %C and C/N (r2=0.64, p<0.005). The negative correlations between DISCREP and %C (r2=0.68, p<0.001) and DISCREP and C/N (r2=0.50, p<0.001) indicate that SOM degradation degree may affect DISCREP values. Indeed, the C/N ratio is higher (p<0.001) for samples from Group A (18±5) than Group B (10±1) and Group C (14±2) (Table 2). This suggests that differences in SOM content between samples of Group A and Group B (which have a similar age) are due to a better SOM preservation in Group A (from a different point of view, accelerated SOM decay in Group B samples). There are no correlations between DISCREP and the yields of SOMEX and SOMRES, and there are no significant differences for the SOMEX and SOMRES yields of the three clusters. The value of DISCREP is thus independent from the extractability of the samples (i.e. relative proportions of humic acid and humin).
Sample groups according to age and soil organic matter content: (A) calibrated age of bulk (<50 µm fraction) samples plotted against carbon content of the same bulk fraction; (B) the discrepancy between the calibrated age of the NaOH-soluble and -insoluble fractions (DISCREP, Eq. 1) plotted against carbon content of the bulk fraction.

Molecular Characterization of SOM Fractions
Pyrolysis-GC-MS
The SOMEX and SOMRES produced the same set of pyrolysis products (Supplementary Information 1), albeit in considerably different relative proportions. The monocyclic aromatic hydrocarbons (MAHs) are the most abundant group of compounds in both SOMEX (53.0±15.0% of TQPA) and SOMRES (58.0±5.9%). In both fractions, benzene and toluene dominate. In SOM admixtures, MAHs originate predominantly from degraded and microbial SOM (particularly toluene) and pyrogenic SOM (PySOM) from fire residues (particularly benzene; Buurman et al. Reference Buurman, Nierop, Pontevedra-Pombal and Martínez Cortizas2006; Kaal et al. Reference Kaal, Brodowski, Baldock, Nierop and Cortizas2008a; Buurman and Roscoe Reference Buurman and Roscoe2011).
Polycyclic aromatic hydrocarbons (PAHs) such as indenes, naphthalenes, and biphenyls, account for 2.5±1.0% of TQPA in SOMEX and 12.0±2.3% in SOMRES. Even though these compounds can be formed as secondary reaction products of non-pyrogenic SOM components (Saiz-Jimenez Reference Saiz-Jimenez1994), they are also known as typical PySOM products (González-Vila et al. Reference González-Vila, Tinoco, Almendros and Martin2001; Ross et al. Reference Ross, Junyapoon, Jones, Williams and Bartle2005; Rumpel et al. Reference Rumpel, González-Pérez, Bardoux, Largeau, Gonzalez-Vila and Valentin2007). The very high abundance of PAHs in the SOMRES fraction is an especially strong indication of a major proportion of PySOM.
Methylene chain compounds (MCC; n-alkanes, n-alkenes and n-alkanoic acids) account for 15.5±3.4% of TQPA in SOMRES. They are dominated by C10-C33 n-alkanes and C12-C31 n-alkenes (95±9% of total MCC). In Py-GC-MS fingerprints, the long chain n-alkanes (C27 and higher) often originate from vegetal epicuticular waxes whereas the shorter products originate from aliphatic biopolymers such as cutin, suberin, cutan and suberan (Nip et al. Reference Nip, Tegelaar, Brinkhuis, De Leeuw, Schenck and Holloway1986; Tegelaar et al. Reference Tegelaar, de Leeuw and Saiz-Jimenez1989; Kolattukudy Reference Kolattukudy2001). The variation in the proportion of MCC is much larger for SOMEX, i.e. 13.2±17.5% of TQPA, as most extracts have a low MCC proportion (n=12, 3.5±2.9% of TQPA) except a few samples that have very high proportions (samples from Group C, n=5, 22–58%). Contrary to SOMRES, in SOMEX the n-alkanoic acids (mostly C16 and C18 fatty acid), from free or esterified vegetal or bacterial fatty acids, are more abundant than n-alkanes and n-alkenes (56±20% of total MCC). Hence, SOMEX contains few aliphatic SOM structures with the exception of samples from Group C that are prolific of fatty acids, whereas SOMRES stores primarily aliphatic biopolymers.
Pyrolysis products with at least one nitrogen atom are more abundant in SOMEX (15.4±8.2%) than in SOMRES (8.0±2.2%). The majority of the N-compounds originate predominantly (e.g. pyrroles, pyridines and indoles) or exclusively (e.g. acetamide) from proteins and chitin (a microbial polysaccharide) from microbial SOM components (Van der Kaaden et al. Reference Van der Kaaden, Boon, De Leeuw, De Lange, Schuyl, Schulten and Bahr1984; Tsuge and Matsubara Reference Tsuge and Matsubara1985). In addition, benzonitriles and isoquinoline are products of N-containing groups in PySOM (Kaal et al. Reference Kaal, Martínez-Cortizas, Nierop and Buurman2008b). In the pyrolysates of SOMEX, the sum of N-containing products is negatively correlated to the C/N ratio of the bulk samples (r2=0.52, p<0.005). This negative correlation is also significant for all N-compounds individually except for benzonitrile, which has a weak positive correlation with C/N (r2=0.23, p<0.05). These results show that the pyrolysis fingerprints are coherent with the elemental composition, and suggest that microbial SOM is represented by the N-compounds except for benzonitrile, which is related to PySOM and therefore to a larger abundance of C-rich charcoal-derived SOM.
Products that can be traced to carbohydrate precursors such as acetic acid, furans and furaldehydes (Pouwels et al. Reference Pouwels, Eijkel and Boon1989) are concentrated in SOMEX (13.3±8.3%, against 2.1±1.3% in SOMRES). The lack of products of (intact) plant-derived polysaccharides such as pyrans or anhydrosugars suggests that the carbohydrate products should be attributed to degraded and microbial material (Schellekens et al. Reference Schellekens, Buurman and Pontevedra-Pombal2009), in addition perhaps to weakly charred polysaccharides in PySOM (Pastorova et al. Reference Pastorova, Botto, Arisz and Boon1994). Finally, phenolic compounds (phenol, alkylphenols and acetophenone) account for 2.6±1.2% in SOMEX and 4.4±2.1% in SOMRES. The phenols probably originate from strongly altered lignin and/or microbial products (Tsuge and Matsubara Reference Tsuge and Matsubara1985; Kracht Reference Kracht2001). Lignin markers from Py-GC-MS (guaiacols and syringols) were below the detection limit, but their unambiguous detection by THM-GC-MS (see below) suggests that the phenols are mostly pyrolytic alteration products of degraded lignin.
In summary, SOMEX is composed primarily of microbial SOM, whereas PySOM and aliphatic SOM are scarce (although clearly recognizable) with the exception of several samples with a significant fatty acid content. The pyrolysates of SOMRES, on the other hand, originate predominantly from aliphatic biopolymers and PySOM, whereas microbial SOM is a relatively small constituent. These results are in agreement with previous research that studied the molecular composition of NaOH-soluble and NaOH-insoluble SOM fractions (Verde et al. Reference Verde, Buurman, Martínez-Cortizas, Macías and Camps Arbestain2008; Suárez-Abelenda et al. Reference Suárez-Abelenda, Buurman, Camps Arbestain, Kaal, Martinez-Cortizas, Gartzia-Bengoetxea and Macías2011; Schellekens et al. Reference Schellekens, Almeida-Santos, Macedo, Buurman, Kuyper and Vidal-Torrado2017).
From ANOVA analysis, the SOMEX of Group B samples is enriched (p<0.05), relative to Group A and Group C, in the products of microbial SOM (polysaccharide products, N-compounds except benzonitrile). This implies that the relatively young samples with low SOM content and high DISCREP are enriched in microbial products in SOMEX. The SOMEX of samples in Group C is enriched in products of PySOM (benzene, PAHs, benzonitrile) and aliphatic SOM (detected as fatty acids). The large proportion of fatty acids in the oldest samples was not expected, as they tend to be less abundant in pyrolysates of “evolved” SOM due to degradation (Buurman et al. Reference Buurman, Nierop, Pontevedra-Pombal and Martínez Cortizas2006). We do not have a definite explanation for this observation, but we cannot exclude the possibility that these compounds had remained trapped in or bound to charcoal particles and thereby survived long-term storage. For the SOMRES fraction, the differences between the three clusters were less informative. Suffice it to mention that the SOMRES of Group B is enriched in pyrolysates of aliphatic biopolymers (represented by n-alkanes/n-alkenes), whereas samples in Group A are enriched in phenols, probably from lignin.
THM-GC-MS
Among the THM-GC-MS products of SOMEX, the C12-C32 fatty acid methyl esters (FAMEs) and C10-C30 ω-methoxy FAMEs are the most abundant group of compounds (45.3±17.2%, Supplementary Information 2). The ubiquitous C16 and C18 FAMEs are the most abundant (74±17% of total FAMEs). They probably originate from free or esterified fatty acids (similar to the fatty acids from Py-GC-MS) but cannot be related to a specific source. The long-chain FAMEs and ω-methoxy FAMEs are probably products of the aliphatic biopolymer suberin, which is abundant in vegetable bark and root materials (Kolattukudy Reference Kolattukudy2001). The compounds identified as N-containing products (23.8±11.8%) are probably related to microbial sources (Chiavari and Galletti Reference Chiavari and Galletti1992), even though a PySOM contribution to some of the unidentified products (e.g. compound N8; Supplementary Information 2) cannot be ruled out. There are no significant correlations between the relative proportions of the N-containing THM products and the C/N ratio of the bulk sample.
The benzene carboxylic acids (BCA, detected as methyl esters) account for 16.4±8.9% of TQPA. The BCAs are major products of degraded polyphenolic materials such as lignin. Furthermore, oxidized PySOM produces BCAs upon THM (Kaal et al. Reference Kaal, Brodowski, Baldock, Nierop and Cortizas2008a), especially BCA with more than two carboxylic groups (Kaal and Filley Reference Kaal and Filley2016). The only PAH that was quantified is naphthalene (0.4±0.3%) and probably originates from PySOM.
The products of plant-derived polyphenolic SOM account for 7.4±4.1%. The polyphenolic products include traces of the methylated product of ferulic acid (compound PP12; Supplementary Information 2) and larger proportions of mono-, di- and trimethoxybenzoic acid methyl esters (PP6, PP9 and PP11) which shows that lignin is detectable in all samples but that it is strongly altered by degradation, which supports the interpretation of the phenols and guaiacols from Py-GC-MS.
Finally, carbohydrate products are scarce (2.5±2.2%), likely due to the relatively poor observability of microbial polysaccharides by THM-GC-MS, in comparison with Py-GC-MS (Weiss Reference Weiss2017). The fatty diacid dimethyl esters (DAMEs), of unknown source (e.g. suberin or degraded aliphatic materials), account for 3.9±2.3% of TQPA.
The ANOVA analysis of the THM-GC-MS fingerprints of SOMEX show that Group B samples are enriched (p<0.05) in trimethylpyrimidone (a marker of microbial tissue), whereas samples from Group A show relatively large proportions of long-chain FAMEs (C24-C26) and ω-methoxy-FAMEs (C22-C27) from suberin in root (and possibly bark) detritus. Samples from Group C are enriched in C16 and C18 FAMEs, which is in agreement with high abundance of fatty acids presented by Py-GC-MS, but we have no explanation for this effect.
Only two sample residues were analyzed by THM-GC-MS, which curtails a detailed discussion comparing the extracts and residues. The extracts seemed to contain larger proportions of lignin, microbial SOM (carbohydrates, N-containing compounds) and aliphatic biopolymers (long-chain FAMEs and ω-methoxy-FAMEs), whereas the residues were enriched in C16- and C18-FAMEs. The benzene tri- and tetracarboxylic acid products, allegedly from oxidized PySOM (Kaal and Filley, Reference Kaal and Filley2016), are more abundant in the extracts.
Composition in Relation to 14C Ages
Pyrolysis-GC-MS
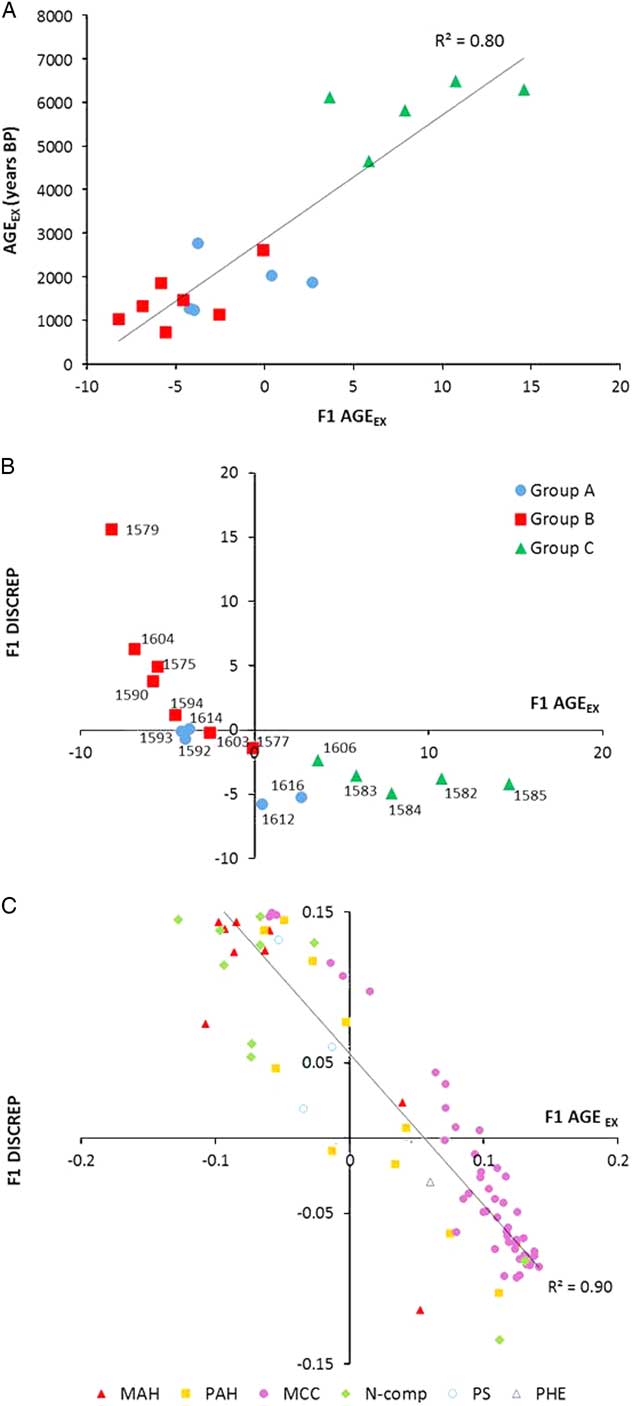
Function 1 (F1) of the PLS model for AGEEX from Py-GC-MS explains 80.4% of calibrated age variance (Figure 4a), implying that there are clear trends in pyrolysis fingerprints of SOMEX related to age. Positive loadings in this vector are found for the n-alkanes, n-alkenes and recalcitrant PySOM products (benzene, benzonitrile, unsubstituted PAHs from condensed PySOM (Kaal et al. Reference Kaal, Brodowski, Baldock, Nierop and Cortizas2008a), whereas negative loadings correspond to microbial products (N-compounds and carbohydrate products) as well as the phenols and some of the alkyl-substituted MAHs and PAHs (Figure 4c, x-axis; Supplementary Information 1). Hence, it appears that the recalcitrant PySOM and aliphatic biopolymers in SOMEX increase with age, whereas microbial SOM, lignin detritus and weakly condensed PySOM tend to decrease. These observations are in agreement with expected susceptibilities to degradation, as the chemical recalcitrance of aliphatic SOM and PySOM usually exceeds that of lignin, polysaccharides and proteins (Buurman et al. Reference Buurman, Nierop, Pontevedra-Pombal and Martínez Cortizas2006). However, inevitably the older samples correspond to different archaeological settings (megalithic) than the younger samples (terraces and hillforts). Hence, an additional, non-exclusive, explanation for this effect would be that the uphill megalithic tomb environments (oldest samples and thus positive scores in F1, Supplementary Information 1) were more frequently subjected to fire, whereas in the more recent hillforts and terrace environments (negative in F1) larger inputs of vegetal remains and agricultural waste would generate higher metabolic activity and subsequent formation of microbial SOM.
Results from PLS models of the molecular composition of the NaOH-soluble SOM as determined by Py-GC-MS. (A) F1 sample scores of the model using the measured age of the soluble SOM as the target variable. The linear regression coefficient shows that this F1 explains 80% of the variation of age. (B) Sample scores in F1 of the PLS model targeting the measured age of the SOMEX (AGEEX, x-axis), plotted against the scores in the F1 of the PLS model targeting the age discrepancy (DISCREP, y-axis). (C) Composition behind the distribution of samples shown in graph B: loadings of the pyrolysis products on F1 of the PLS model targeting the measured age of the SOM (x-axis), plotted against the loadings of the same products on the F1 of the PLS model targeting the age discrepancy (y-axis). The compounds that tend to be more abundant in older samples (positive F1 on x-axis) tend to have a negative effect on DISCREP, and vice versa. MAHs=monocyclic aromatic hydrocarbons, PAHs=polycyclic aromatic hydrocarbons, MCC=methylene chain compounds (n-alkanes, n-alkenes and n-alkanoic acids), N-comp=products with nitrogen, PHE=phenolic compounds, PS=polysaccharide products. Loadings of individual products are provided in Supplementary Information 1. Groups A, B, and C are defined on the basis of age and SOM content (Figure 3).

As mentioned before (section 3.1), there is no significant correlation between AGEEX and DISCREP. Nevertheless, the F1 loadings for DISCREP (33.9% of DISCREP variance) are inversely correlated (r2=0.90, p<0.001) with those of AGEEX (Figure 4c). This means that a higher proportion of NaOH-soluble PySOM and aliphatic biopolymers in SOMEX contributes to reduce DISCREP values (Figure 4b, samples from Group C), while the preponderance of microbial SOM increases them (Figure 4b, mainly samples from Group B). Furthermore, in the case of F2 (not shown) for DISCREP (36.6% of the variance), the MCC have positive loadings and the other compounds have negative loadings (Supplementary Information 1). Loadings and scores in this vector are positive for Group C and negative for Group A samples (Supplementary Information 1). If F1 and F2 are considered together (F1+F2=70.5%), these results suggest that the presence of a pool of well-preserved NaOH-extractable SOM is linked to low DISCREP in samples from Group A (which have also high C contents), while a higher degradation (noted by microbial enrichment in SOMEX) produces high DISCREP in samples of Group B. Finally, accumulation of PySOM and aliphatic biopolymers leads to intermediately high DISCREP in Group C samples.
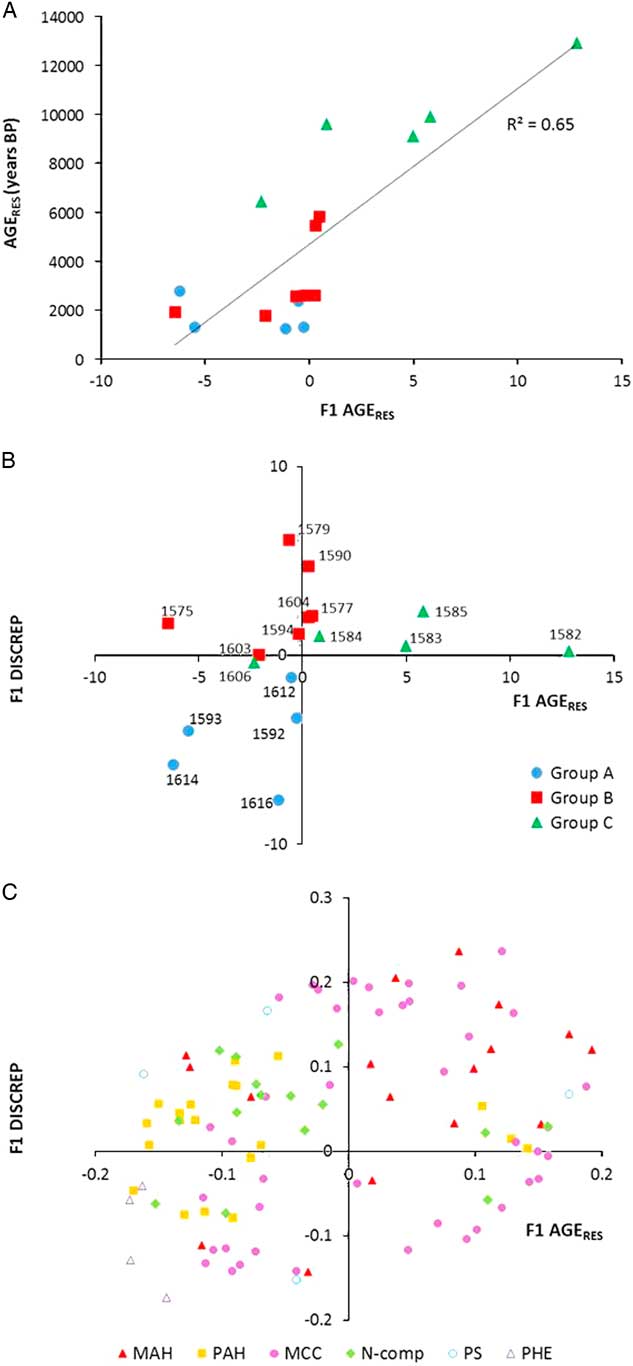
From the PLS model for AGERES, the negative loadings on F1 (64.8%; Figure 5a) correspond to phenols, carbohydrates, N-compounds, alkyl-MAHs and alkyl-PAHs, whereas unsubstituted MAHs and PAHs have positive loadings (Figure 5c, x-axis). Furthermore, the MCC are divided according to chain length, with positive loadings for C10 to C27 (from aliphatic biopolymers) and negative loadings for >C27 n-alkanes and n-alkenes (probably from waxes). Again, these results can be explained largely by accumulation in the residual fraction of recalcitrant PySOM and aliphatic biopolymers with age, even though differences in archaeological setting cannot be discarded. To the contrary, lignin, microbial SOM and waxes are preferentially depleted with age. Hence, the PLS models are consistent in that SOM composition of extracts as well as residues tend to change from microbial/lignin/intact lipids towards PySOM/degraded lipids with increasing age. Note that F1 only explains 65% of the AGERES variance which implies that others mechanisms may be involved (but we could not provide a meaningful interpretation of F2 or other functions).
Relationship of the molecular composition (Py-GC-MS) of the SOMRES with age: graph A shows the relation of the molecular composition of the residual fraction (F1 sample scores of the PLS model from Py-GC-MS results, which represents 65% of the variance) with AGERES. Graphs B and C plot the scores (B) and loadings (C) of the PLS models from Py-GC-MS of the residues after NaOH-extraction in relation to DISCREP; where x-axis is F1 of the PLS model for AGERES and y-axis is F1 of the PLS model for DISCREP. MAHs=monocyclic aromatic hydrocarbons, PAHs=polycyclic aromatic hydrocarbons, MCC=methylene chain compounds (n-alkanes, n-alkenes and n-alkanoic acids), N-comp=products with nitrogen, PHE=phenolic compounds, PS=polysaccharide products. Loadings of individual products are provided in Supplementary Information 1. Groups A, B, and C defined according to the ANOVA analysis represented in Figure 3.

The F1 of the PLS model for DISCREP using SOMRES (74.7%; Figure 5c, y-axis) displays a clear separation between phenols (predominantly from lignin) and long-chain n-alkanes/n-alkenes with negative loadings, and short-chain n-alkanes/n-alkenes with positive loadings. This suggests that DISCREP is relatively high in samples with abundant NaOH-insoluble aliphatic biopolymers and is low when lignin remains and plant waxes are preserved. Typical PySOM and microbial SOM products have neutral loadings on F1. However, F2 (Supplementary Information 1) of the DISCREP model (F1+F2=93.6%) has negative loadings for phenols, microbial products and long-chain MCC and positive loadings for PySOM and short-chain MCC (Supplementary Information S1). This shows the positive effect of recalcitrant PySOM (and again aliphatic biopolymers) on DISCREP, similar to F1 of the PLS model of SOMEX for DISCREP. However, the relation of molecular composition with age and DISCREP is less explicit for SOMRES than for SOMEX.
THM-GC-MS
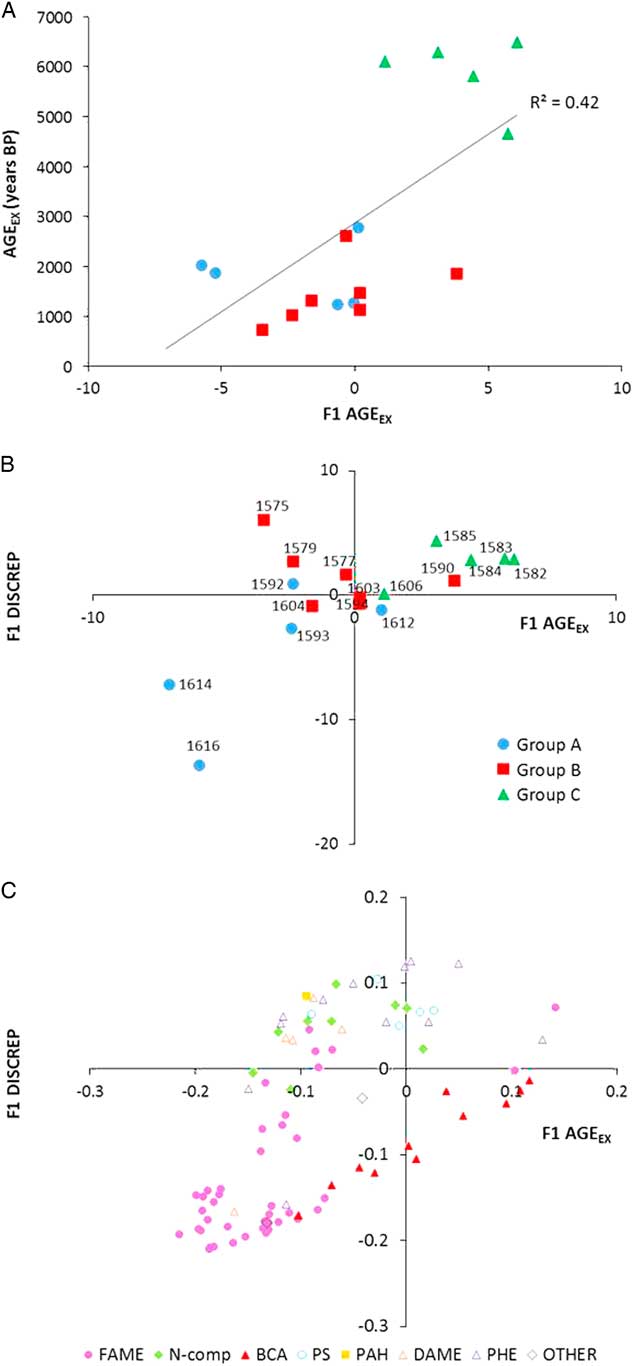
The F1 extracted by the PLS model for SOMEX based on THM fingerprints accounts for 41.9%, of variance in AGEEX (Figure 6a). The short-chain FAMEs (C16, C18) and BCA have high positive loadings on F1, while long-chain FAMEs, products of lignin/tannin and microbial SOM load negatively (Figure 6c, x-axis; Supplementary Information 2). Hence, similar as for SOMEX, the C16 and C18 fatty acids and PySOM are abundant in the samples of Group C (Figure 6b), whereas Group A samples contain more relatively intact lignin and aliphatic biopolymers (mainly suberin, recognized as long-chain FAMEs and methoxyl FAMEs), and samples from Group B are enriched in microbial SOM.
Relationship of the molecular composition (THM-GC-MS) of the SOMEX with age. (A) The F1 of the model of AGEEX using the results of THM-GC-MS explains only a 42% of the AGEEX variance. Graphs B and C display scores (B) and loadings (C) for the PLS models from THM-GC-MS of the soluble fraction. x-axis: F1 of the PLS model for AGEEX. y-axis: F1 of the PLS model for DISCREP. FAMEs=fatty acid methyl esters, N-comp=products with nitrogen, BCA=benzene carboxylic acids, PAH=polycyclic aromatic hydrocarbons, PHE=phenolic derivatives, PS=polysaccharide products, DAMEs=diacid dimethyl esters, OTHER=not identified products. Loadings of individual products are provided in Supplementary Information 2. Groups A, B, and C defined according to the ANOVA analysis represented in Figure 3.

The same clear distinction between these SOM components is made for PLS targeting DISCREP (Figure 6c, y-axis), components, with positive loadings on F1 (44.6% of variance) for microbial SOM, oxidized lignin products and short-chain FAMEs, and negative effects of the markers of suberin and intact lignin. Indeed, there is a significant positive correlation between loadings of F1 of AGEEX and DISCREP (n=98 compounds, r2=0.38, p<0.001), which was also observed for Py-GC-MS of SOMEX.
14C Ages and Molecular Fingerprints in the Light of Archaeological Setting
The existing archaeological information on the sites and samples largely shows that the 14C dates obtained for the SOMEX fraction are more accurate than the dates from SOMRES. Moreover, whereas AGEEX significantly groups samples (ANOVA p<0.005) in three cultural periods (agricultural terraces: 1120±220 cal BP, corresponding to Medieval Period; hillforts: 1810±230 cal BP, corresponding to Iron Age; and burial mounds: 5870±640 cal BP, belonging to Megalithic period), the difference in AGERES for these different periods is not significant, which points towards the limitations of the SOMRES fraction for dating samples from NW Spain.
The molecular composition of the samples is consistent with the archaeologically defined typologies for the sites listed in Table 1, and with earlier findings on ancient forms of land management. In particular, the abundance of PySOM was expected, as colluvial soils from Galicia have displayed large amounts of PySOM resulting from an intense fire regime (wild or intentional, for clearance) over the last >6500 years that has contributed to shape the Galician landscape (Kaal et al. Reference Kaal, Martínez-Cortizas, Nierop and Buurman2008b). The larger abundance of microbial SOM in the extracts of samples from agricultural and hillfort settings is consistent with the addition of vegetal remains and agricultural wastes to the soil as argued by Bouhier (Reference Bouhier1979) for traditional agricultural management in NW Spain and by Ferro-Vázquez et al. (Reference Ferro-Vázquez, Martínez-Cortizas, Nóvoa-Muñoz, Ballesteros-Arias and Criado-Boado2014, Reference Ferro-Vázquez, González Prieto, Martínez Cortizas and Criado Boado2015) for terraced soils built during the Medieval Period.
Hillfort Samples
Four samples originate from hillfort settings, corresponding to the Iron Age (roughly 1900–2800 cal BP, (Parcero-Oubiña and Ayán Vila Reference Parcero-Oubiña and Ayán Vila2009; Jordá Pardo et al. Reference Jordá Pardo, Rey Castiñeira, Picón Platas, Abad Vidal and Marín Suárez2009). These samples correspond to Group A and Group B and their AGEEX ranges between 1500 and 2030 cal BP, whereas AGERES varies between 1300 and 5400 cal BP. The sample from Besomaño (Ribadumia) is the only sample where AGERES (1240 cal BP) is lower than AGEEX (1880 cal BP; DISCREP=−34%). This sample corresponds to sediment from a domestic structure (house) which, according to archaeological evidence, corresponds to Roman period (Aboal Fernández et al. Reference Aboal Fernández, Rodríguez Martínez, Castro Hierro, Cancela Cereijo and Blanco Rotea2013; Rodríguez Martínez Reference Rodríguez Martínez2015). It has high C content (11.9%) and high C/N (21.9, Table 2) and corresponds to Group A. The sample from A Lanzada (Sanxenxo) also belongs to Group A, with high C content (10.4%) and C/N (19.4). AGEEX (2030 cal BP) and AGERES (2410cal BP) are similar and, on the basis of what is known of this hillfort, both ages are within the plausible range of habitation (Suarez Otero and Fariña Busto Reference Suarez Otero and Fariña Busto1990; Rodríguez Martínez et al. Reference Rodríguez Martínez, Aboal-Fernández, Castro Hierro, Cancela Cereijo and Ayán Vila2011; Franco and Rodríguez Martínez Reference Franco and Rodríguez Martínez2015). Both Besomaño and A Lanzada samples have low microbial SOM content, in both SOMEX and SOMRES fractions, which is interpreted as evidence of good SOM preservation. In contrast, the posthole sample from Punta dos Prados (Ortigueira) belongs to Group B. It has a low C content (1.0%) and C/N ratio (11.0) and a high DISCREP (195%). The AGEEX of 1850 cal BP is archaeologically more accurate than AGERES (5450 cal BP). This sample has a high microbial SOM content, especially in the extract. It is suggested that a more intense SOM reworking caused the enrichment of microbial SOM and depletion of other SOM components except for PySOM, which is more recalcitrant. The SOMRES from these samples would contain inherited old C, probably from fire residues, the signal of which would be amplified by a stronger degradation, thus exacerbating the inheritance effect in the Group B samples but not in the better preserved Group A samples, where root and lignin detritus are preserved.
The stronger impact of degradation on the samples from Group B in comparison with those of Group A, cannot be explained in terms of climatic variability, as some of the samples showing evidence of less degraded SOM correspond to locations with higher mean annual temperatures and lower thermal amplitude (Martínez-Cortizas and Pérez-Alberti Reference Martínez Cortizas and Pérez-Alberti1999). It is, in turn, more plausible that the more acidic, granitic parent material in samples from Group A (GEODE-IGME) has an effect on the SOM degradation rates. These rocks naturally release, upon weathering under temperate and wet conditions, large amounts of Al, which readily forms organometallic SOM-Al complexes under acidic pH (Shoji and Fujiwara Reference Shoji and Fujiwara1984; Kaiser and Guggenberger Reference Kaiser and Guggenberger2000; Kaiser and Zech Reference Kaiser and Zech2000). This complexation reaction provides protection against microbial SOM degradation through sorptive preservation and associated occlusion in micro-aggregates (Schwesig et al. Reference Schwesig, Kalbitz and Matzner2003; Kalbitz et al. Reference Kalbitz, Schwesig, Rethemeyer and Matzner2005; Grand and Lavkulich Reference Grand and Lavkulich2011). In fact, complexation with Al has been reported to decrease the biodegradability of labile SOM considerably, while the half-life of the more recalcitrant pool can increase up to 4 times as well (Schwesig et al. Reference Schwesig, Kalbitz and Matzner2003). Other mechanisms than sorptive preservation may occur simultaneously, such as toxicity of free Al to microorganisms in acidic soils (Tokashiki and Wada Reference Tokashiki and Wada1975; Tonneijck et al. Reference Tonneijck, Jansen, Nierop, Verstraten, Sevink and De Lange2010). Unlike Group A samples, Punta dos Prados lithological setting (as well as for the rest of the samples from Group B) is more alkaline, i.e. greenschist parent material (GEODE-IGME; Castroviejo et al. Reference Castroviejo, Armstrong, Lago, Martínez Simón and Argüelles2004), which is more easily altered than granite and provides larger amounts of basic cations and much less Al to the soil solution. It is concluded that the soil mineralogical and chemical environment, in particular the role of free or organically bound Al, influences the degradation-preservation dynamics of the SOM—and thereby DISCREP, as also found for other soils in Galicia by (Suárez-Abelenda et al. Reference Suárez-Abelenda, Buurman, Camps Arbestain, Kaal, Martinez-Cortizas, Gartzia-Bengoetxea and Macías2011).
The last sample from a hillfort setting, from a house wall from Montealegre, showed an AGEEX that is considered too recent compared with existing archaeological information (1480 cal BP, Table 2), and an AGERES that is too old (2620 cal BP), since the cultural material from this site corresponds to the first to second centuries AD (Aboal Fernández and Castro Hierro Reference Aboal Fernández and Castro Hierro2005; González-Ruibal et al. Reference González-Ruibal, Martínez, Fernández and Hierro2007). Despite the low C content (2.2%) and C/N (10.7), and high DISCREP (77%) and microbial SOM content (especially in SOMEX), this sample from Group B comes from a site where granitic material dominates. However, this sample is anomalous in that it is not from a soil but instead has been sampled from a wall mortar. As mortars are typically made from a mixture of sand, a binder (mud or clay, in this case) and water, the results of the 14C dating will be biased by the age of its original components and the mortar manufacturing procedure. Moreover, the post-construction physico-chemical environment is different from that of soils. Neither SOMEX nor SOMRES could provide a reliable date for the construction of the wall; rather they would represent either the age of the organic material used for the mortar (Sanjurjo-Sánchez Reference Sanjurjo-Sánchez2016).
Agricultural Setting
The other samples of Group B correspond to agricultural contexts. Their lithology is also alkaline, although not ultramafic as Punta dos Prados: the samples from Cidade de Cultura (Santiago) and Santa Lucía (Eixo, Santiago) originate from soils developed on amphibolite and those from Coto do Castrelo (Lalín) from a soil formed on schists with amphibolite inclusions. Their AGEEX varies in a narrow range between 730 and 1330 cal BP, which corresponds to the Medieval Period, and is consistent with knowledge on terraces construction in Galicia, which became widespread during the Germanic Period (Ballesteros Arias Reference Ballesteros Arias2010; Ballesteros Arias and Blanco Rotea Reference Ballesteros Arias and Blanco Rotea2009; Ballesteros Arias et al. Reference Ballesteros Arias, Criado-Boado and Andrade Cernadas2006; Ferro-Vázquez et al. Reference Ferro-Vázquez, Martínez-Cortizas, Nóvoa-Muñoz, Ballesteros-Arias and Criado-Boado2014; Ferro-Vázquez et al. Reference Ferro-Vázquez, González Prieto, Martínez Cortizas and Criado Boado2015). On the contrary, dating of the SOMRES fractions gives AGERES >1800 cal BP (Table 2), which are considered too early and not consistent with other information on the sites. PySOM is abundant in these samples, especially in the residues, whereas microbial SOM dominates the extracts. These residues therefore probably contain pyrogenic old C from fire derived OM, the signal of which, again, would have been amplified by microbial degradation, which is in turn catalysed by a lithology that favours a fast SOM turnover and therefore a large DISCREP.
The sample from A Pousada (Bornais, Santiago) corresponds to a pavement clay mortar (Blanco-Rotea et al. Reference Blanco-Rotea, Prieto, Ballesteros Arias and López González2010). It is also a typical Group B sample with low C content, high DISCREP and large proportion of microbial SOM in the extract. However, its age is considerably older (AGEEX 2620 cal BP, AGERES 5810 cal BP) than the other samples from agricultural settings and, as in the case of the Montealegre mortar, it is probably not representative of the age of the construction of the pavement but of original constituents of the fabric used for manufacturing (Sanjurjo-Sánchez Reference Sanjurjo-Sánchez2016).
The other two samples from agricultural settings correspond to Group A. They are from terrace soils in Montenegro (Morrazo) that developed on granite. These samples returned similar results for 14C dating (AGEEX of 1240 cal BP and AGERES of 1330 cal BP, both of which are consistent with the archaeological evidence for this site, Gianotti García and Cancela Cereijo Reference Gianotti García and Cancela Cereijo2005) and hence DISCREP is low. Also consistent with the rest of the samples from Group A, they have relatively high C content and C/N ratio. The good SOM preservation appears to have mitigated the influence of old inherited SOM in the SOMRES fraction.
It follows from these results that DISCREP is not affected by differences in archaeological setting, because Iron Age hillforts and medieval agricultural terraces have both Group A (low DISCREP) as well as Group B (high DISCREP) samples. Still, some differences between archaeological settings can be found. The C/N ratio is, on average, lower (11±1) for agricultural sites than for hillforts (16±6) (p<0.05), whereas N-compounds (both Py-GC-MS and THM-GC-MS) are more abundant in the in the SOMEX of agricultural than of hillfort sites, which probably reflects a general difference in use and perhaps fertilization practices and a faster turnover in agricultural contexts. Moreover: (1) the SOMRES fractions of the agricultural terraces have higher PySOM content than the hillforts (p<0.05 for pyrolysis products naphthalene, biphenyl and sum of PAHs), which may be related to slash-and-burn agriculture (or slash-and-char), and (2) SOMEX in terraces is enriched in microbial THM products, and also some products of oxidized lignin (P6, G6). To the contrary, the SOMEX from hillforts is enriched in relatively oxidized PySOM and root derivatives.
Burial Mounds
The AGERES values of the samples from megalithic tombs (i.e. four samples from Ortigueira and one sample from Toques, all of them corresponding to Group C), clearly exceed the expected ages for megalithic contexts in Galicia. This is particularly the case for the SOMRES fractions from Forno dos Mouros from Ortigueira, which were dated 9100–13000 yr cal BP (Table 2). This range is much older than the age representative of different phases of mound formation and use: it is 2000–6000 yr prior to earliest megalith architecture in NW Spain (Prieto Martínez et al. Reference Prieto Martínez, Mañana-Borrazás, Costa Casais, Criado-Boado, López Sáez, Carrión Marco and Martínez Cortizas2012). Their SOMRES has large proportions of PySOM and C16 and C18 fatty acids. Although fires or hearths beneath tumuli have been documented in other megalithic sites of NW Spain (Fábregas Valcarce Reference Fábregas Valcarce1988; Criado Boado and Fábregas Valcarce Reference Criado Boado and Fábregas Valcarce1989), this is not the case for the Forno dos Mouros burial mounds (Mañana-Borrazás Reference Mañana-Borrazás2005). The abundance of PySOM in these samples is, therefore, probably due to wildfires, which have been demonstrated to be frequent in this period (Kaal et al. Reference Kaal, Martínez-Cortizas, Nierop and Buurman2008b). Their AGEEX is between 4600 and 6400 cal BP, which is more consistent with the chronology of the cultural period (Neolithic) and is in agreement with other dates measured in the same site and similar stratigraphic context (Mañana-Borrazás Reference Mañana-Borrazás2005; Mañana-Borrazás et al. Reference Mañana-Borrazás, Criado-Boado, Ferro-Vázquez and Martínez Cortizas2014). As a result, the DISCREP for these samples is high.
In contrast, the sample from Forno dos Mouros from Toques has a more similar AGERES (6470 cal BP) and AGEEX (6100 cal BP). Both dates are acceptably within the time frame of the megalithic period in NW Spain (Prieto Martínez et al. Reference Prieto Martínez, Mañana-Borrazás, Costa Casais, Criado-Boado, López Sáez, Carrión Marco and Martínez Cortizas2012), although AGERES is considered too old when compared with previous research on this site (Criado Boado et al. Reference Criado Boado, Bonilla Rodríguez, Cerqueiro Landín, Díaz Vázquez, González Mendez, Infante Roura, Méndez Fernández, Penedo Romero, Rodríguez Puentes and Vaquero Lastres1991; Steelman et al. Reference Steelman, Ramírez, Valcarce, Guilderson and Rowe2005). The sample comes from the infilling of a structure made after the megalith was abandoned, during the Bell Beaker period (Martínez Prieto et al. Reference Martínez Prieto, Lantes Suárez and Martínez Cortizas2008). However, this infilling consists of material from the mound itself, which explains the consistency of the dates with the Megalithic period. This sample has a much higher C content (7.6%) than the samples from Ortigueira (1.7–3.6%) and higher C/N ratio (17 vs. 12–14) (Table 2). The SOMRES has relatively high proportions of phenols and carbohydrates products (revealed by Py-GC-MS) whereas the SOMEX fraction is enriched in pyrolysates from root detritus, as shown by THM-GC-MS results. It therefore shares several compositional similarities with the samples from Group A (Figure 3b), consistent with a better preservation state, especially in the SOMRES. This seems to have resulted in a much lower DISCREP than the other samples from the megaliths setting, where degradation would have caused more pronounced relative accumulation of inherited PySOM and degraded lipids in SOMRES, leading to age overestimations in the NaOH-insoluble fraction. This difference coincides again with a more acidic lithological setting for Toques (ortogneis) compared to Ortigueira (schists and slate parent materials, mineralogically more alkaline).
Finally, the sample 1614 is, in contrast to the rest of the megalithic samples, not from a burial mound itself, but from a small trench in a presumably megalithic site in Monte Lobeira (Vilanova de Arousa). This Group A sample has high C content (12.7%), C/N (22.2) and gave near identical ages for AGEEX and AGERES (2800 cal BP). This age is younger than expected for a megalithic setting. However, due to the fact that the sample analyzed is from a trench fill and not from a burial mound, and also because the site is known to have been used after the megalithic era (López-Romero and Mañana Borrazás Reference López-Romero and Mañana Borrazás2013), this date was considered acceptable from an archaeological perspective. PySOM is abundant in the residue, which is in agreement with field observations (abundant charcoal; López-Romero and Mañana Borrazás Reference López-Romero and Mañana Borrazás2013). However, owing to either the relatively good preservation of non-pyrogenic SOM or because fire occurred simultaneously with deposition, presence of PySOM did not boost DISCREP. Microbial SOM is scarce in both fractions, confirming a good preservation state of the SOM. Accordingly, and consistently with the rest of the samples from Group A, this sample comes from a soil developed in granodiorite, which is an acidic lithological material.
Implications for Dating of SOM in Archaeological Contexts
According to (Kristiansen et al. Reference Kristiansen, Dalsgaard, Holst, Aaby and Heinemeier2003), a low discrepancy between fractions signifies that the SOM was probably derived from an ecosystem where SOM was rapidly rejuvenated, whereas discrepancies larger than for instance a few decades between the NaOH-soluble and -insoluble fractions would indicate that the SOM originally was not a homogenous pool, more specifically that it was influenced by incorporation of younger SOM. However, this interpretation stems from the aim of dating the soil, rather than obtaining the archaeological age.
Our results show that dating the NaOH-insoluble SOM generally produces overestimations of the archaeological age. Intense microbial degradation would have resulted in microbial SOM in the extracts and exacerbated inheritance effects of the more recalcitrant PySOM and aliphatic biopolymers, as degradation eliminated relatively palatable coetaneous organic matter such as lignin and plant-derived polysaccharides. The degree to which SOM has been affected by degradation results from the combined effect of its original intrinsic recalcitrance (SOM inherited from earlier burning events is more resistant to degradation than e.g. fresh polysaccharides) and the edaphic chemical and mineralogical environment.
Considering the evidence of root-derived SOM from THM-GC-MS, especially in the samples from Group A, which have high SOM content and low DISCREP, it would be tempting to conclude that the 14C ages of NaOH-insoluble SOM are to some extent affected not only by inheritance of older SOM (mainly PySOM), but also by rejuvenation through later root input, which could actually have partially counterbalanced the inheritance effect. Nevertheless, we believe the presence of root-detritus should not be interpreted in terms of rejuvenation, but in terms of SOM preservation: their markers, and those of intact lignin, can only be detected if the intensity of degradation was low.
Our results therefore support previous research that proposed to use 14C ages of NaOH-soluble SOM (AGEEX) for 14C dating of archaeological events(Kaal et al. Reference Kaal, Martínez-Cortizas, Nierop and Buurman2008b; Albrecht and Kühn Reference Albrecht and Kühn2011; Pietsch and Kühn Reference Pietsch and Kühn2014). At the same time, given the effect of the physico-chemical environment on DISCREP, its characterization may also, when combined with the study of molecular composition, give insights on stabilization and turnover of different SOM constituents.
CONCLUSIONS
The analysis of archaeological samples from NW Spain by pyrolysis-GC-MS and THM-GC-MS provided insights into the molecular composition of the different fractions isolated from SOM using an acid-alkali-acid treatment. The SOM is largely composed of a mixture of microbial SOM, pyrogenic organic matter and aliphatic recalcitrant molecules, at least in part from roots. Alkali-extractable SOM, which accounts for roughly two-thirds of total SOM, has a larger proportion of microbial detritus than the residual SOM. This would traditionally be attributed to rejuvenation in the extractable fraction. However, since archaeological evidence unambiguously shows that the 14C age of the insoluble fraction is far older than would be expected from associated cultural material, it is concluded that microbial SOM is not a source of age bias. It is, however, relevant as it is evidence of the degradation of SOM (including elimination of the palatable lignin and polysaccharide contents of plant debris). The statistical analysis of the results by partial least squares regression suggested that the insoluble fraction contains inherited fire-derived SOM and aliphatic biopolymers that are the source of the age overestimations in the residual fraction. The extent of the discrepancies between the NaOH-soluble and -insoluble fractions appears to be related with the intensity of mineralization, because a larger degradation degree exacerbates the inheritance effect. In the studied samples, the intensity of degradation is controlled by (1) molecular recalcitrance of in particular pyrogenic matter and (2) the geochemical environment of the sample matrix which determines the degree of SOM protection through the availability of free or poorly-crystalline Al for organomineral complexation reactions. The relative importance of these two SOM preservation mechanisms could not be established.
ACKNOWLEDGMENTS
Cruz Ferro-Vázquez has been funded by the People Programme (Marie Curie Actions) of the European Union’s Horizon 2020 Programme (tRRACES-H2020-MSCA-IF-2014-657355). Radiocarbon analyses have been funded by the Institute of Heritage Sciences from the Spanish National Research Council (Incipit-CSIC) and the Consolider Programme CSD2007-0058 (MINECO, Spain). We are grateful to the anonymous reviewers and associate editor for their valuable suggestions.
SUPPLEMENTARY MATERIAL
To view supplementary material for this article, please visit https://doi.org/10.1017/RDC.2018.62
APPENDIX
Conventional 14C ages (and error), F14C values (and error), calibration probability ranges, relative area for each interval, and median of the probability distribution for A) SOMBULK, B) SOMRES, and C) SOMEX.
■