Implications
We investigated the effects of herd productivity (HP) and of six dairy and dual-purpose breeds of cow on cheese yield (CY) efficiency and milk nutrient recovery in cheese with respect to individual cows from multi-breed dairy farms. Differentiating between the effects of HP and cow characteristics offered a better understanding of breed characteristics and provided information useful for defining breeding goals of purebred animal and for improving the selection of breed combinations in crossbreeding dairy programs.
Introduction
Cheese yield, expressed as the percentage ratio between the cheese produced and the milk processed (%CY), is of global economic importance, while daily cheese yield (dCY), expressed in kilograms of cheese produced daily per cow, is the final direct or indirect production target of many dairy farmers. Cheese yield relies primarily on the fat and protein content of milk, particularly casein, and on the technological properties of milk (Law and Tamine, Reference Law and Tamine2010), but also on recovery in the curd of the individual milk components (REC traits) that determine overall cheese-making efficiency. Measuring or predicting the %CY and dCY of individual cows is important in studies aimed at investigating the existence of a genetic basis for these traits (Bittante et al., Reference Bittante, Cipolat-Gotet and Cecchinato2013), and also for selecting breed combinations in crossbreeding dairy programs.
The primary genetic characteristic of a cow – its breed – has been shown to have an enormous effect on CY traits (Banks et al., Reference Banks, Clapperton, Muir and Girdler1986), but this information generally comes from studies using bulk milk from cows grouped into individual experimental herds (Mistry et al., Reference Mistry, Brouk, Kaperson and Martin2002; Hurtaud et al., Reference Hurtaud, Peyraud, Michel, Berthelot and Delaby2009; Martin et al., Reference Martin, Pomies, Pradel, Verdier-Metz and Remond2009), or bulk milk from different commercial single-breed herds (Malacarne et al., Reference Malacarne, Summer, Fossa, Formaggioni, Franceschi, Pecorari and Mariani2006; Bland et al., Reference Bland, Grandison and Fagan2015) so that comparisons of breeds may be affected by a lack of representativeness, or by different individual (parity, stage of lactation, etc.) or herd (facilities, feeding, management, etc.) characteristics. In fact, Cipolat-Gotet et al. (Reference Cipolat-Gotet, Cecchinato, De Marchi and Bittante2013) found that the effect of herd represented 21% to 31% of total variance for the REC traits of milk components in the curd, 24% to 42% in the case of %CY traits and 51% to 53% for dCY. It is also possible that very different dairy systems and levels of farm productivity interact with breed.
In evaluating different cheese-making traits, it is, therefore, very important to distinguish between genetic and environmental factors when comparing different breeds, to effectively plan breed combinations in crossbreeding programs, and in order to better define objectives in the selection of purebred animals. The specific aims of this study were (a) to quantify and characterize the effects of HP on 15 REC, %CY and dCY traits; (b) to quantify the variability of herds within class of HP; and (c) to make a within herd comparison of six dairy and dual-purpose breeds for these cheese-making traits.
Materials and methods
Multi-breed herds
A total of 513 cows from 27 multi-breed (2 to 5 breeds per herd, on average 3) herds located in Trentino province in the north-eastern Italian Alps were studied for daily milk yield and composition, and cheese-making traits (normally 20 cows per herd were sampled). Details of milk sampling and analysis, and of the milk coagulation properties are described by Stocco et al. (Reference Stocco, Cipolat-Gotet, Bobbo, Cecchinato and Bittante2017). A few cows and milk samples were discarded because of evident health problems, milk composition abnormalities or technical problems. In total, six breeds were investigated. These were three specialized dairy breeds: Holstein Friesian (HF=17 herds, 110 cows), Brown Swiss (BS=22 herds, 155 cows) and Jersey (Je=6 herds, 39 cows); and three dual-purpose breeds: Simmental (Si=14 herds, 69 cows) and two native breeds, Alpine Grey (AG=13 herds, 71 cows) and Rendena (Re=8 herds, 69 cows).
Herd productivity classification
The herds were classified into two categories of HP according to their average daily milk energy output (dMEO) calculated on the basis of dMY and the fat, protein and lactose contents of the milk. The net energy content (NEL) of milk was estimated by means of the following equation, proposed by the NRC (2001):
 $$\eqalign { {\rm NE}_{{\rm L}} \left( {{\rm Mcal}/{\rm kg}} \right)\,{\equals} & \,0.0929{\times}\%\,\,{\rm fat}{\plus}0.0547{\times}\, \cr & \quad \%\,\,{\rm protein}{\plus}0.0395{\times}\,\%\,\,{\rm lactose,}$$
where NEL is the energy of 1 kg of milk. The NEL values obtained were converted to MJ/kg and multiplied by the daily milk yield of each cow (kg/day) to obtain the individual dMEO of each cow (MJ/day). Individual dMEO were analyzed using a model that included herd, breed, parity and days in milk (DIM) of each cow, so that the least squares means (LSMs) of the herds represented the sum of environmental effects (including facilities, feeding practice, health management, etc.). After ranking the dMEO LSMs of the 27 farms, we divided them into high producing (High-HP: n=13, dMEO=83.82 MJ/day) and low producing (Low-HP: n=14, dMEO=51.60 MJ/day) herds on the basis of the median value (64.1 MJ/day); details are described in Stocco et al. (Reference Stocco, Cipolat-Gotet, Bobbo, Cecchinato and Bittante2017). The Holstein, Brown Swiss, Simmental and Rendena breeds were distributed throughout the high- and low-productivity herds, whereas the Jerseys were only found in High-HP herds, and the Alpine Greys in Low-HP herds.
Analysis of milk and whey samples
Immediately after collection, individual milk samples of about 2000 ml/cow were stored at 4°C, and processed within 24 h of sampling at the Milk Quality Laboratory of the Department of Agronomy, Food, Natural Resources, Animals and Environment (DAFNAE) of the University of Padova. Milk and whey compositions were measured with a Milkoscan FT2 IR analyzer (Foss Electric A/S, Hillerød, Denmark) calibrated according to ISO reference methods (ISO 6731/IDF 21 for total solids; ISO 8968-2/IDF 20-2 for protein; ISO 17997-1/IDF 29-1 for casein; ISO 1211/IDF for fat; ISO 26462/IDF 214 for lactose).
Individual model cheese-making procedure
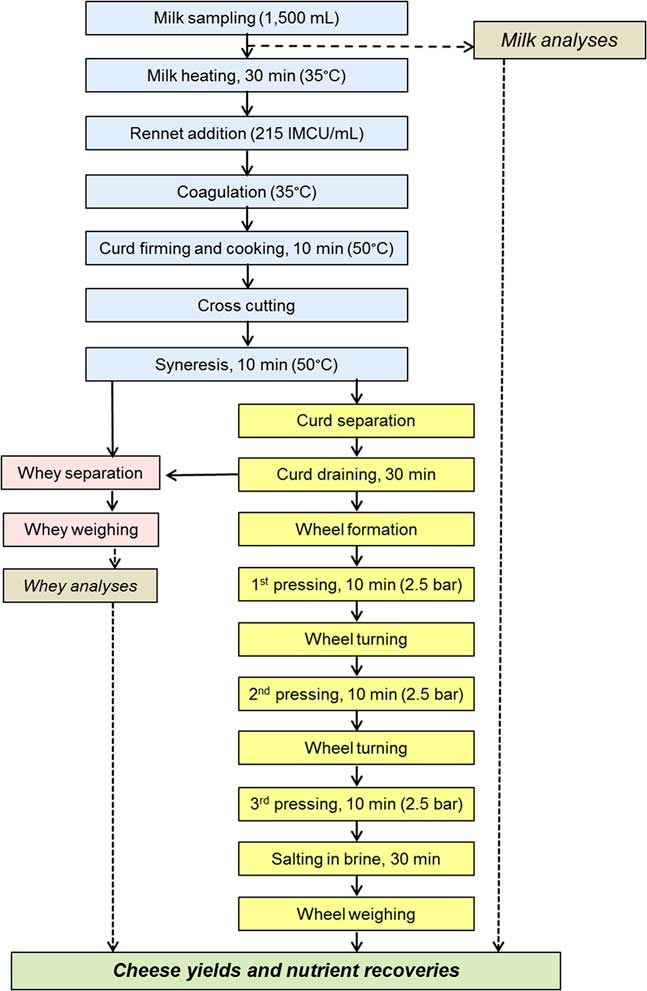
The cheese-making apparatus consisted of three water baths (WB) fitted with a digital temperature controller and pumps to mix the water to ensure homogeneous heat distribution throughout the WB. Five stainless steel vats (capacity 1500 ml) were placed in each WB. The procedure adopted is summarized in Figure 1 and described in detail by Cipolat-Gotet et al. (Reference Cipolat-Gotet, Cecchinato, De Marchi and Bittante2013), with some modifications mainly for reducing the length of the milk-processing and increasing the number of model cheeses obtained per day. Hansen Naturen Plus 215 bovine rennet (Pacovis Amrein AG, Bern, Switzerland) was used.
Cheese-making procedure adopted to obtain the 508 model cheeses from individual cows.

Definition of cheese-making traits
The weights of the milk and the whey (g) and their chemical compositions enabled us to calculate cheese-making traits, as proposed by Cipolat-Gotet et al. (Reference Cipolat-Gotet, Cecchinato, De Marchi and Bittante2013). The composition of the curd was calculated by subtracting the weight of the nutrient in the whey from the weight of the corresponding nutrient in the milk processed. In brief, the traits measured were %CYCURD, %CYSOLIDS and %CYWATER, calculated as the ratios of the weights (g) of fresh curd, curd dry matter and curd water, respectively, to the weight of the milk processed (g); RECPROTEIN, RECFAT and RECSOLIDS, calculated, respectively, as the ratios between the weights (g) of the protein, fat and dry matter in the curd and the same components in the milk (g). Recovery of energy in the curd (RECENERGY) was determined by estimating the energy in the milk and in the curd using an equation proposed by the NRC (2001), and converting the results to MJ/kg. Finally, dCYs (dCYCURD, dCYSOLIDS and dCYWATER; kg/day) were calculated by multiplying the different %CYs (%CYCURD, %CYSOLIDS and %CYWATER, respectively) by the daily milk yield (dMY, kg/day).
Definition of cheese-making efficiency
The theoretical %CYCURD (Th-%CYCURD) of the milk samples from each cow was estimated using the traditional formula of Van Slyke and Price (Reference Van Slyke and Price1949) reported by Emmons and Modler (Reference Emmons and Modler2010) in their review:
 $$\eqalignno { Th{\hbox -}\,\%\,{\rm CY}_{{{\rm CURD}}} \,{\equals}\, & {{( {0.93{\times}\,\%\,\,{\rm fat}{\plus}\,\%\,\,{\rm casein}\,{\minus}\,0.1} )}} \cr & {{\times}1.09} \mathord{/ {\vphantom {( {0.93{\times}\,\%\,\,{\rm fat}{\plus}\,\%\,\,{\rm casein}{\minus}0.1} \right){\times}1.09} {\left[ {\left( {100{\minus}\,\%\,\,{\rm M}} \right)\,/\,100} \right]}}} \right. \kern-\nulldelimiterspace} {\left[ {\left( {100\,{\minus}\,\%\,\,{\rm M}} \right)/100} \right]}},$$
where 1.09 represents the correction for milk minerals and cheese salt and carbohydrates, and %M is the percentage moisture of cheese (100−% total solids).
A formula for estimating the theoretical %CYSOLIDS (Th-%CYSOLIDS) was derived from this one by simply deleting the last part, which corrects for cheese moisture:
 $$Th{\hbox -}\,\%\,{\rm CY}_{{{\rm SOLIDS}}} \,{\equals}\,\left( {0.93{\times}\,\%\,\,{\rm fat}{\plus}\,\%\,\,{\rm casein}\,{\minus}\,0.1} \right){\times}1.09.$$
The efficiencies of the %CYCURD (Ef-%CYCURD) and the %CYSOLIDS (Ef-%CYSOLIDS) were calculated as the ratio between the experimental value and the corresponding theoretical value for each cow:
 $$\eqalignno{ Ef{\hbox -}\,\%\,{\rm CY}_{{{\rm CURD}}} & \,{\equals}\,\%\,{\rm CY}_{{{\rm CURD}}} /Th{\hbox -}\,\%\,{\rm CY}_{{{\rm CURD}}} ,\;{\rm and} \cr Ef{\hbox -}\,\%\,{\rm CY}_{{{\rm SOLIDS}}} & \,{\equals}\,\%\,{\rm CY}_{{{\rm SOLIDS}}} /Th{\hbox -}\,\%\,{\rm CY}_{{{\rm SOLIDS}}} . $$
Statistical analysis
Experimental data were analyzed using the MIXED procedure (SAS Institute Inc., Cary, NC, USA), according to the following model (base model):
 $$\eqalignno{ y_{{ijklmnop}} \,{\equals}\,\mu {\plus} & {\rm HP}_{m} {\plus}{\rm Herd}_{n} \left( {{\rm HP}} \right)_{m} {\plus}{\rm Breed}_{k} {\plus}{\rm Parity}_{j} \cr & {\plus}{\rm Breed}_{k} {\times}{\rm Parity}_{j} {\plus}{\rm HP}_{m} {\times}{\rm Parity}_{j} \cr & {\plus}{\rm DIM}_{i} {\plus}{\rm HP}_{m} {\times}{\rm DIM}_{i} {\plus}{\rm Waterbath}_{l} \cr & {\plus}{\rm Vat}_{o} \left( {{\rm Waterbath}} \right)_{{\rm l}} {\plus}e_{{ijklmnop}} , $$
where y
ijklmnop
is the observed trait; μ the overall intercept of the model; HP
m
the fixed effect of the mth HP (m=2 levels); Herd
n
the random effect of the nth herd (n=1 to 27) within the mth class of HP; Breed
k
the fixed effect of the kth breed (k=HF, BS, Je, Si, Re and AG); Parity
j
the fixed effect of the jth parity (j=1 to ⩾4); DIM
i
the fixed effect of the ith monthly class of DIM (i=1 to 10, 26 to 84 cows in each); Waterbath
l
the random effect of the lth WB (l=4 baths); Vat
o
the random effect of the oth vat (o=1 to 20) within the lth WB; e
ijklmnopq
the random residual ~N (0,
 $\sigma _{e}^{2} $
).
A model that also included the breed×HP interaction was fitted to test the data from all the breeds present in both classes of herds (Je and AG excluded). As this interaction was never significant, the results of this model analysis are not shown nor discussed.
A further model was used to distinguish between the direct and indirect effects of breed on CY and cheese-making efficiency traits. To estimate the direct effect of breed, independent from the breed differences in milk yield and quality traits, a model was obtained from the base model with the addition of the linear covariates of dMY, total solids, protein, fat, lactose, pH and somatic cell score. The difference between the two models in terms of breed variance was assumed to be explained by the differences among breeds in terms of milk yield and quality (indirect breed effect). Both direct and indirect breed variances were represented as percentages of total breed variance.
Orthogonal contrasts were estimated between the LSMs of the traits to determine the effect of breed:
-
a. specialized dairy (HF, BS and Je) v. dual-purpose breeds (Si, AG and Re);
-
b. within specialized breeds, large-framed v. small-framed (HF+BS v. Je), and
-
c. comparison between the two large-framed dairy breeds (HF v. BS);
-
d. within dual-purpose, large-framed breeds v. medium-framed local breeds (Si v. Re+AG), and
-
e. comparison between the two medium-framed local dual-purpose breeds (Re v. AG).
Orthogonal contrasts were also estimated between the LSMs of traits to determine the effect of parity: (a) 1st v. ⩾2nd, (b) 2nd v. ⩾3rd, (c) 3rd v. ⩾4th.
Results
Descriptive statistics and random effects on the cheese-making ability of milk
Descriptive statistics of the traits studied are shown in the Supplementary Table S1. All traits exhibited high variability, mainly due to the diversity of HP and of the six breeds sampled, and had an almost normal distribution.
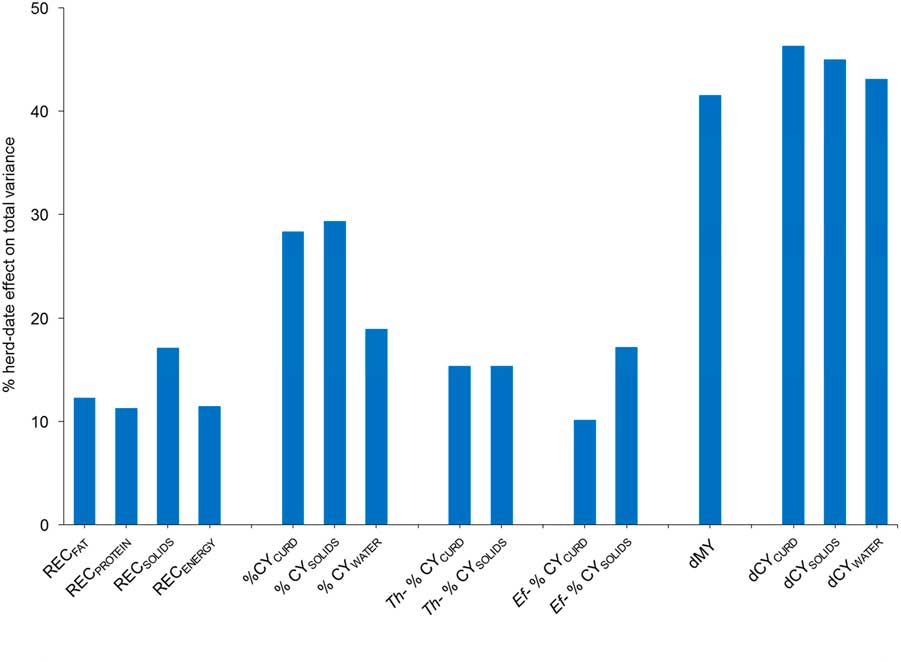
Figure 2 shows the proportion of herd–date variance within-HP class to the total variance of the traits studied. In the case of RECs, the herd–date effect was modest, whereas it was intermediate for %CY, Th-%CY and Ef-%CY traits, and much greater for daily milk and cheese production per cow, varying from 11.3% for RECPROTEIN to 41.5%–46.3% for production traits. Regarding the other random effects in the model (data not shown), neither WB nor vat within WB had much effect on cheese-making ability (maximum 0.6% of the total variance for RECENERGY (WB), and RECPROTEIN (vat within WB)), demonstrating the good reproducibility of the method.
Incidence of herd–date variance on total variance of cheese-making traits and production of individual cows. RECFAT=recovery of fat; RECPROTEIN=recovery of protein; RECSOLIDS=recovery of total solids; RECENERGY=recovery of energy; %CYCURD=fresh cheese yield; %CYSOLIDS=cheese yield in total solids; %CYWATER=water retention in the curd; Th-%CYCURD=theoretical cheese yield; Th-%CYSOLIDS=theoretical cheese yield in total solids; Ef-%CYCURD=efficiency of cheese-making in fresh cheese yield; Ef-%CYSOLIDS=efficiency of cheese-making in total solids; dMY=daily milk yield; dCYCURD=daily production of fresh cheese; dCYSOLIDS=daily production of cheese in total solids; dCYWATER=daily retention of water in the curd.

Effects of herd productivity, parity and days in milk
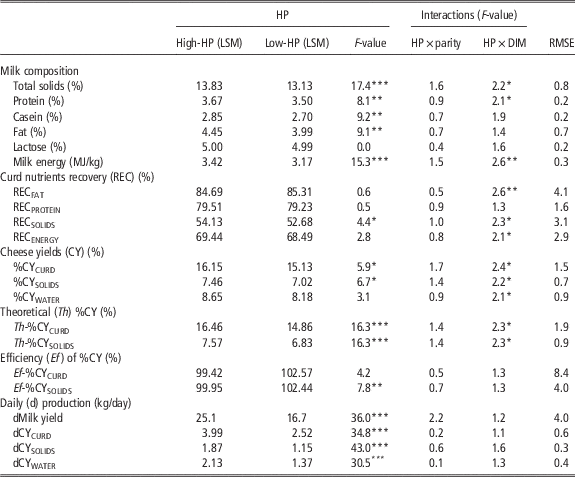
The daily yield and nutrient contents of milk were both very different in the two HP classes, and both greater in the High-HP herds (Table 1). Although there were no differences in milk nutrient recoveries in the curd (except for RECSOLIDS), the greater fat and casein contents are responsible for the greater %CYSOLIDS (+6.3%) in High-HP herds than in Low-HP herds. This difference is slightly lower than the theoretical %CYSOLIDS based on milk composition (+8.3%), so the efficiency of cheese-making (Ef-%CYSOLIDS) is lower (−2.5%) in High-HP than in Low-HP herds (Table 2). Considering also the differences in moisture retained in curd, High-HP herds had greater actual %CYCURD and Th-%CYCURD than Low-HP herds (+6.7% and +10.8%, respectively), but difference in Ef-%CYCURD (−3.1%) was not significant. As a result, cows in High-HP herds produced 50% more milk, 58% more cheese and 63% more cheese solids per day than the cows reared in Low-HP herds.
Effect of herd productivity (HP) level and of its interactions with parity and days in milk (DIM) on milk composition, and on cheese-making traits and production of individual cows

LSM=least squares means; RMSE=root mean square error; RECFAT=recovery of fat; RECPROTEIN=recovery of protein; RECSOLIDS=recovery of total solids; RECENERGY=recovery of energy; %CYCURD=fresh cheese yield; %CYSOLIDS=cheese yield in total solids; %CYWATER=water retention in the curd; Th-%CYCURD=theoretical cheese yield calculated as (0.93×% fat+% casein−0.1)×1.09 7 [8100−%moisture)/100]; Th-%CYSOLIDS=theoretical cheese yield in total solids calculated as (0.93×%fat+%casein−0.1)×1.09; Ef-%CYCURD=efficiency of cheese-making in fresh cheese yield, calculated as %cheese yield/%theoretical cheese yield; Ef-%CYSOLIDS=efficiency of cheese-making in total solids, calculated as %cheese yield solids/%theoretical cheese yield in total solids; dMilk yield=daily milk production; dCYCURD=daily production of fresh cheese; dCYSOLIDS=daily production of cheese in total solids; dCYWATER=daily retention of water in the curd.
*P<0.05; ** P<0.01; *** P<0.001.
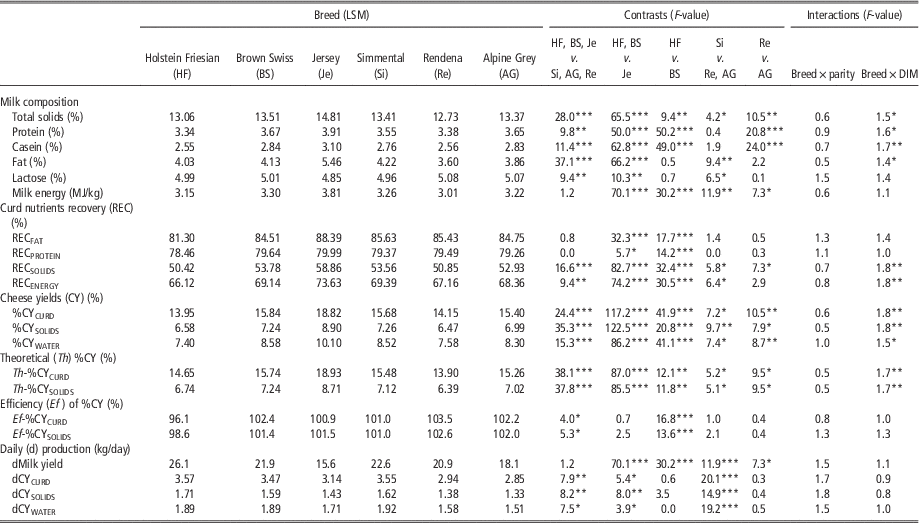
Effect of breed and of interactions between breed and parity and days in milk (DIM) on milk composition, and on cheese-making traits and production of individual cows

RECFAT=recovery of fat; RECPROTEIN=recovery of protein; RECSOLIDS=recovery of total solids; RECENERGY=recovery of energy; %CYCURD=fresh cheese yield; %CYSOLIDS=cheese yield in total solids; %CYWATER=water retention in the curd; Th-%CYCURD=theoretical cheese yield calculated as (0.93×%fat+% casein−0.1)×1.09 7 [8100−%moisture)/100]; Th-%CYSOLIDS=theoretical cheese yield in total solids calculated as (0.93×%fat+%casein−0.1)×1.09; Ef-%CYCURD=efficiency of cheese-making in fresh cheese yield, calculated as %cheese yield/%theoretical cheese yield; Ef-%CYSOLIDS=efficiency of cheese-making in total solids, calculated as %cheese yield solids/%theoretical cheese yield in total solids; dMilk yield=daily milk production; dCYCURD=daily production of fresh cheese; dCYSOLIDS=daily production of cheese in total solids; dCYWATER=daily retention of water in the curd.
*P<0.05; **P<0.01; ***P<0.001.
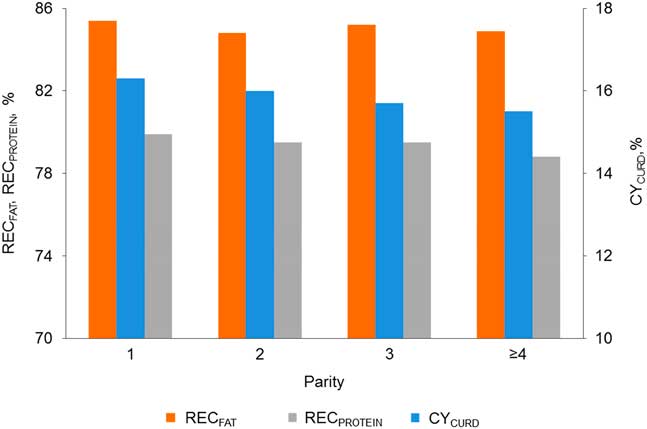
Parity (Supplementary Table S2) had a moderate effect on the quality of milk and on cheese-making traits. Milk from primiparous cows had only a slightly greater content of casein and lactose than milk from multiparous cows. RECPROTEIN and RECENERGY were also slightly greater in primiparous cows, as was actual %CYCURD and Ef-%CYCURD, although the latter seems due to greater water retention in their model cheeses than to differences in Ef-%CYSOLIDS (Figure 3). Daily production per cow was, as expected, lower for primiparous than multiparous cows with respect to milk (−10%), fresh cheese (−8%) and cheese solids (−9%). The HP×parity interaction did not affect any traits.
Effect of parity on recovery of protein (RECPROTEIN), energy (RECENERGY) and fresh cheese yield (%CYCURD).

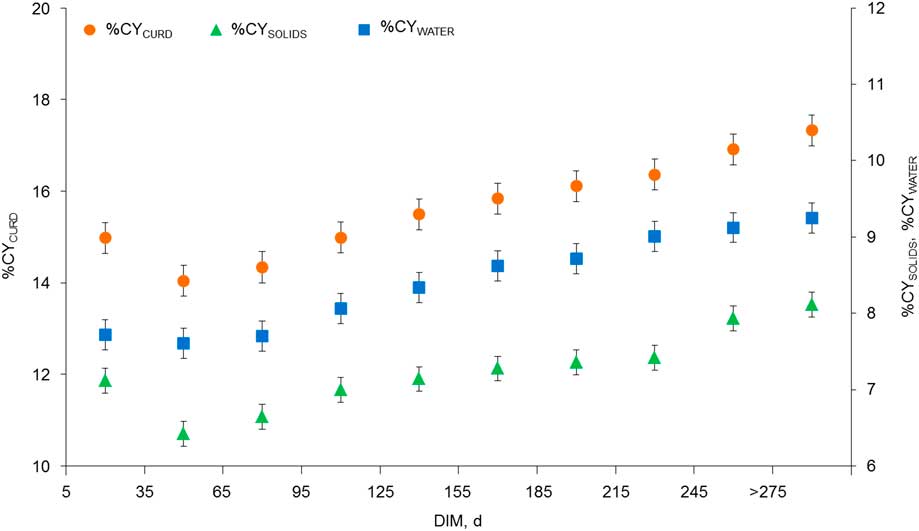
The variation during lactation was highly significant for all the cheese-making traits examined, with the sole exception of RECFAT. With respect to the 3%CY traits, it can be seen from Figure 4 that after the 1st month these traits increased almost linearly until the end of lactation, when they all reached their greatest values. As the effect of DIM class was very similar to that obtained in a previous study (Cipolat-Gotet et al. Reference Cipolat-Gotet, Cecchinato, De Marchi and Bittante2013), data were not shown nor discussed here. We also noted a weak, irrelevant interaction between DIM and HP class for the three %CY traits, and three of the four nutrient recovery traits (RECFAT and RECSOLIDS) (Table 1). In fact, we found the increase in %CYCURD from the beginning to the end of lactation to be slightly greater in cows from High-HP herds than in cows from Low-HP herds (2.6% v. 2.0%). This was also the case for %CYWATER (2.3% v. 0.8%), but not for %CYSOLIDS (0.8% v. 1.1%) (Figure 4).
Effect of days in milk (DIM) on the three actual cheese yield (%CY) traits. %CYCURD=fresh cheese yield; %CYSOLIDS=cheese yield in total solids; %CYWATER=water retention in the curd.

Effect of cow breed
Comparing the average of the three specialized dairy breeds (HF, BS and Je) with that of the dual-purpose breeds (Si, Re and AG), we note that five of the six milk quality traits and 10 of the 15 cheese-making traits were better in the former group of breeds (Table 2), even though both efficiencies traits were slightly greater in dual-purpose breeds. With respect to almost all the traits examined, the three specialized dairy breeds exhibited a wider range of variability than the three dual-purpose breeds. Our findings confirmed that Jersey cows had a lower milk productivity potential compared with the large-framed dairy breeds, that is, Holstein Friesian (−40%) and Brown Swiss (−29%), but greater %CYCURD (+35% and +19%, respectively). This is not only due to higher milk fat and protein contents, but also due to greater REC traits in the curd of Jersey cows. As a result, the differences between the dCY of Jersey cows on the one hand and Holstein Friesian and Brown Swiss cows on the other (−12% and −10%, respectively, for dCYCURD) are much less than the differences in dMY. Both Th-%CYCURD and Th-%CYSOLIDS, based on milk composition, confirmed the superiority of the Jerseys over the two large dairy breeds, whereas Ef-%CYCURD and Ef-%CYSOLIDS were similar in Je respect to the larger breeds.
Compared with Holstein Friesians, the Brown Swiss cows had a lower productivity potential (−16.1%), compensated for by greater CYCURD (+13.5%), CYSOLIDS (+10%) and CYWATER (+15.9%), due to the greater nutrient content of their milk as well as better nutrient recovery in the curd (+3.9% for fat, +1.5% for protein, +6.6% for solids and +4.6% for energy). The final result was that there were no statistical differences between the two large-framed dairy breeds in any of the three dCY traits. As the difference between the Th-%CYs of the two breeds was less than the difference between the actual values, the Brown Swiss breed had greater cheese-making efficiency than the Holstein Friesians (Table 2).
Regarding the dual-purpose breeds, we note that, compared with the two medium-framed local breeds (Re and AG), the Simmental cows had a greater dMY (+15.9%) and dCYs (+22% for dCYCURD, +20% for dCYSOLIDS and +24% for dCYWATER). The greater differences in dCY traits than in dMY are mainly due to differences in milk composition rather than cheese-making efficiency. The differences found between the two local breeds were modest: Rendena cows produced more milk than Alpine Greys, but had lower %CY traits (especially due to lower protein content), similar RECFAT and RECPROTEIN, and lower RECSOLIDS (Table 2).
The breed×parity interaction did not affect any of these traits, whereas breed×DIM affected, in particular, the three actual and two theoretical %CY traits, RECSOLIDS and RECENERGY, but not cheese-making efficiency and dCY.
Discussion
Effects of environment on cheese-making traits
The present study provided confirmation that the effect of herd–date always accounts for a lower proportion of total variability than the effect of animal and the residual variability, with the exception of dMY and dCY, and of %CY traits (Figure 2). Given that herd clusters together several management factors (i.e. housing conditions, feed administration and quality) as well as the collection and processing of milk samples, and in this study, also with season (Summer et al., Reference Summer, Franceschi, Bollini, Formaggioni, Tosi and Mariani2003), the % of variability in cheese-making traits explained by this factor may be considered low for REC traits, moderate for %CY and moderate–high for dMY and dCY. This means that the improvement in REC and %CY traits is basically due to individual animal factors (i.e. breed, genetics, parity, stage of lactation, etc.), while herd (facilities, management, nutrition, health, etc.) plays a much more important role in the level of production. Cipolat-Gotet et al. (Reference Cipolat-Gotet, Cecchinato, De Marchi and Bittante2013) found the herd factor to have a greater effect on the same traits compared with this study, although they included herd–date in the statistical model, but not class of HP. To our knowledge, no previous studies have investigated the effects of HP (high or low) on CY and cheese-making traits.
Effects of breed within herd
No previous studies have processed milk obtained from individual animals of several breeds, although there is some information on comparisons between some breeds. Using laboratory model cheeses produced from 45 individual cows, Wedholm et al. (Reference Wedholm, Larsen, Lindmark-Mansson, Karlsson and Andren2006) compared the CY of Swedish Holstein Friesian, Danish Holstein Friesian, and Swedish Red and White specialized dairy breeds. None of the %CY traits measured was affected by breed, but it should be noted that the milk was defatted before cheese-making, and that the statistical model used also included linear regressions on total casein and on each of the casein fractions and genetic variants.
More information is available from studies using bulk milk from experimental or commercial farms and processed in small-scale or conventional dairy plants. Of the specialized dairy breeds, in particular, large differences were observed between Jersey cows and Holstein Friesians. Auldist et al. (Reference Auldist, Johnston, White, Fitzsimons and Boland2004) found the CYs from bulk milk from 29 Jersey and 29 Holstein cows reared at pasture to be 12.0% and 10.8%, respectively, that is, +11% for Jerseys v.+34% in the present study. However, in accordance with Cheddar production criteria, the protein : fat ratio was normalized before cheese making so that their figures reflect the difference between the two breeds only in terms of protein content.
Recently, Bland et al. (Reference Bland, Grandison and Fagan2015) carried out a study on the effects of blending different proportions of Holstein and Jersey bulk milk on cheese production in a pilot-scale cheese-making facility without protein : fat standardization and total solids equalization (as in the present study). The %CYCURD of Jersey milk was +26% with respect to Holstein milk, compared with+34% in the present study, but moisture-adjusted CY (conceptually similar to our %CYSOLIDS) was found to be +33% for Jerseys v.+35% in the present study. The differences between the two breeds in both studies are very close to that regarded by Lucey and Kelly (Reference Lucey and Kelly1994) as typical of the two breeds (+32%). Bland et al. (Reference Bland, Grandison and Fagan2015), using the traditional Van Slyke and Price (Reference Van Slyke and Price1949) equation, obtained +17% for Jerseys for Th-%CYCURD v.+29% in the present study. The difference between the theoretical and actual yields depends on differences in the REC traits. In fact, Bland et al. (Reference Bland, Grandison and Fagan2015) found an RECFAT of 99.3% v. 76.6%, and an RECPROTEIN of 81.3% v. 71.6% for Jersey and Holstein milk, respectively, that is, differences in the same direction but much larger than those obtained in the present study, probably due to the very different cheese-making procedures.
In any case, the better REC traits in Jersey milk could be explained, in part, by milk coagulation, curd firming and syneresis properties. Several authors have found better traditional MCP levels in Jersey milk than in Holstein milk, as reviewed by Bittante et al. (Reference Bittante, Penasa and Cecchinato2012). Similar results also were found when the entire pattern of the curd firming process was modeled (Stocco et al., Reference Stocco, Cipolat-Gotet, Bobbo, Cecchinato and Bittante2017).
Comparison of the two large-framed specialized dairy breeds, Holstein Friesian and Brown Swiss, could be similarly interpreted. The superiority of the latter for cheese-making is, in fact, not only based on greater fat and protein contents in milk, but also on efficient milk coagulation, curd firming, syneresis and overall cheese-making process, leading to lower fat and protein losses in the whey (Cecchinato et al., Reference Cecchinato, Albera, Cipolat-Gotet, Ferragina and Bittante2015). Mistry et al. (Reference Mistry, Brouk, Kaperson and Martin2002) and Malacarne et al. (Reference Malacarne, Summer, Fossa, Formaggioni, Franceschi, Pecorari and Mariani2006) found greater RECFAT (but not RECPROTEIN), as well as greater actual than theoretical %CY in milk from Brown Swiss cows than in milk from Holstein Friesians.
Within dual-purpose breeds, we were able to confirm that the Italian Simmental breed, derived mainly from Austrian and German Fleckvieh and French Montbéliarde (Cecchinato et al., Reference Cecchinato, Albera, Cipolat-Gotet, Ferragina and Bittante2015), had a good technological aptitude, better than Holstein Friesian and closer to Brown Swiss (Malchiodi et al., Reference Malchiodi, Cecchinato, Penasa, Cipolat-Gotet and Bittante2014; Stocco et al., Reference Stocco, Cipolat-Gotet, Bobbo, Cecchinato and Bittante2017). The milk from Montbéliarde cows is known for having a greater %CY than milk from Holstein cows, as expected on the basis of the fat and protein contents (Martin et al., Reference Martin, Pomies, Pradel, Verdier-Metz and Remond2009), although other studies found no differences in the RECSOLIDS of milk from the two breeds (Verdier-Metz et al., Reference Verdier-Metz, Coulon, Pradel, Viallon and Berdague1998).
The differences between the two small local breeds were slight. Rendena cows’ milk has a similar composition to Holstein cows’ milk, but has better coagulation and curd firming patterns (Stocco et al., Reference Stocco, Cipolat-Gotet, Bobbo, Cecchinato and Bittante2017), which could explain its greater RECFAT and RECPROTEIN. It is worth noting that the Rendena had the highest overall cheese-making efficiency of all the six breeds examined in the present study.
Direct and indirect effects of breed
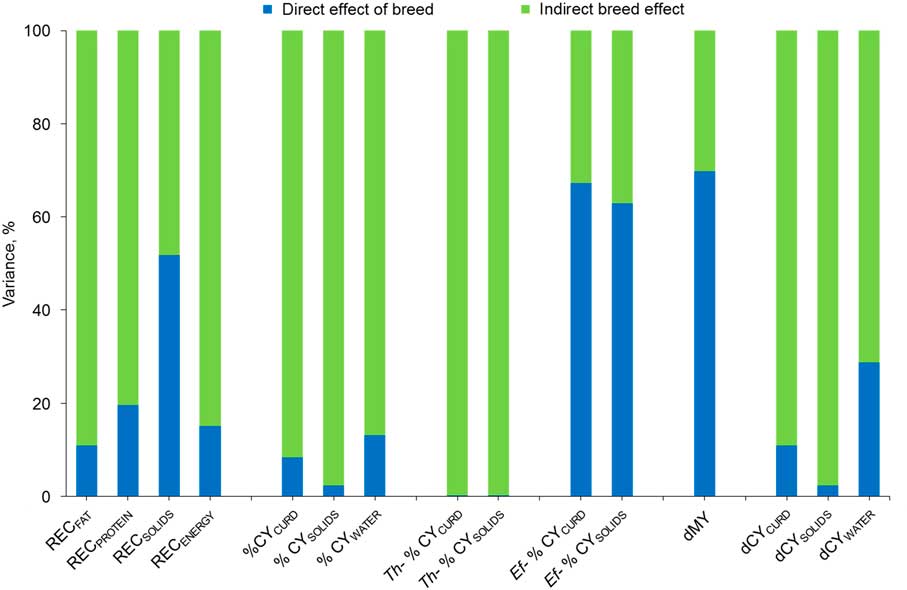
As there were substantial differences among breeds, it is important to quantify the direct genetic effects of breed on cheese-making traits and the indirect effects mediated by differences in terms of milk yield and composition, and to distinguish between them. It can be seen from Figure 5 that the proportions of direct and indirect effects (obtained with inclusion or exclusion of dMY and milk composition in the model analysis) are very different for the various traits examined.
Proportion of total breed variance explained by direct breed effect or by indirect breed effect through differences in milk yield and quality traits on recovery of nutrients, cheese yield (%CY) and daily cheese yield (dCY) traits. RECFAT=recovery of fat; RECPROTEIN=recovery of protein; RECSOLIDS=recovery of total solids; RECENERGY=recovery of energy; %CYCURD=fresh cheese yield; %CYSOLIDS=cheese yield in total solids; %CYWATER=water retention in the curd; Th-%CYCURD=theoretical cheese yield; Th-%CYSOLIDS=theoretical cheese yield in total solids; Ef-%CYCURD=efficiency of cheese-making in fresh cheese yield; Ef-%CYSOLIDS=efficiency of cheese-making in total solids; dMY=daily milk yield; dCYCURD=daily production of fresh cheese; dCYSOLIDS=daily production of cheese in total solids; dCYWATER=daily retention of water in the curd.

Milk yield and composition (indirect effects of breed) accounted for a large proportion of the total breed variance for all REC traits, while the extent of the direct effect of breed ranged from 11% for RECFAT to 52% for RECSOLIDS. As expected, the theoretical CY were totally dependent on the indirect breed effects, as they were calculated only from milk fat and casein contents (and the moisture content of cheese), so as actual %CY traits were much lower dependent on the direct effect of breed. Being the ratio between the actual and Th-%CYs, the two Ef-%CYs were dependent on the direct breed effect for about two-thirds of total breed variance.
Moving on to production traits, the total variance of the effect of breed on dMY was only about 30% dependent on milk composition, whereas it was substantial in the case of dCY traits because, in this case, the model included also dMY. In any case, it is worth noting that the direct effect of breed accounted for proportions of variance similar to or greater than those observed for %CY traits, and has significant economic importance.
No direct comparison can be made with other studies, as this is the first study to attempt to differentiate between the direct and indirect effects of breed on cheese-making traits. However, Stocco et al. (Reference Stocco, Cipolat-Gotet, Bobbo, Cecchinato and Bittante2017) showed that the direct effect of breed accounted for a substantial proportion of total breed variance for milk coagulation, curd firming and syneresis traits, ranging from about 40% to 80%. These traits are important in explaining REC and %CY traits at the phenotypic, genetic, herd and residual levels, as demonstrated in a previous paper (Cecchinato and Bittante, Reference Cecchinato and Bittante2016). It is also worth noting that a variable fraction of the effect of breed on coagulation properties is explained by genetic variants of milk proteins (Ikonen et al., Reference Ikonen, Ahlfors, Kempe, Ojala and Ruottinen1999).
Implications for crossbreeding and selection
The effect of breed, when corrected for common (herd) and individual (parity, DIM, etc.) phenotypic sources of variation, is likely the major genetic difference between animals and may also be an indicator of possible genetic variation between and within populations. Understanding the CY traits of milk from different breeds could be important in planning crossbreeding programs to meet industry requirements, especially in areas where a large part of the milk produced is destined for cheese making. No direct information is available on comparisons of different breed combinations or on the role of heterosis on these traits, although a study carried out on milk coagulation and curd firming traits (Malchiodi et al., Reference Malchiodi, Cecchinato, Penasa, Cipolat-Gotet and Bittante2014) showed that the properties of milk from crossbred cows from different breed combinations may sometimes differ from expectations.
Moving on to within-breed variability, no genetic studies have used data from processed milk from several breeds at the individual level, although Bittante et al. (Reference Bittante, Cipolat-Gotet and Cecchinato2013) estimated the heritability of cheese-yield traits in the Brown Swiss breed. As dMY and milk fat and protein (casein) are included in the selection indices of dairy breeds in almost all developed countries (Miglior et al., Reference Miglior, Muir and Van Doormal2005), it could be said that Th-%CY is selected worldwide, although with different weights according to local industry requirements. The dairy industry could gain an economic advantage by including the recovery of nutrients, particularly fat and protein, in the selection indices. The genetic indices in use implicitly assume that the REC of these nutrients is constant, or not heritable. Not only are these traits variable, but RECPROTEIN and RECFAT were found to have greater heritabilities than milk protein and fat content (Bittante et al., Reference Bittante, Cipolat-Gotet and Cecchinato2013). A more general alternative would be to add the Ef-%CY traits to the selection indices.
As laboratory analyses are not feasible at the population level, a promising approach for genetic selection is to make predictions using Fourier-transform IR (FTIR) spectra of the milk samples routinely collected during milk recording. It has been shown that it is possible to predict these traits with acceptable to good accuracy, with the sole exception of RECFAT (Ferragina et al., Reference Ferragina, Cipolat-Gotet, Cecchinato and Bittante2013, Reference Ferragina, de los Campos, Vazquez, Cecchinato and Bittante2015). The heritability of predicted traits has been shown to be comparable to or greater than those of the corresponding laboratory-measured traits (Bittante et al., Reference Bittante, Ferragina, Cipolat-Gotet and Cecchinato2014), and, more importantly, the genetic correlations between predicted and measured traits have always been greater than calibration accuracy. The feasibility of FTIR prediction of %CY and REC traits has been tested at the population level on Holstein Friesian, Brown Swiss and Simmental breeds with good results (Cecchinato et al., 2015).
Another promising alternative is to predict breeding values directly at the genetic level instead of predicting phenotypes. A genome-wide association study on these traits carried out by Dadousis et al. (Reference Dadousis, Biffani, Cipolat-Gotet, Nicolazzi, Rosa, Gianola, Rossoni, Santus, Bittante and Cecchinato2017a) revealed the complex genetic pathways leading to milk coagulation and cheese-making traits (Dadousis et al., Reference Dadousis, Pegolo, Rosa, Gianola, Bittante and Cecchinato2017b). The results open new perspectives on direct genomic selection for milk yield efficiency of dairy cattle. Egger-Danner et al. (Reference Egger-Danner, Cole, Pryce, Gengler, Heringstad, Bradley and Stock2015) concluded their review paper by stating that a combination of phenotyping and genotyping would be a highly suitable option for the new phenotypes.
Conclusions
In conclusion, increasing HP increases milk yield and quality, %CY, and daily cheese production per cow, but has only a slight effect on nutrient recovery and a negative effect on overall cheese-making efficiency, that is, the actual CY is somewhat lower than expected and the factors responsible for this need to be identified. Within-HP classes, variability among different herds is much lower for recovery traits, %CY and cheese-making efficiency than for daily milk and cheese production. Within individual herds, animal factors are responsible for the greater part of the variability in all traits, and of these factors the breed of cow has proven to be the most important. The differences among different breeds are the result not only of the well-known differences in production potential and nutrient concentrations, but also of the differences in nutrient recovery ability and overall cheese-making efficiency. Although the Holstein Friesian breed was the most productive, it had the least cheese-making efficiency, while the most efficient out of the dairy breeds appeared to be the Brown Swiss, and out of the dual-purpose local breeds the Rendena. The greater %CY and efficiency of the Brown Swiss breed, and also of the Simmental, means they are able to overcome their lower milk productivity and to yield a daily quantity of cheese per cow similar to the Holstein Friesians. The Jersey cows, despite their small body size, were also able to partly compensate for their low milk productivity with high fat and protein contents and recovery rates of their milk, so that the daily cheese production per cow was only about a tenth lower than that of the large-framed cows. Analysis of the differences between the various breeds also provided new insights into the possibilities and directions of genetic selection within breed and of breed combinations in crossbreeding programs.
Acknowledgments
The authors thank the Autonomous Province of Trento (Italy) for funding.
Supplementary Material
To view supplementary material for this article, please visit https://doi.org/10.1017/S1751731117001471