1. Introduction
The mesoscale eddies, which have horizontal scales from one to hundreds of kilometres, contains a significant part of the ocean energy. However, its energy budget remains not well understood: wind forcing and large-scale circulations injection energy into the mesoscale eddies, and the mesoscale eddies dissipate at the boundaries (Duhaunt & Straub Reference Duhaunt and Straub2006; Nikurashin, Vallis & Adcroft Reference Nikurashin, Vallis and Adcroft2013) and are converted to other types of motions, such as lee waves (Nikurashin & Ferrari Reference Nikurashin and Ferrari2011), but the known amount of energy injection is much larger than that of energy dissipation (Wunsch & Ferrari Reference Wunsch and Ferrari2004; Ferrari & Wunsch Reference Ferrari and Wunsch2009). Several other candidates are also thought to be responsible for the mesoscale eddy energy closure, such as the simultaneous loss of balance where the balanced flow leads to excitation of inertia-gravity waves (cf. Vanneste Reference Vanneste2013).
Near-inertial waves (NIWs), which contain around 50 % of wave energy in the ocean are believed to be important for the ocean energetics (Fu Reference Fu1981; Ferrari & Wunsch Reference Ferrari and Wunsch2009). There are a variety of mechanisms potentially explaining how NIWs can extract energy from balanced flow, and they have been studied in various set-ups and parameter regimes. Gertz & Straub (Reference Gertz and Straub2009) ran numerical simulations in a periodic box with  $O(1)$ Rossby number and found that the energy transfer between two-dimensional (2-D) and three-dimensional (3-D) motions is crucial. Also in the parameter regime with
 $O(1)$ Rossby number, Taylor & Straub (Reference Taylor and Straub2016) considered a channel flow with external forcing acting on both low and high frequencies, and they found that the Reynolds stresses of NIW act as a kinetic energy sink for mesoscale motions. Xie & Vanneste (Reference Xie and Vanneste2015) proposed the stimulated loss of balance (SLOB) mechanism, where the mean energy continuously loses to the potential energy of NIWs as small-scale NIW generates. In Barkan, Winters & McWilliams (Reference Barkan, Winters and McWilliams2017), numerical simulations in a channel flow with external forcing found the dominance of direct extraction, where the mean energy converts to the NIW energy and then NIW transfers downscale. Near-inertial waves are also found to absorb mean flow energy in frontogenesis where the horizontal gradient of density intensifies (Thomas Reference Thomas2012). There is also work that does not support the scenario where the balanced flow transfers energy to waves. By simulating a Galerkin approximation of the Boussinesq equations, where the vertical scale separation between the balanced flow and NIW is absent, Thomas & Arun (Reference Thomas and Arun2020) found that the waves transfer energy to the balanced flow.
Applying the generalised-Lagrangian-mean theory (Andrews & McIntyre Reference Andrews and McIntyre1978; Soward & Roberts Reference Soward and Roberts2010) in a variational framework (Salmon Reference Salmon1988, Reference Salmon2013, Reference Salmon2016), Xie & Vanneste (Reference Xie and Vanneste2015) derived an asymptotic coupled model in the parameter regime of small Rossby and Burger number to describe the interaction between NIWs and quasigeostrophic (QG) mean flow. This model naturally couples the classic models of QG mean flow (cf. Salmon Reference Salmon1998) and the Young–Ben Jelloul (YBJ) equation describing the slow evolution of NIW magnitude (Young & Ben Jelloul Reference Young and Ben Jelloul1997), which has been validated over decades of study. It has been extended to include the second harmonic of inertial oscillations by Wagner & Young (Reference Wagner and Young2016) using the concept of available potential vorticity (Wagner & Young Reference Wagner and Young2015) and has been used to study the details of the SLOB mechanism (Rocha, Wagner & Young Reference Rocha, Wagner and Young2018).
The variational framework ensures the model's Hamiltonian structure, and therefore it preserves the conservation laws of the original Boussinesq system by inheriting the symmetries, making the NIW–QG model capture certain key mechanisms in the ocean energetics and study statistics. So in this paper, we make use of the 2-D version of this model, where the QG flow is barotropic and the NIW has only one single vertical wavenumber, to study the direction of energy transfer with changing ratio of external energy injection into the NIW and QG components. Also we run forced-dissipative numerical simulations to statistically steady states such that the energy injection balances the energy dissipation, so our work differs from that by Rocha et al. (Reference Rocha, Wagner and Young2018) where initial value problems are studied.
Despite the advantages of the generalized-Lagrangian-mean framework, the asymptotic NIW–QG model introduces complexity when comparing its results with those obtained using a Eulerian-mean framework, which is easier to apply to analyse data obtained from direct numerical simulations (cf. Barkan et al. Reference Barkan, Winters and McWilliams2017). For example to make a comparison, we need to identify waves and calculate their induced Stokes drift to construct the relation between the Lagrangian-mean velocity and the Eulerian-mean velocity. But as to the kinetic energy, the difference between the quadratic of the Lagrangian-mean velocity and that of the Eulerian-mean velocity is so far not well interpreted. This paper does not address this energy comparing issue and the energies defined here are reasonable in the Lagrangian-mean coordinates.
The direction of energy transfer across scales is a fundamental question in turbulence theory. A key feature of the atmospheric and oceanic turbulence is its bidirectional energy transfer, which has been observed in numerical simulations of the rotating stratified turbulence (e.g. Marino, Pouquet & Rosenberg Reference Marino, Pouquet and Rosenberg2015; Pouquet et al. Reference Pouquet, Marino, Mininni and Rosenberg2017; Alexakis & Biferale Reference Alexakis and Biferale2018) and measured data (Cho & Lindborg Reference Cho and Lindborg2001; Balwada, LaCasce & Speer Reference Balwada, LaCasce and Speer2016). Even though the turbulence theory linking bidirectional energy transfer with measurable structure functions has been proposed (Xie & Bühler Reference Xie and Bühler2019a), the mechanism for bidirectional energy transfer is less understood. The two primary reasons for bidirectional energy transfer are the impact of inertia-gravity waves and the short aspect ratio of the domain (Benavides & Alexakis Reference Benavides and Alexakis2017). This paper studies the toy model for NIW–QG interaction, which provides a simple set-up for the wave-induced bidirectional energy transfer.
This paper is organized as follows. In § 2 we provide a heuristic argument based on the conserved quantities to predict the transfer direction of total energy and wave action in the NIW–QG model derived by Xie & Vanneste (Reference Xie and Vanneste2015). In § 3, we show the results of forced-dissipative numerical simulations of the YBJ $^+$–QG model (Asselin & Young Reference Asselin and Young2019), which avoids the ‘ultraviolet catastrophe’ of the original NIW–QG model, to confirm the existence of bidirectional energy and wave action transfer. We also find a new mechanism – catalytic wave induction – that transfers mean energy from large to small scales but without energy conversion from mean flow to NIWs. In § 4, we discuss the difference between catalytic wave induction and the SLOB, the argument for bidirectional energy flux and the potential enstrophy flux. Finally, § 5 summarizes our results. Appendix A provides a derivation of the YBJ
 $^+$–QG model in a variational approach and discusses the directions of conserved quantities in this model. Appendix B presents several expressions in the spectral space.
2. A heuristic argument for the direction of energy transfer
In this section, we propose a heuristic argument applied to a forced-dissipative turbulent system with three inviscid preserved quantities to predict the transfer direction of preserved quantities across scales.
We focus on the dynamics of the interaction between NIW and QG mean flow using the model derived by Xie & Vanneste (Reference Xie and Vanneste2015). Since NIWs are described by the slow modulation of wave amplitude with a fixed frequency equalling to the Coriolis frequency, the model also preserves wave action due to the invariant of the wave phase. Even though the wave action is only asymptotically conserved in the original system, we believe it is still crucial for the dynamics of the wave-mean flow coupled system considering that the NIW peak is notable in ocean observations (cf. Fu Reference Fu1981).
In this paper, for simplicity and numerical efficiency, we focus on the 2-D version of the YBJ–QG model on an  $f$-plane, where the QG mean flow is barotropic (
 $z$-independent), and the NIW has a single mode in the vertical. Thus, the governing equations are (Xie & Vanneste Reference Xie and Vanneste2015)
 \begin{gather} \partial_{t}M + \mathcal{J}(\psi,M) - \frac{{\textrm{i}} N^2}{2m^2 f}\nabla^2M + \frac{{\textrm{i}}}{2}M\nabla^2\psi = 0,\end{gather}
 \begin{gather} \partial_{t}q + \mathcal{J}(\psi,q) = 0, \end{gather}
 \begin{gather} \mathrm{with}\quad q = \nabla^2 \psi + \underset{q^w}{\underbrace{\frac{{\textrm{i}} f}{2}\mathcal{J}(M^*,M) + \frac{f}{4}\nabla^2 |M|^2}}, \end{gather}
where  $M$ is the complex wave amplitude such that
 $u+{\textrm {i}} v = -{\textrm {i}} f\kern0.5pt M\exp ({-{\textrm {i}} f t+{\textrm {i}} m z})$ with
 $u$ and
 $v$ the two horizontal velocities,
 $\mathcal {J}(a,b)=a_xb_y-a_yb_x$ is the Jacobian,
 $N$ is the Brunt–Väisälä (buoyancy) frequency,
 $m$ is the vertical wavenumber of NIW,
 $f$ is the Coriolis frequency, superscript ‘
 $*$’ denotes the complex conjugate and
 $\psi$ is the stream function of QG mean flow. In this model it is debatable which part of potential vorticity corresponds to the mesoscale eddies. By defining the wave-induced potential vorticity as
 $q^w$, we may define a flow through
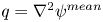 $q=\nabla ^2\psi ^{mean}$ and regard
 $\psi ^{mean}$ as the stream function of mesoscale eddies. This definition stems from the linear wave-vortical decomposition, where the wave has no potential vorticity and only the vortical flow contributes to potential vorticity. But in our model the wave contributes to the potential vorticity through nonlinearly, and we treat
 $\psi$ as the stream function of the mean flow because
 $\psi$ is the stream function of the Lagrangian-mean velocity.
If forced by homogeneous isotropic external forcing, the 2-D model (2.1) will reach homogeneous isotropic statistically steady states, in which describing energy flux in the spectral space is appropriate and theoretical predictions are easy to make. The governing equation (2.1) preserves the energy, potential enstrophy and wave action:
 \begin{gather} \mathcal{E} = \int \left\{ \frac{1}{2}|\boldsymbol{\nabla}\psi|^2+\frac{1}{4}\frac{N^2}{m^2}|\boldsymbol{\nabla} M|^2 \right\}\,{\textrm{d}} \boldsymbol{x}, \end{gather}
 \begin{gather} \mathcal{P} = \int q^2\,{\textrm{d}} \boldsymbol{x}, \end{gather}
 \begin{gather} \mathcal{A} = \int |M|^2\,{\textrm{d}} \boldsymbol{x}. \end{gather}
The total energy  $\mathcal {E}$ contains two quadratic forms of mean flow and wave, and we name them
 $\mathcal {E}_{QG}$ and
 $\mathcal {E}_{W}$, respectively. They are defined as
 \begin{equation} \mathcal{E}_{QG} = \int \tfrac{1}{2}|\boldsymbol{\nabla}\psi|^2 \,{\textrm{d}} \boldsymbol{x} \quad \mathrm{and} \quad \mathcal{E}_{W} = \int \frac{1}{4}\frac{N^2}{m^2}|\boldsymbol{\nabla} M|^2 \,{\textrm{d}} \boldsymbol{x}, \end{equation}
therefore  $\mathcal {E}=\mathcal {E}_{QG}+\mathcal {E}_{W}$. The potential enstrophy
 $\mathcal {P}$ is the integration of the quadratic of potential vorticity therefore it contains quadratic, cubic and quartic terms of both mean flow and wave amplitude. But the wave action
 $\mathcal {A}$ is purely a wave quadratic quantity.
To understand the transfer direction of conserved quantities, we consider a turbulent picture similar to those proposed by Kraichnan (Reference Kraichnan1967) and Eyink (Reference Eyink1996) to show the direction of energy and enstrophy cascades in 2-D turbulence, and the one used in wave turbulence (cf. chapter 1 in Cardy, Falkovich & Gawedzki (Reference Cardy, Falkovich and Gawedzki2008)). However, different from 2-D turbulence and wave turbulence, our system (2.1) preserves three quantities. We consider that the energy, wave action and potential enstrophy are injected into the system at an intermediate wavenumber  $k_f$ and they dissipate at both a small wavenumber
 $k_1$ (
 $k_1<k_f$) and a large wavenumber
 $k_2$ (
 $k_2>k_f$). We denote the energy, potential enstrophy and wave action dissipations at these two wavenumbers as
 $\mathcal {E}_{i}$,
 $\mathcal {P}_{i}$ and
 $\mathcal {A}_i$ (
 $i=1,2$), respectively. Therefore, in a forced-dissipative statistically steady state, the three conversations (2.2) imply that
 \begin{equation} \mathcal{E}_f = \mathcal{E}_1 + \mathcal{E}_2, \quad \mathcal{P}_f = \mathcal{P}_1 + \mathcal{P}_2 \quad \mathrm{and} \quad \mathcal{A}_f = \mathcal{A}_1 + \mathcal{A}_2, \end{equation}
where the symbols with subscript ‘ $f$’ denote the injections at the forcing wavenumber.
However, different from the 2-D turbulence case, where due to the quadratic energy and enstrophy the transfer directions of energy and enstrophy are determined by solving (2.4a–c), we cannot similarly determine the transfer directions of these three quantities, which is the main topic of this paper, and we will show that the preservation of three quantities brings about a more complicated picture for the transfer directions.
We first consider two limiting cases that hint at the transfer directions in general cases. The first case is the mean-flow-dominant case where the NIW is weak compared with the mean flow, therefore the wave action as a purely wave effect is not dominant, also, the wave effect is of high order in the energy and potential enstrophy. Then, to the leading order, the mean flow dominates the energy and potential enstrophy,
 \begin{gather} \mathcal{E} = \int {\tfrac{1}{2}|\boldsymbol{\nabla}\psi|^2} \,{\textrm{d}} \boldsymbol{x}, \end{gather}
 \begin{gather} \mathcal{P} = \int |\nabla^2\psi|^2 \,{\textrm{d}} \boldsymbol{x}. \end{gather}
Therefore the system recovers the scenario of 2-D turbulence: energy transfers upscale and potential enstrophy transfers downscale (Kraichnan Reference Kraichnan1967; Eyink Reference Eyink1996). Also, because the feedback to the mean flow is weak, NIW behaves like a passive scalar and the wave action transfers downscale.
The other extreme is the NIW-dominant case, we assume the potential enstrophy to be subdominant. In fact, if there is no external forcing on the mean flow, the potential vorticity remains zero except from possible viscous generation. Therefore, similar to the wave turbulence, energy and wave action control the turbulent dynamics. To the leading order energy and wave action they are expressed as
 \begin{gather} \mathcal{E} = \frac{1}{4}\frac{N^2}{m^2} \int |\boldsymbol{\nabla} M|^2 \,{\textrm{d}} \boldsymbol{x}, \end{gather}
 \begin{gather} \mathcal{A} = \int |M|^2\,{\textrm{d}} \boldsymbol{x}. \end{gather}
Therefore, the conservations (2.4a–c) imply that
 \begin{gather} \mathcal{E}_f = \frac{1}{4}\frac{N^2}{m^2}k_1^2\mathcal{A}_1 + \frac{1}{4}\frac{N^2}{m^2}k_2^2\mathcal{A}_2, \end{gather}
 \begin{gather} \mathcal{A}_f = \mathcal{A}_1 + \mathcal{A}_2, \end{gather}
where 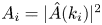 $A_i=|\hat {A}(k_i)|^2$, with
 $\hat {\cdot }$ the Fourier transform.
Following the ideas of Kraichnan (Reference Kraichnan1967) and Eyink (Reference Eyink1996), after considering the relation between energy and wave action injection
 \begin{equation} \mathcal{E}_f = \frac{1}{4}\frac{N^2}{m^2}k_f^2\mathcal{A}_f, \end{equation}
we can solve (2.7) to obtain
 \begin{equation} \mathcal{A}_1 = \frac{k_f^2-k_2^2}{k_1^2-k_2^2}\mathcal{A}_f \quad\mathrm{and}\quad \mathcal{A}_2 = \frac{k_f^2-k_1^2}{k_2^2-k_1^2}\mathcal{A}_f. \end{equation}
Then taking the limit  $k_1\to 0$ and
 $k_2\to \infty$ with fixed finite
 $k_f$, we obtain
 \begin{equation} \mathcal{A}_1 \to \mathcal{A}_f, \quad \mathcal{A}_2 \to 0,\quad \mathcal{E}_1 \to 0 \quad \mathrm{and} \quad \mathcal{E}_2 \to \mathcal{E}_f, \end{equation}
which implies that the energy transfers downscale while the wave action transfers upscale.
We need to note that in the NIW-dominant case, even though we assume that the potential enstrophy flux does not determine the direction of energy transfer, the potential vorticity invariant is important for nonlinear dynamics. For a wave-only case, one may consider that  $\psi =0$, therefore the wave is governed by a linear equation and there should be no energy transfer across scales. However, in the extreme scenario where we only force the NIW and there is no forcing in the mean equation, the potential vorticity conservation implies that NIWs generate mean flow and then the mean flow advect and refract NIWs, therefore we have a nonlinear wave dynamics to permit energy transfer across scales.
The directions of energy transfer are opposite in the NIW-dominant and mean-flow-dominant cases. This implies that when the strength of NIW is intermediate, energy can transfer both upscale and downscale simultaneously, which is consistent with the energy transfer scenario in the oceanic flows. In § 3 we numerically check the existence of and study the details of the bidirectional energy transfer.
To perform numerical simulations, the original YBJ–QG coupled model (2.1) is not exercisable due to a ‘ultraviolet catastrophe’: the dispersion term in (2.1a) implies that the resolved time scale behaves as the inverse of the square of wavenumber, which tends to infinity as the resolution increases. Therefore we consider running numerical simulations of the YBJ $^+$–QG coupled model proposed by Asselin & Young (Reference Asselin and Young2019), which improves the numerical efficiency by retaining specific high-order terms and using the reconstitution technique to bound the frequency as wavenumber increases. Asselin & Young (Reference Asselin and Young2019) derive the modified YBJ
 $^+$ equation, but the form of wave-mean flow coupling is proposed. We present a variational derivation of the coupled model that mimics the procedure of deriving the YBJ–QG model in appendix A.1. To ensure the validity of using the YBJ
 $^+$–QG model to study the transfer of conserved quantities, we check the argument of transfer direction in the YBJ
 $^+$–QG coupled model in appendix A.2.
3. Numerical simulation
To explore the transfer of conserved quantities in statistically steady turbulent states, we add external forcing artificially at both large and small scales to the inviscid YBJ $^+$-QG model
 \begin{gather} \partial_{t}M + \mathcal{J}(\psi,M) + \mathcal{P}M + \frac{{\textrm{i}}}{2}M\nabla^2\psi = 0,\end{gather}
 \begin{gather} \partial_{t}q + \mathcal{J}(\psi,q) = 0, \end{gather}
 \begin{gather} \mathrm{with}\quad q = \nabla^2 \psi + \frac{{\textrm{i}} f}{2}\mathcal{J}(M^*,M) + \frac{f}{4}\nabla^2 |M|^2, \end{gather}
whose 3-D version is proposed by Asselin & Young (Reference Asselin and Young2019). Here,
 \begin{equation} \mathcal{P} = \frac{{\textrm{i}} f}{2}\frac{\nabla^2}{-\dfrac{f^2}{N^2}m^2+\dfrac{1}{4}\nabla^2}, \end{equation}
and the Laplacian in the denominator is understood in the Fourier space. We variationally derive this coupled model in appendix A.1. Note that a modified version of the YBJ equation is also obtained in Wagner (Reference Wagner2016), their (3.133) differs from (3.1a) only by high-order terms in the expansion of small Rossby number.
Since (3.1) is derived from a variational approach, adding dissipation is artificial. We assume that the inviscid mechanism is not changed by the dissipations and the dissipations monotonically damp the total energy and wave action, so we choose to add dissipations in the equations of  $M$ and mean vorticity
 $\nabla ^2\psi$ instead of
 $q$. We will discuss the choice of dissipation terms in detail below. Our forced-dissipative model for numerical simulation is
 \begin{gather} \partial_{t}M + \mathcal{J}(\psi,M) + \mathcal{P}M + \frac{{\textrm{i}}}{2}\nabla^2\psi M= \mathcal{D}M + R \frac{m}{Nk_f^2} \mathcal{F}_1, \end{gather}
 \begin{gather} \partial_{t}\nabla^2\psi + \mathcal{J}(\psi,\nabla^2\psi) + N(\psi,M) = \mathcal{D}\nabla^2 \psi + \mathcal{F}_2, \end{gather}
where the specific form of dissipation is controlled by the operator  $\mathcal {D}$ and we choose
 \begin{equation} \mathcal{D} = \alpha \nabla^{-2} + \nu \nabla^6 \end{equation}
to damp both large- and small-scale fields,
 \begin{align} N(\psi,M) &= \frac{f^2}{4}[ \mathcal{J}(M^*,\mathcal{P}M)-\mathcal{J}(\mathcal{P}M^*,M) ] + \frac{{\textrm{i}} f^2}{8}\nabla^2( M\mathcal{P}M^* - M^*\mathcal{P}M )\nonumber\\ &\quad - \frac{f}{2}\boldsymbol{\nabla}\boldsymbol{\cdot}\mathcal{J}\left(\boldsymbol{\nabla}\psi,|M|^2\right), \end{align}
where in the forcing term,  ${m}/(Nk_f^2)$ is a normalized coefficient,
 $\mathcal {F}_i$ (
 $i=1$ or 2) are temporal white-noise external forcing that are isotropically centred around wavenumber
 $|\boldsymbol {k}|=k_f$, i.e.
 \begin{equation} \langle\mathcal{F}_i(\boldsymbol{x}_1,t_1)\mathcal{F}_i(\boldsymbol{x}_2,t_2)\rangle = C_0 \text{J}_0(k_f|\boldsymbol{x}_1-\boldsymbol{x}_2|)\delta(t_1-t_2), \end{equation}
where  $\langle \cdot \rangle$ is an ensemble average,
 $C_0$ is the covariance and
 $\text{J}_0$ is the Bessel function of the zeroth order. Here,
 $R$ is a tuning parameter that controls the relative strength of energy injection into the NIW and mean-flow components. When
 $R=1$, the ratio between the wave energy injection and QG-mean flow energy injection is
 $1/2$.
In the governing equations (3.3) we design the forcing and dissipation in the mean vorticity equation instead of the potential vorticity equation to achieve that (i) if there is no external forcing and dissipation the conserved quantities are preserved; and (ii) the effect of dissipation terms damp total energy and wave action, i.e. there is no viscous generation of the total energy. However, as with the potential enstrophy, viscous generation can be non-zero. This can be seen from the potential vorticity equation
 \begin{equation} \partial_{t}q +\! \mathcal{J}(\psi,q) = \mathcal{D}\nabla^2\psi + \frac{{\textrm{i}} f}{2}( \mathcal{J}(\mathcal{D}M^*,M)+\mathcal{J}(M^*,\mathcal{D}M) ) +\! \frac{f}{4}\nabla^2 ( M^*\mathcal{D}M+\!M\mathcal{D}M^*). \end{equation}
In other words, we choose to damp two out of three preserved quantities and focus on the fluxes of these two quantities. It is debatable that this choice is realistic since we did not derive the dissipation terms from the original hydrostatic Boussinesq equations. A potential way to achieve a realistic-scenario study is to derive the dissipative coupled model from viscous primitive equations, e.g. following the derivation in Rocha (Reference Rocha2018). However, the physical meaning of large-scale hypoviscosity is uncertain. So considering the balance between the involute derivation and the aim of studying key mechanisms, we choose the above simple design as a heuristic starting point to understand the wave-mean flow coupled turbulence.
The numerical simulations use a Fourier pseudospectral method with 2/3 dealiasing in space, a resolution  $512\times 512$ in a domain of size
 $2{\rm \pi} \times 2{\rm \pi}$ and a fourth-order explicit Runge–Kutta scheme in time, in which the nonlinear terms are treated explicitly, and linear terms implicitly use an integrating factor method. We take the forcing wavenumber to be
 $k_f=16$ and control the energy injection rate by the external forcing
 $\mathcal {F}_i$ as
 $10^{-3}$, by choosing
 $\alpha =0.01$ and
 $\nu =10^{-12}$ we obtain small- and large-dissipation wavenumbers as
 $k_\alpha \approx 0.4$ and
 $k_\nu \approx 100$, respectively. We choose
 $f=1$,
 $N=1$ and
 $m=32$, therefore the forcing Burger number is
 $Bu_f=1/4$ which is much smaller than
 $4$, and we expect the turbulent dynamics of conserved quantities transfer for the YBJ
 $^+$-QG system to recover that for the YBJ–QG system (cf. appendix A.2).
3.1. Dependence on the parameter  $R$

In this section, we focus on the dependence of the fluxes of energy and wave action in the spectral space on the parameter  $R$. Here, the spectral energy flux
 $F_E$ and wave action flux
 $F_A$ are defined from the equations
 \begin{gather} \partial_{t}E(K) = -\partial_{K} F_E + \text{forcing and dissipation}, \end{gather}
 \begin{gather} \partial_{t}A(K) = -\partial_{K} F_A + \text{forcing and dissipation}, \end{gather}
where referring to (2.6) we define
 \begin{gather} E(K) = \sum_{|\boldsymbol{k}|= K} \left\{ \frac{1}{2}K^2|\hat{\psi}|^2+\frac{N^2}{4m^2}K^2|\hat{M}|^2 \right\}, \end{gather}
 \begin{gather} A(K) = \sum_{|\boldsymbol{k}|= K} |\hat{M}|^2, \end{gather}
where  $\hat {\cdot }$ denotes the Fourier transform. Therefore
 \begin{equation} \int_{0}^{\infty} E(K) \,{\textrm{d}} K = \mathcal{E} \quad \mathrm{and} \quad \int_{0}^{\infty} A(K) \,{\textrm{d}} K = \mathcal{A}. \end{equation}
Here,  $K= | \boldsymbol {k} |$ is the magnitude of the wavenumber. Also, when
 $F_E$ and
 $F_A$ are positive, energy and wave action transfer from small to large wavenumbers in the spectral space. The explicit expressions of (3.8) and different components of fluxes are presented in Appendix B.
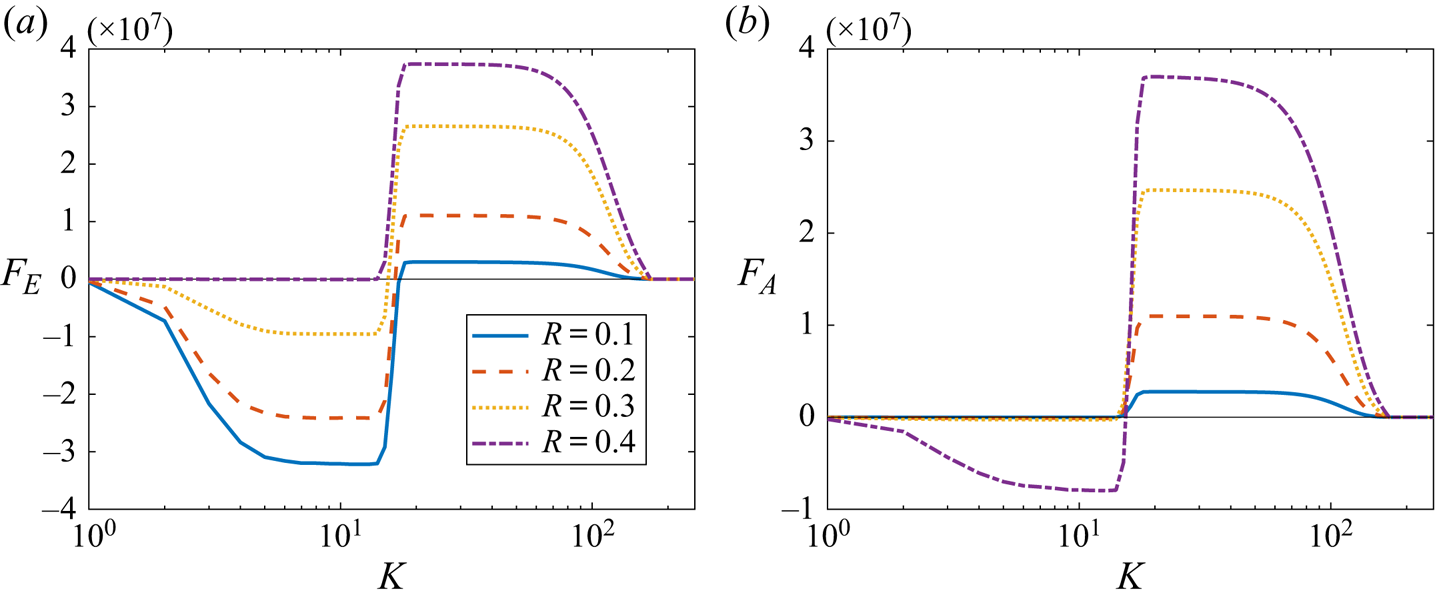
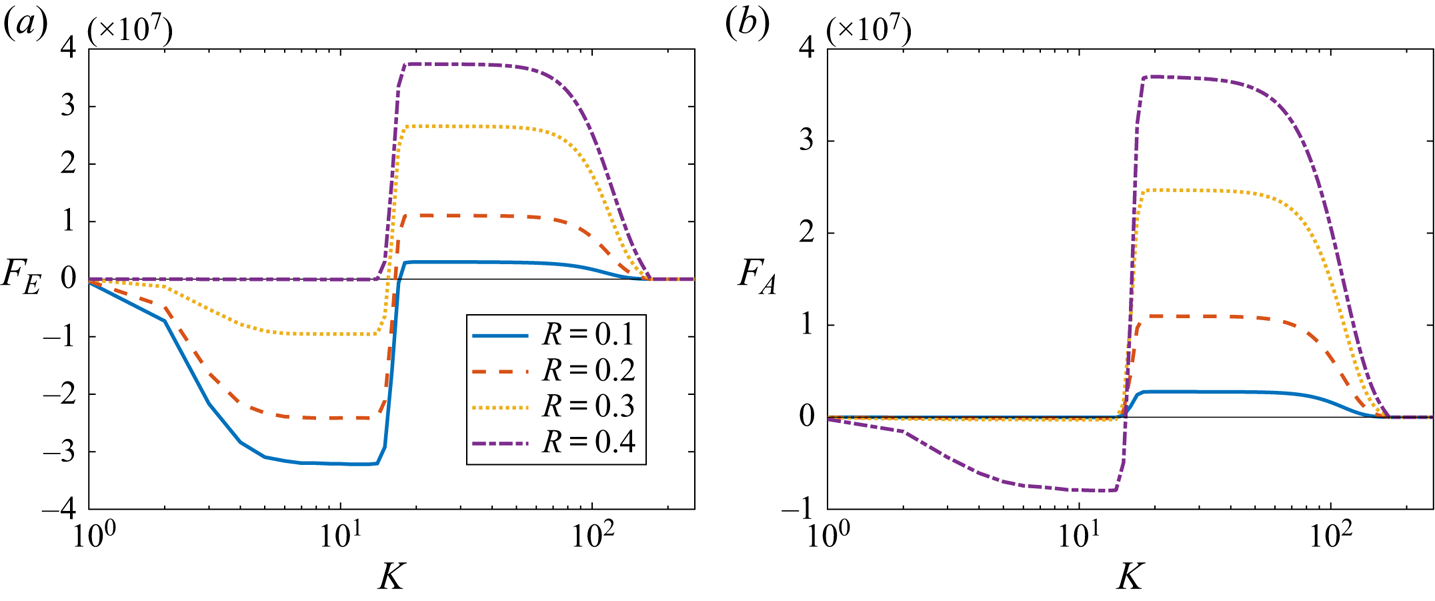
In figure 1, we show the dependence of total energy flux  $F_E$ and wave action flux
 $F_A$ on the parameter
 $R$. We observe the transition of energy transfer from upscale to bidirectional to downscale, which justifies our conjecture based on the argument in § 2. In the corresponding parameter regimes, the wave action first transfers downscale then bidirectionally.
Dependence of the total energy flux and the wave action flux on the parameter  $R$, with
 $R=0.1, 0.2, 0.3$ and
 $0.4$. The negative and positive values of
 $F_E$ represent upscale and downscale energy transfers, respectively. The black thin line is
 $0$, for reference. (a) Energy flux and (b) Action flux.
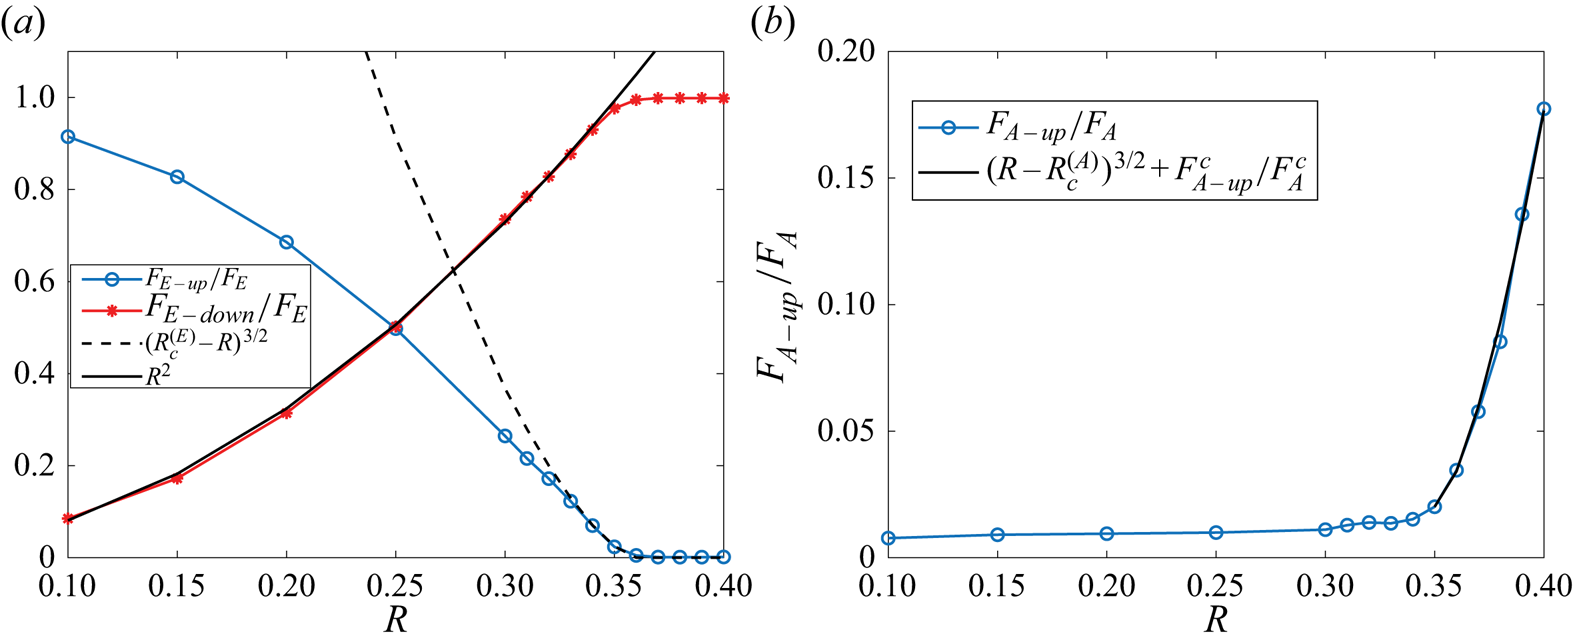
To show the details of the  $R$-dependence, in figure 2(a), we show the
 $R$-dependence of normalized upscale and downscale energy fluxes, which are defined as the upscale and downscale energy fluxes divided by the total energy injection, respectively. We find a critical value of
 $R^{(E)}_c\approx 0.36$. When
 $R<R_c$, the normalized upscale energy transfer monotonously decreases from
 $1$, which corresponds to the total upscale energy transfer in 2-D turbulence, and when
 $R>R_c$ the normalized upscale energy transfer is equal to zero. When
 $R<R^{(E)}_c$ the dependence of normalized downscale energy transfer scales as
 $R^2$, and close to the critical value we fit the normalized upscale energy transfer by
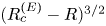 $(R^{(E)}_c-R)^{3/2}$. Here, the exponent
 $3/2$ is a locally fitted result and we do not have a theory to explain it. However, the power dependence of normalized downscale energy transfer on
 $R^{(E)}_c-R$ suggests a second-order phase transition.
The dependence of normalized energy and wave action flux on the parameter  $R$. Here,
 $R^{(E)}_c=0.36$ and
 $R^{(A)}_c=0.35$. The indices
 $E$ and
 $A$ represent the energy and action, respectively, and the subscripts
 $up$ and
 $down$ denote the upscale and downscale fluxes, respectively. The index
 $c$ represents the critical point. (a) Normalized energy flux and (b) Normalized wave action flux.
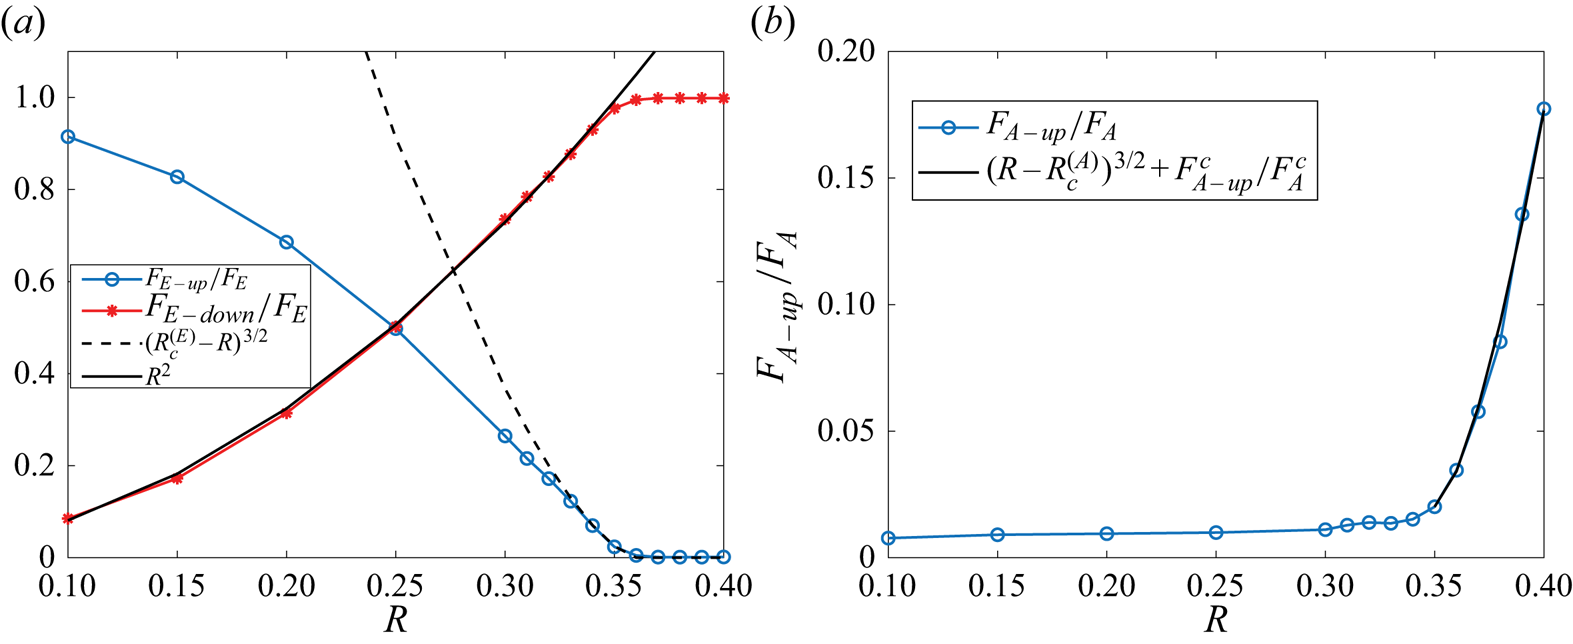
As to the normalized upscale action transfer shown in figure 2(b), we find a critical value  $R^{(A)}_c\approx 0.35$. When
 $R<R^{(A)}_c$, the normalized upscale action transfer is almost zero, which may be interpreted as a passive-scalar-like wave magnitude; when
 $R>R^{(A)}_c$, the normalized upscale action transfer monotonously increases. Around the critical value, the normalized upscale action transfer scales as
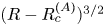 $(R-R^{(A)}_c)^{3/2}$, indicating a second-order phase transition. Here, due to the finite dissipation, when
 $R<R^{(A)}_c$, the normalized upscale action transfer is small but non-zero, so when fitting the power function near the critical point, we subtracted the small non-zero value at the critical point. Based on the normalized transfers we find two close critical values
 $R^{(E)}_c\approx 0.36$ and
 $R^{(A)}_c\approx 0.35$.
3.2. Simulation with $R=0.3$

To compare the difference between the turbulent states across the critical point, we study in detail two cases with  $R<R_c$ and
 $R>R_c$ in this and the next subsections, respectively. Here, since
 $R^{(E)}_c$ and
 $R^{(A)}_c$ are close, from now on we assume that the two-phase transitions happen at the same
 $R_c$. So, for example, by
 $R<R_c$ we mean the parameter regime before the transition.
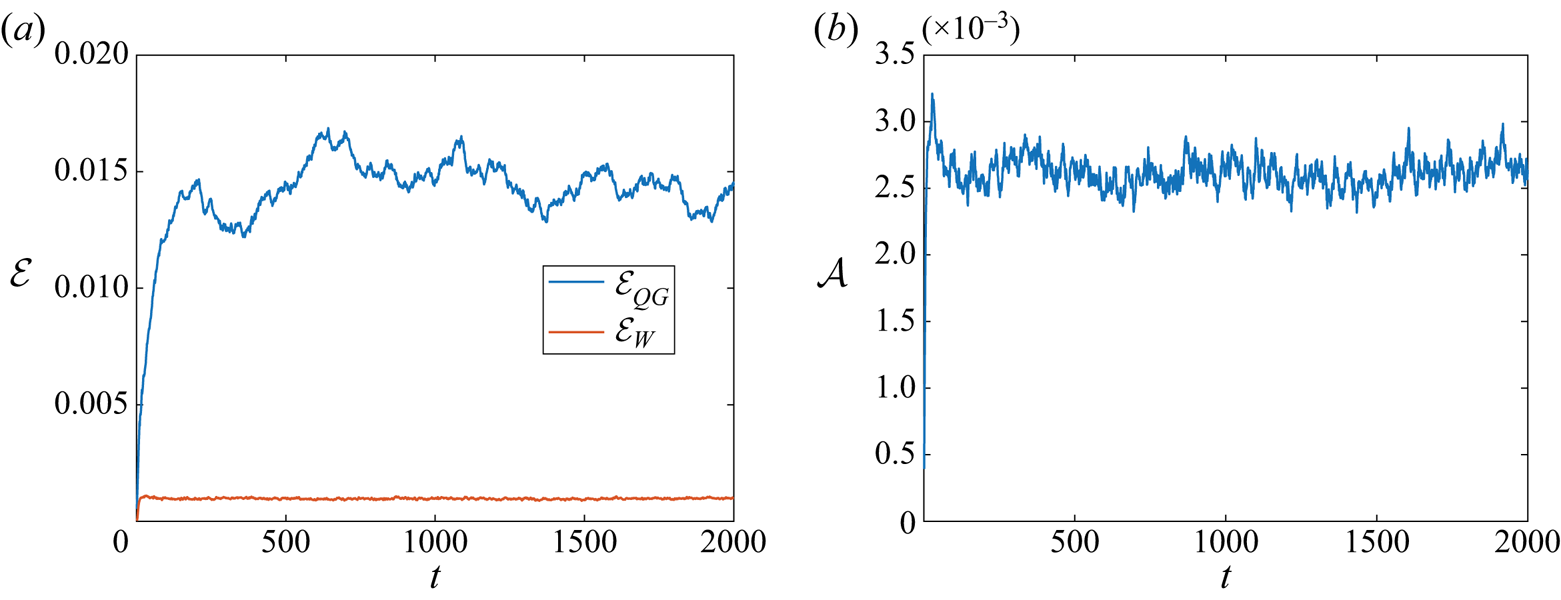
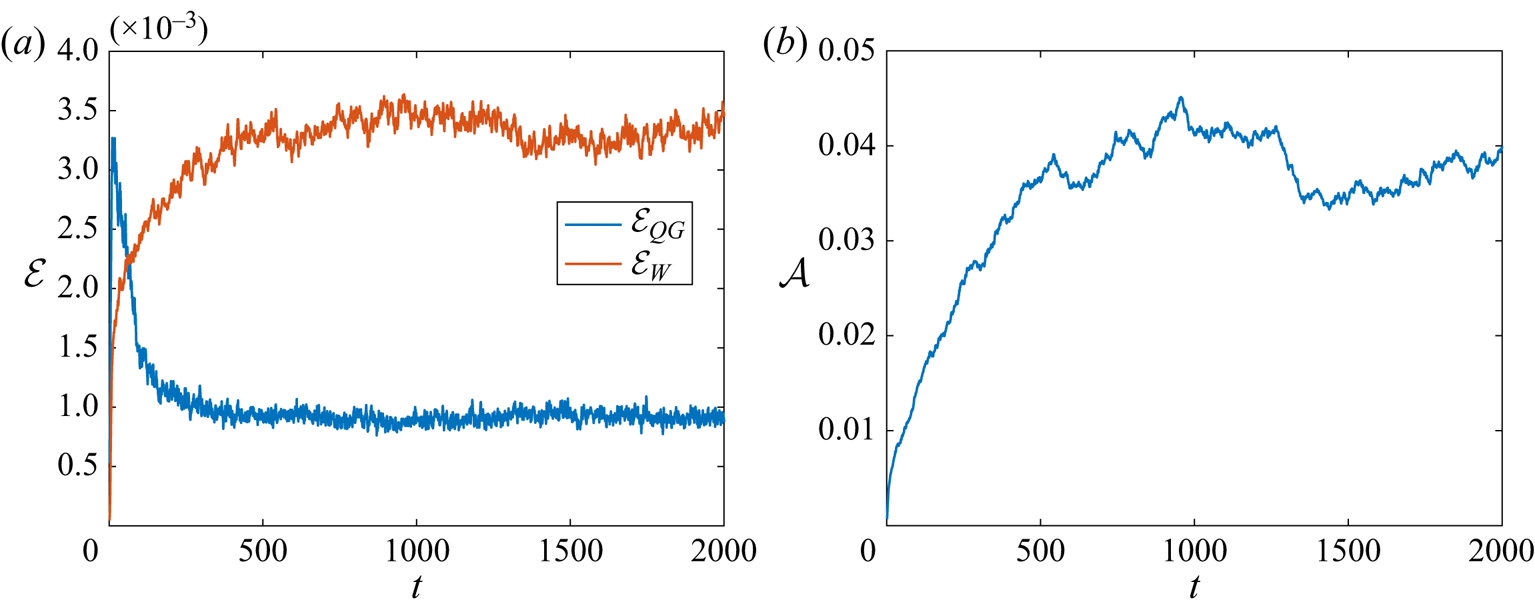
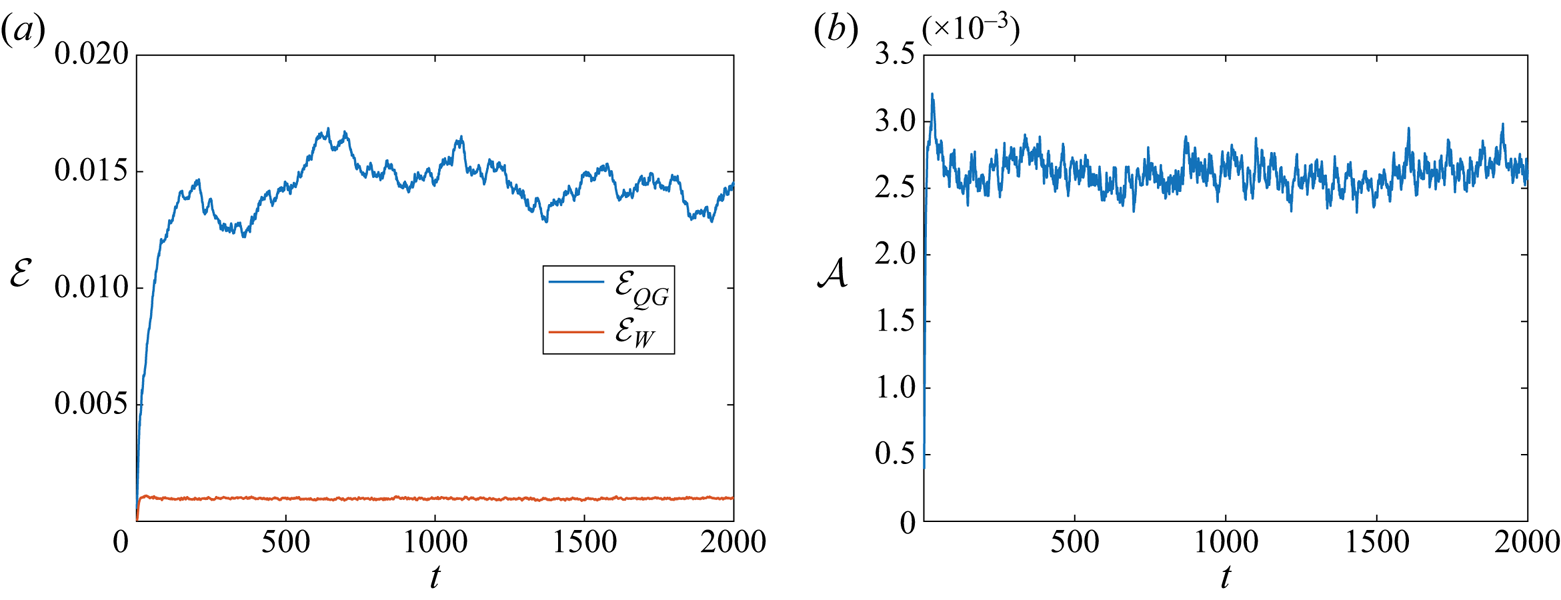
In this subsection, we show the details of the simulation with  $R=0.3<R_c$. Figure 3 shows the evolution of energy and wave action. The system reaches a statistically steady state after
 $t=1000$, so for the statistical quantities, e.g. energy and wave action fluxes, the average is taken over the time interval
 $t\in [1000\ 2000]$. When
 $R=0.3<R_c$, the wave potential energy is much smaller compared with the mean energy.
Evolution of energy and wave action in the simulation with  $R=0.3$. (a) Energy evolution and (b) Wave action evolution.
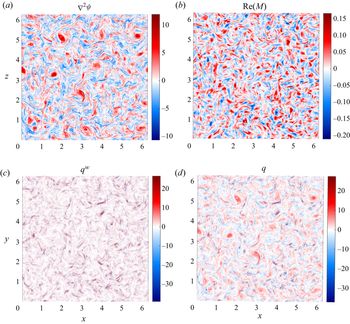
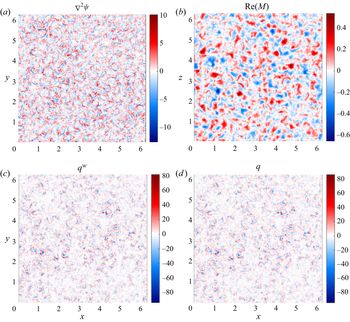
We show the snapshots of the mean-flow vorticity, the real part of wave amplitude, wave-induced potential vorticity and the potential vorticity at a turbulent statistically steady state in figure 4. We observe more strong cyclones than anticyclones, and the waves are advected by the mean flow. The NIW's concentration at the anticyclone could explain the observed strong cyclones (Danioux, Vanneste & Bühler Reference Danioux, Vanneste and Bühler2015) since the anticyclone tend to be destroyed by the interaction with NIWs. The wave-induced potential vorticity has a characteristic scale smaller than that of the mean vorticity, and it is strong in the region with vortex filament while it is weak in the region with strong mean vorticity patches. So for the total potential vorticity, mean vorticity dominates the region with vortex patches and the wave-induced potential vorticity dominates the vortex-filament region. Because the external forcing injects potential vorticity in (3.3b) and there is possible viscous potential vorticity generation, the present forced-dissipative dynamics differs from the initial value problems. For example, Rocha et al. (Reference Rocha, Wagner and Young2018) find that the mean potential vorticity and wave-induced potential vorticity cancel each other at small scales, while in the present simulation the wave-induced potential vorticity dominates the small-scale potential vorticity field.
Snapshots of mean-flow vorticity, the real part of the complex wave amplitude, wave-induced potential vorticity and total potential vorticity at  $t=2000$ in the simulation with
 $R=0.3$.
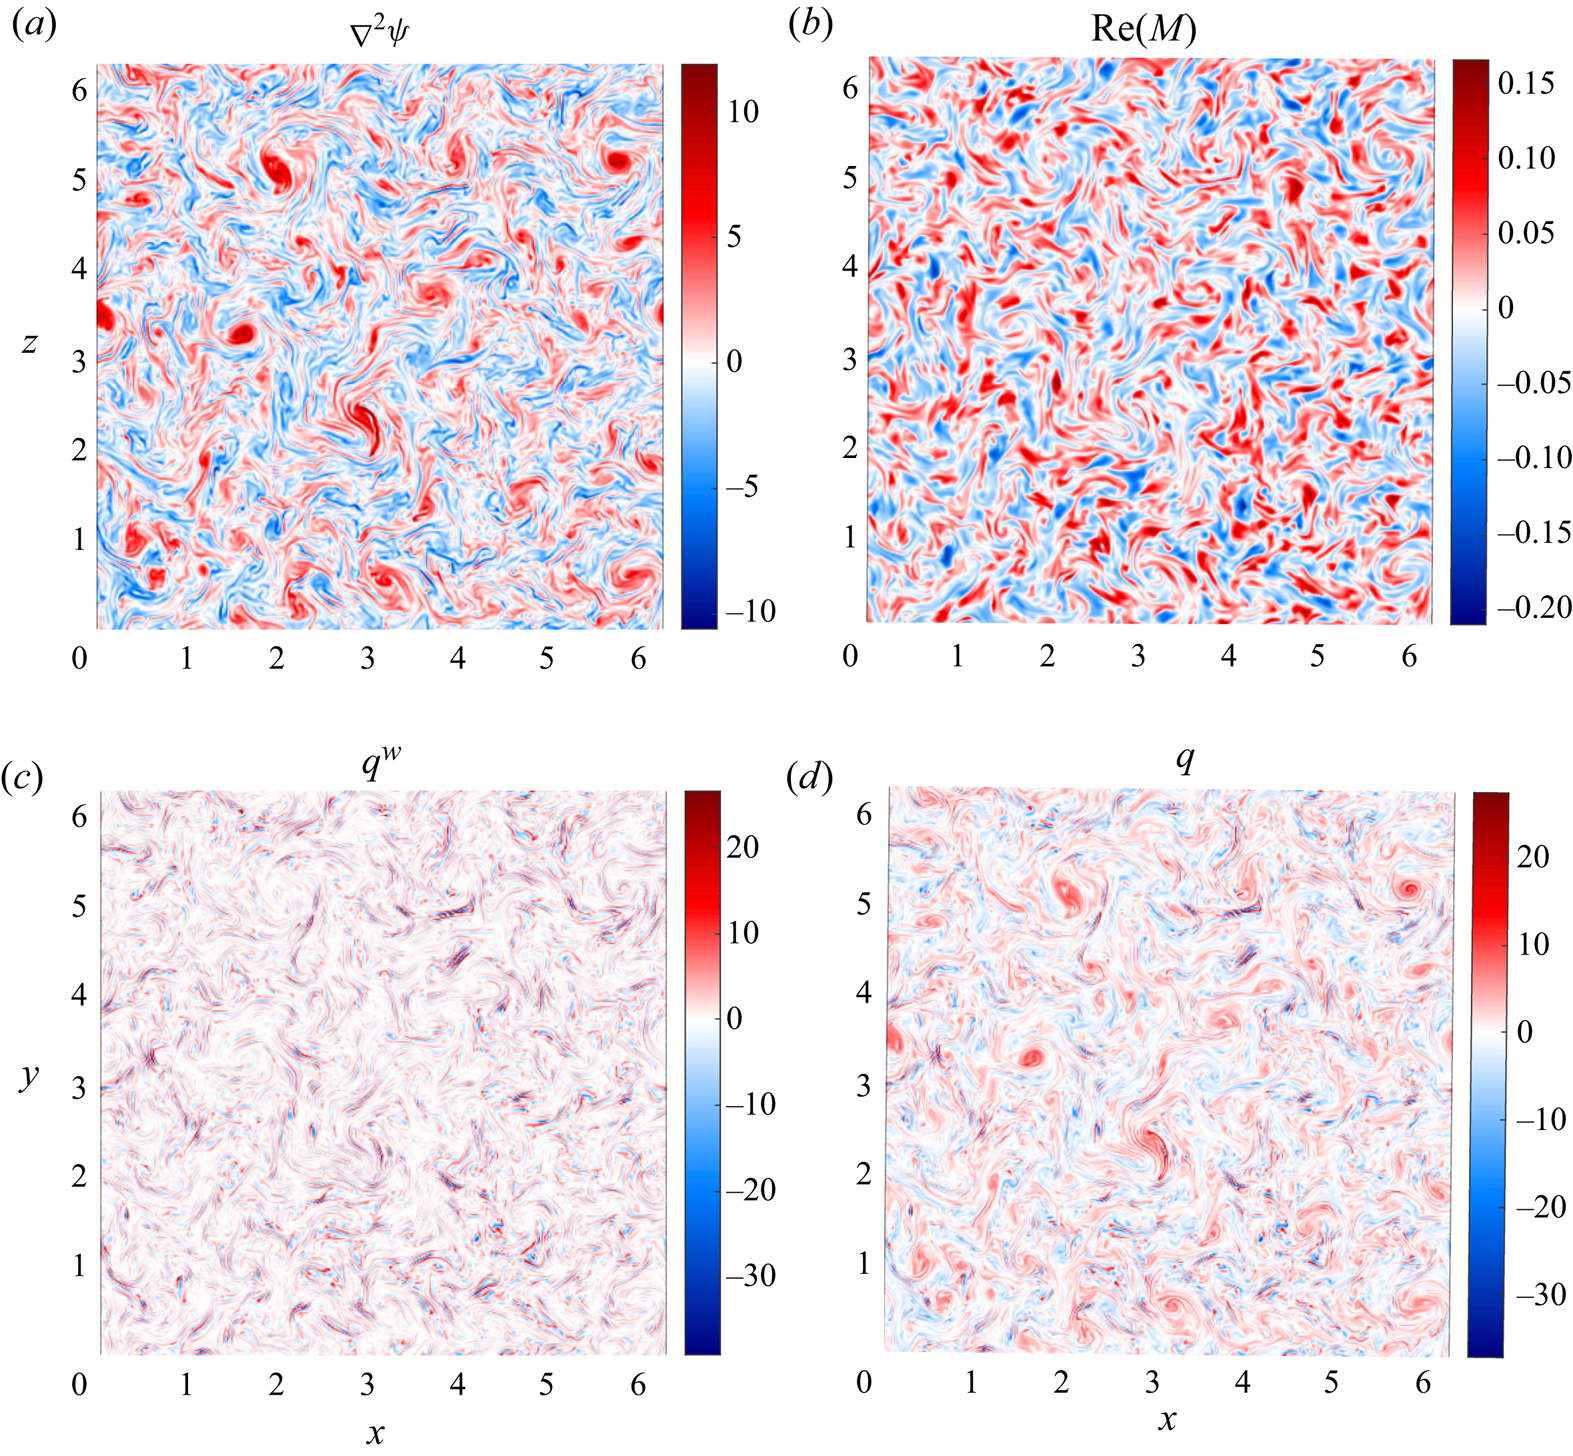
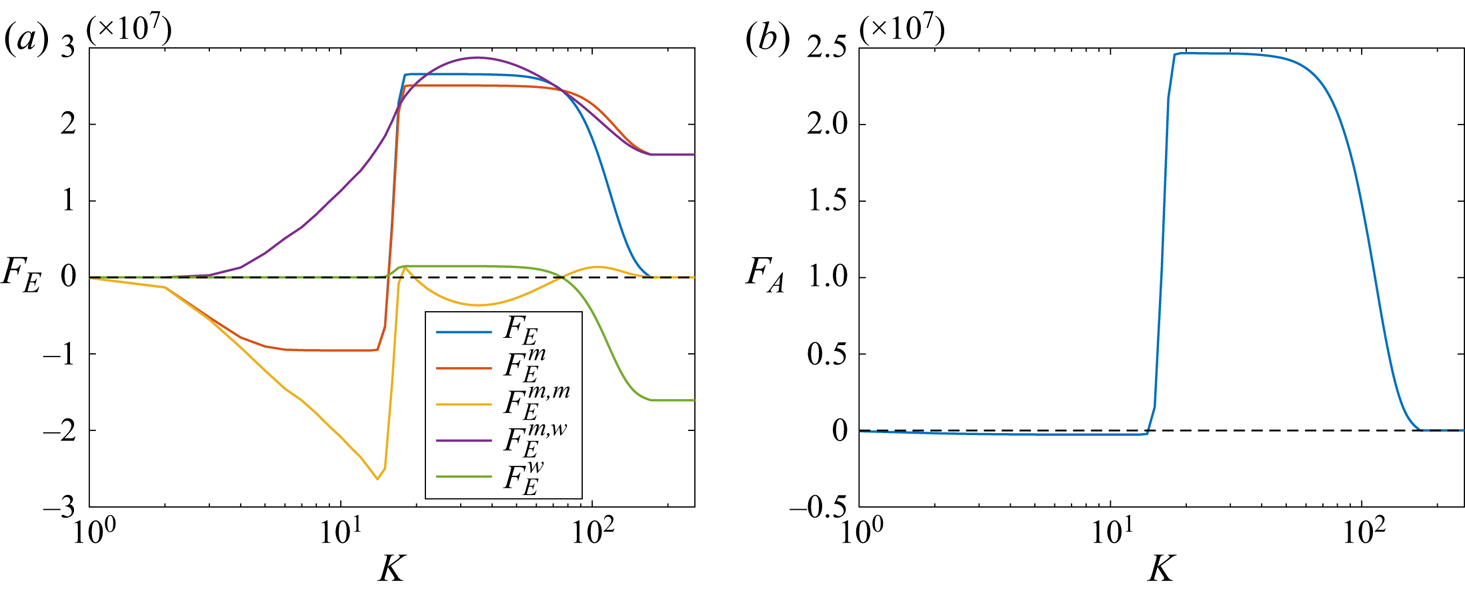
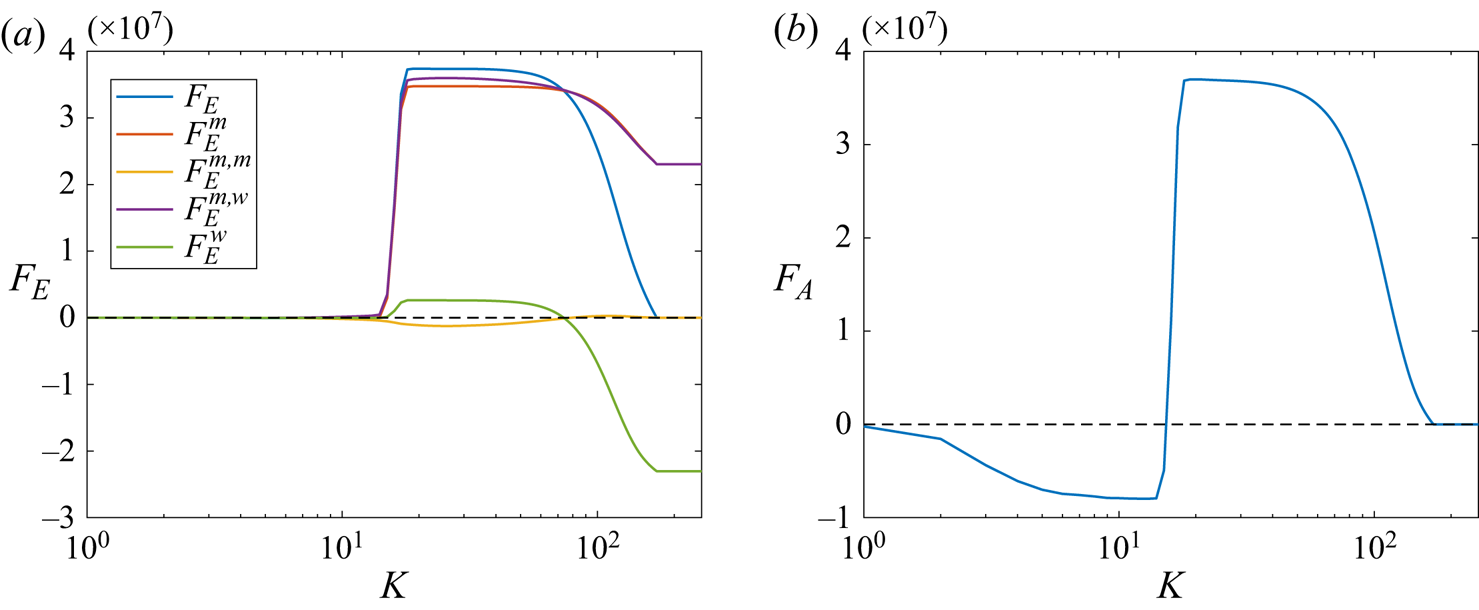
We show different components of energy flux in figure 5(a). We decompose the total energy transfer  $F_E$ into the mean-flow component
 $F_E^m$ and the wave component
 $F_E^w$, which are calculated from the mean (3.3b) and the wave (3.3a), and they correspond to the transfer of QG mean-flow energy and NIW energy (2.3a,b), respectively. Also, in the transfer of mean energy we distinguish the contributions from mean effect,
 $\mathcal {J}(\psi ,\nabla ^2\psi )$, and the wave-mean flow interaction,
 $N(\psi ,M)$, in the mean (3.3a), and name them
 $F_E^{m,m}$ and
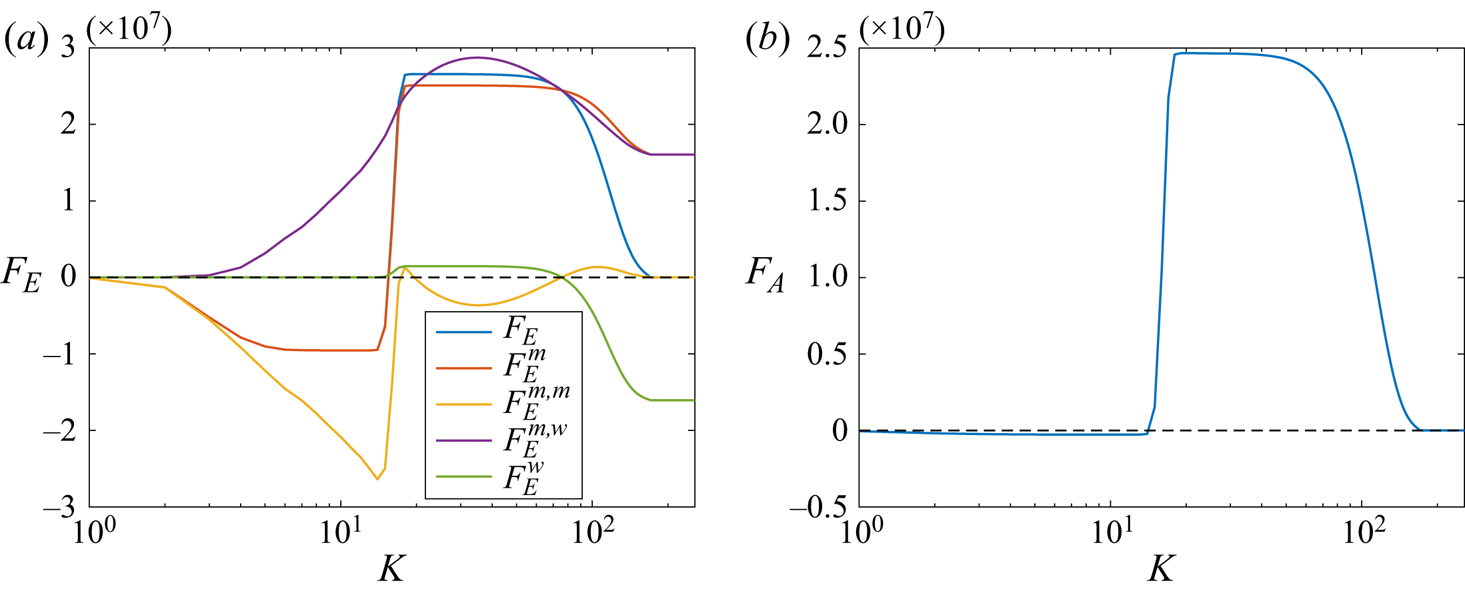
 $F_E^{m,w}$, respectively. Their explicit expressions are shown in appendix B. It is observed that the wave energy transfers downscale with constant flux. The mean energy transfers bidirectionally where the mean flow dominantly induces the upscale energy transfer while the NIW dominantly induces the downscale energy transfer. Above the forcing scale, these two effects compete and result in a residue of upscale energy transfer. It is interesting to observe that between the forcing and dissipation scale, there is a wide range where both the mean energy flux and the wave energy flux are constants. This implies an absence of energy conversion in the inertial range, because otherwise the energy fluxes could not be constant. Therefore the downscale transfer of mean energy is not controlled by the SLOB mechanism, where the mean energy is converted into wave energy. We discuss the difference between these two mechanisms in § 4.1. The wave action flux is shown in figure 5(b). As we discussed above that the NIW almost behaves as a passive scalar, the wave action transfers downscale.
Energy and wave action flux for simulation with  $R=0.3$. Here,
 $F_E$ is the total energy flux;
 $F_E^w$ is the wave energy flux;
 $F_E^{m,m}$ and
 $F_E^{m,w}$ are the mean-flow-induced and NIW-induced mean energy fluxes, respectively. All the quantities are normalized by the total energy injection
 $\epsilon$. (a) Energy flux and (b) Action flux.
3.3. Simulation with $R=0.4$

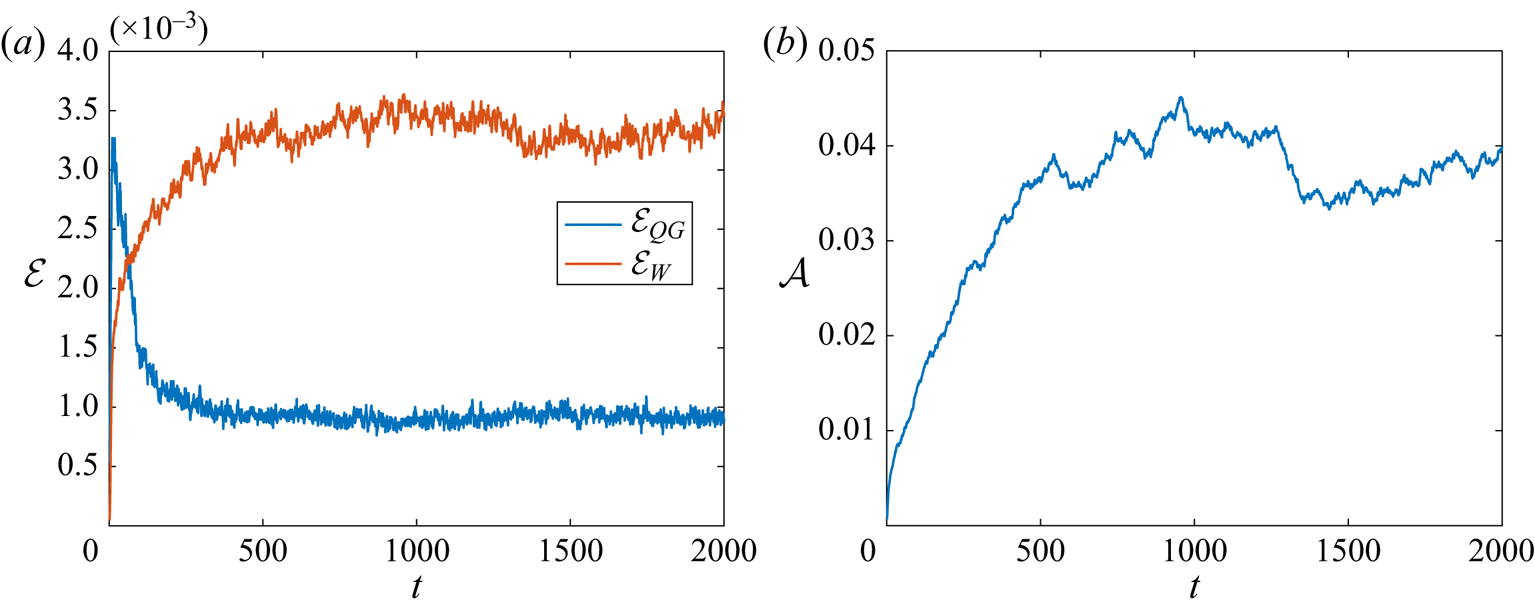
In this section, we show details of the numerical simulation with  $R=0.4>R_c$. Figure 6 shows the evolution of energy and wave action. Compared with the energy evolution in the simulation with
 $R=0.3$, the saturated mean energy is much smaller even though the magnitudes of external forcing on the mean component are the same. In the wave action evolution, we find that the transition time to saturation in the simulation with
 $R=0.4$ is larger than that in the simulation with
 $R=0.3$.
Evolution of energy and wave action in the simulation with  $R=0.4$. (a) Energy evolution and (b) Wave action evolution.
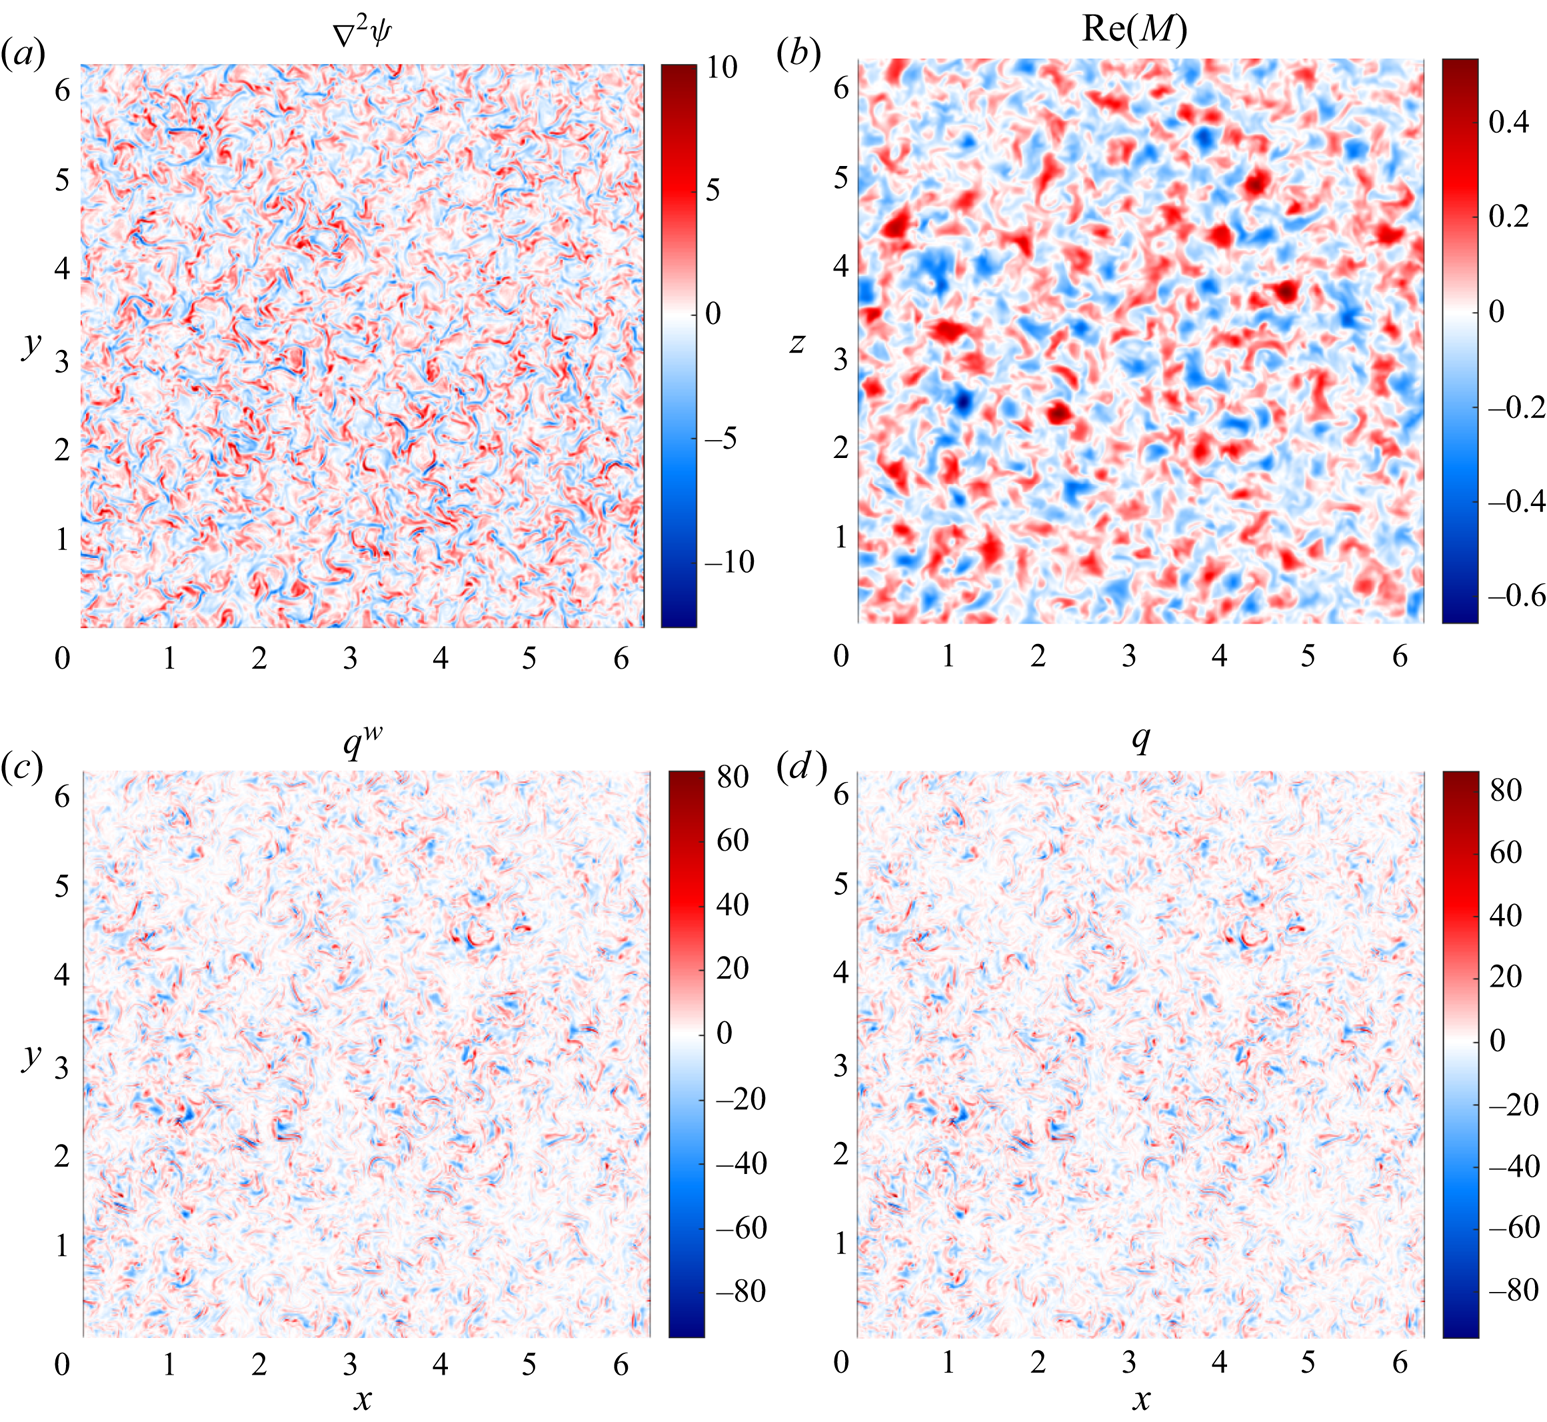
The snapshots of the mean-flow vorticity, the real part of wave amplitude, wave-induced potential vorticity and the potential vorticity at a turbulent statistically steady states are shown in figure 7. Comparing with figure 4 with  $R=0.3$, in the present simulation with
 $R=0.4$ the strong cyclone patches are broken and structures of the forcing scale are observed in both the mean-flow vorticity and the real part of wave amplitude. For the total potential vorticity, wave-induced potential vorticity dominates.
Snapshots of mean-flow vorticity, the real part of the complex wave amplitude, wave-induced potential vorticity and total potential vorticity at  $t=2000$ in the simulation with
 $R=0.4$.
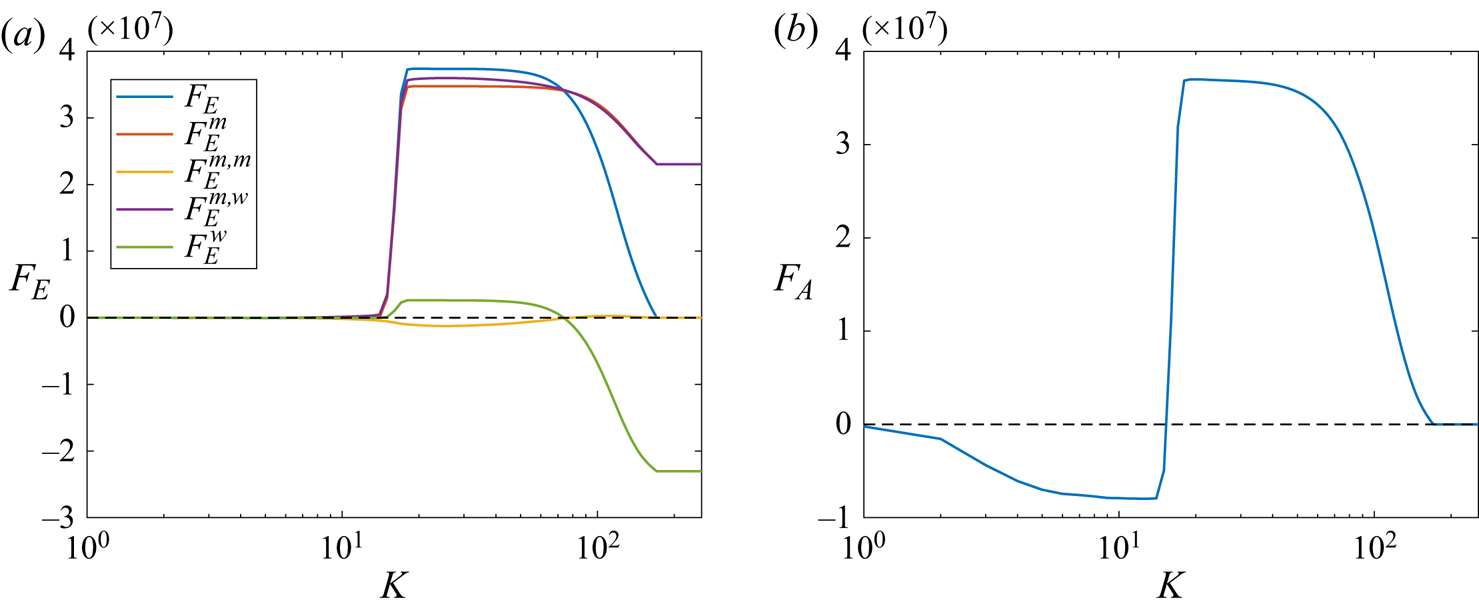
The energy flux is shown in figure 8. We observe that the upscale fluxes are almost invisible, even though this is a 2-D system with vorticity advection term, and the compensation between  $F_E^{m,m}$ and
 $F_E^{m,w}$ above the forcing scale is not obvious. Now the wave action shows a clear bidirectional transfer.
Energy and wave action flux for simulation with  $R=0.4$. The notation is the same as in figure 5. (a) Energy flux and (b) Action flux.
4. Discussion
4.1. Mechanism of downscale mean energy transfer
Using the model describing the interaction between NIW and QG mean flow (Xie & Vanneste Reference Xie and Vanneste2015; Wagner & Young Reference Wagner and Young2016), the SLOB (or stimulated NIW generation) mechanism, which explains the energy conversion from the QG mean flow to the NIW is proposed. Considering that the NIW transfers energy downscale and finally dissipates at the ocean interior, which is in the opposite energy transfer direction of mesoscale eddy itself, SLOB is believed to be important for the energy balance puzzle of oceanic mesoscale eddies, even though Asselin & Young (Reference Asselin and Young2020) recently found that SLOB maybe not effective in the ocean using 3-D numerical simulations. However, the works mentioned above focus on initial-value problems, it remains to be checked whether the interaction between NIW and mesoscale eddies effectively impact the energetics of the latter in a statistically steady turbulent state, which is the topic of this paper.
We compare the states in the parameter regime  $R<R_c$ with SLOB mechanism, as in figure 2 we find that in this regime the downscale energy flux is proportional to the injection of NIW energy, which is consistent with SLOB (cf. Xie & Vanneste Reference Xie and Vanneste2015). However, the turbulent-state energy transfer mechanism differs from SLOB. In the energy transfer of the
 $R=0.3$ simulation, figure 5 shows that there is negligible energy conversion from the mean flow to the NIW, and the downscale energy transfer is dominated by the waves direct impact on the mean energy flux instead of the NIW's forward cascade. In this turbulent downscale mean-energy transfer, the waves behave like a catalyst since there is no energy conversion from the mean flow, so we name this downscale energy transfer mechanism ‘catalytic wave induction’.
Based on our toy-model simulation, catalytic wave induction seems very effective. Around the critical value  $R_c$, the ratio of the energy injection between wave and mean flow is
 $1/16$, i.e. the mean energy that changes the direction of energy transfer due to the NIW is
 $16$ times the injected wave energy, implying a much more substantial impact of the NIW on the direction of mean energy transfer compared with SLOB. In an inertial value problem, a long time may be needed for the NIW–QG coupled system to reach turbulent statistically steady states. However, considering that wind has been blowing the ocean for a considerably long time, catalytic wave induction is potentially crucial for oceanic mesoscale eddies.
Both SLOB and catalytic wave induction show an  $R^2$-dependence of downscale energy flux, where the former is explained based on the conserved quantities. In catalytic wave induction, this dependence can be understood from the nonlinear term (3.5) where all terms depend on the quadratic of the wave magnitude.
We also need to note that catalytic wave induction differs from the previous mechanism of downscale energy transfer in statistically steady states of NIW-mean flow interacting turbulence. Barkan et al. (Reference Barkan, Winters and McWilliams2017) studied the direct extraction mechanism and SLOB in a wind-driven channel flow, where both mechanisms rely on energy conversion from mean flow to NIWs. But we cannot access the impact of catalytic wave induction in their system as we need scale-by-scale energy transfer information to distinguish it from direct extraction and SLOB. In addition, the NIW's induction of downscale mean-flow energy flux is implicitly observed in Taylor & Straub (Reference Taylor and Straub2016). They studied the Reynolds stresses exerted by the near-inertial modes as the energy sink of the mean flow, and they accessed the strength of this energy sink in the spectral space. After integrating their figure 5 over the wavenumber, we can find an NIW-induced downscale mean-energy flux. But without separating and explicitly calculating the energy flux of mean flow and NIW, it is hard to access the importance of energy conversion between NIW and mean flow on the direction of mean flow energy transfer.
4.2. Argument for the direction of energy transfer
Our heuristic argument for transfer directions based on three conserved quantities (cf. § 2) is also applicable to other systems, such as the 2-D magnetohydrodynamical (MHD) turbulence, where phase transition depending on the relative strength between the magnetic- and fluid-field forcing is observed (Seshasayanan, Benavides & Alexakis Reference Seshasayanan, Benavides and Alexakis2014; Seshasayanan & Alexakis Reference Seshasayanan and Alexakis2016). In the 2-D MHD system, the magnetic potential plays the role of the wave magnitude in the NIW–QG coupled system, and to apply our argument we need to replace the wave action by the square magnetic vector potential. But in 2-D MHD, the wave action is the Casimir (material invariant), in contrast to the potential vorticity in our wave-mean interaction system. However, our argument can only qualitatively predict the existence of phase transition, and it cannot predict the type of phase transition and the existence of bidirectional energy transfer. The details of the phase transition depend on the specific forms of nonlinear terms, whose detailed mechanisms remain to be studied. We need to note that our NIW–QG system and the 2-D MHD system are different in the details of energy transfer: in our NIW–QG system energy conversion from mean flow to the NIW is negligible, but in 2-D MHD turbulence the energy conversion from kinetic energy to magnetic energy is important (Seshasayanan & Alexakis Reference Seshasayanan and Alexakis2016).
In both the NIW–QG system and the 2-D MHD system, the transition of energy and wave action (square magnetic vector potential) are found to happen around the same critical value. Whether the two critical values are the same is not definitive, and we do not know yet the mechanism that identifies these critical values. Finding the detailed mechanism for this type of phase transition remains an open question.
It needs to be noted that the bidirectional energy transfer is not a finite-domain-size phenomenon, which differs from the bidirectional energy flux that may be observed in energy flux-loop systems (cf. Boffetta et al. Reference Boffetta, De Lillo, Mazzino and Musacchio2011; Xie & Bühler Reference Xie and Bühler2019b). For example, in 2-D inertia-gravity wave turbulence with direct energy injection into the kinetic energy, the injected kinetic energy first cascades upscale, then around the Ozmidov scale the kinetic energy is converted to the potential energy which finally transfers downscale. But for complete kinetic–potential energy conversion, the domain size should be larger than the Ozmidov scale. If the domain size is not large enough, the incomplete energy conversion results in bidirectional energy transfer, and large-scale dissipation is required for the system to reach a statistically steady state without condensation. Here, our argument implies that even when the domain size is infinite, bidirectional energy transfer can still happen in the wave-mean flow coupled system.
4.3. Potential enstrophy flux
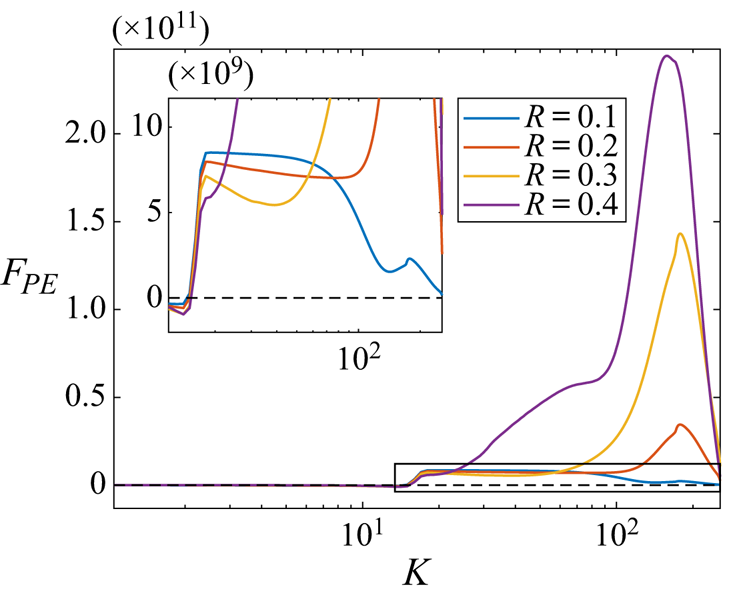
In the above section, we pay very little attention to the potential enstrophy flux because the chosen artificial hyper- and hypo-viscosities in (3.3) do not correspond to sign-definitive potential enstrophy ‘dissipation’. This is because the YBJ–QG model is initially derived in a variational framework, in which it is hard to include the dissipation effects, so we have to design which quantities to dissipate. This situation is similar to that in the shallow water model, where the two out of three conserved quantities are chosen to be dissipated (cf. Jacobson, Milewski & Tabak Reference Jacobson, Milewski and Tabak2008).
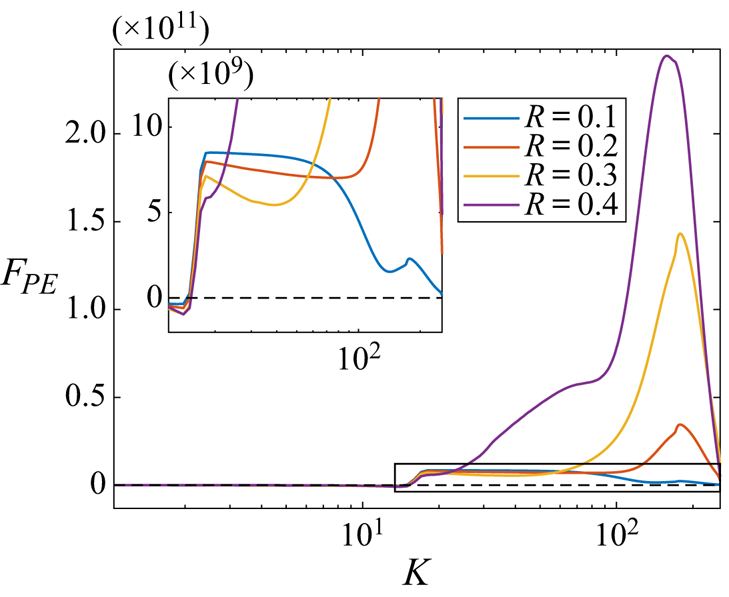
We present the  $R$ dependence of the potential enstrophy flux in figure 9. When
 $R$ is small, potential enstrophy transfers downscale since the weak wave implies the mean flow's enstrophy dominance of the potential enstrophy. However, as
 $R$ increases, viscous generation is not negligible. There is viscous generated potential enstrophy because the viscous effect in the potential enstrophy equation is not sign definitive (cf. (3.7)), which differs from the viscous effect for the total energy and wave action. And the viscous influence is not concentrated around dissipation scales, leading to non-constant potential enstrophy fluxes. This phenomenon differs from the energy and wave-action flux, where the effect of dissipation concentrates around very large- and small-scale scales, and therefore it is important to observe inertial ranges with constant fluxes.
Potential enstrophy flux for simulation with  $R=0.1,0.2,0.3$ and
 $0.4$. The inset is an enlargement of the black-boxed region.
Since the YBJ–QG coupled model can also be derived in an Eulerian framework (cf. Wagner & Young Reference Wagner and Young2016), it is interesting to perform a derivation starting from the viscous Boussinesq equation to find the suitable dissipation terms (cf. Rocha (Reference Rocha2018), chapter 5, where the vertical viscosity is included).
5. Summary and conclusion
Using the NIW–QG coupled model (3.3), we study the dependence of energy and wave action transfer directions on the parameter  $R$, which is defined as the ratio of the external forcing magnitude in the NIW and QG components. We propose a heuristic argument based on the inviscid preserved energy, potential enstrophy and wave action to predict the existence of phase transition, which is justified by numerical simulations. We find critical values
 $R^{(E)}_c$ and
 $R^{(A)}_c$, across which the energy and wave action flux show a second-order phase transition, respectively. Since
 $R^{(E)}_c$ and
 $R^{(A)}_c$ are close, they may be the same but we are not sure about it as we do not have a theory to show why they are the same. But for simplicity, in the below summary we keep only one
 $R_c$. (i) When
 $0<R<Rc$, the total energy transfers bidirectionally, and the normalized upscale energy flux monotonously decrease and reaches zero at
 $R=R_c$. The normalized upscale wave action flux remains a small close-to-zero value, so we believe the action transfers downscale. The vorticity field consists of vorticity patches with cyclone dominance, but due to the wave impact, more small-scale structures are observed compared with the 2-D turbulence. This is consistent with the information that even in two dimensions, inertia-gravity waves can induce downscale energy transfer (cf. Xie & Bühler Reference Xie and Bühler2019b). These turbulent states also show the consistency with the concentration of NIW at the anticyclones (Danioux et al. Reference Danioux, Vanneste and Bühler2015) since the cyclones dominate the vorticity field. The mean vorticity dominates the large-scale potential vorticity, while at small scale the wave-induced potential vorticity dominates. (ii) When
 $R>R_c$, energy transfers downscale; the wave action transfers bidirectionally, and as
 $R$ increases, the upscale energy transfer increases, so vortex filaments are the dominant structure, which is similar to the 3-D turbulence. The wave-induced potential vorticity dominates the potential vorticity.
In the forced-dissipative turbulence of NIW–QG mean flow interaction, we discover a new mechanism – catalytic wave induction – which is responsible for the downscale transfer of the mean energy. Different from the direct extraction and SLOB mechanism, where the QG mean energy converts to the wave energy and then cascades downscale, in the catalytic wave induction, the waves play a catalytic role, and the mean energy transfers downscale without recognizable conversion to the wave energy. In the parameter regime  $0<R<Rc$, both SLOB and the wave catalytic induction mechanisms show the common feature that the downscale energy flux is proportional to the wave energy injection. In SLOB, this dependence is predicted from the conservation of wave action and total energy, and the coefficient of proportionality is found to depend on the ratio of initial to final wave horizontal scales (Xie & Vanneste Reference Xie and Vanneste2015), but in the present catalytic wave induction mechanism, the proportionality is not well understood yet.
We close this paper by proposing some potential future work relating to the energy transfer in the NIW-mean flow coupled system.
(i) This paper focuses on NIW's impact on the energy transfer of the wave-vortex coupled system, but it ignores the energy spectrum which is also important for turbulence and is easier to be applied to compare with measurements. So one future direction is to obtain a phenomenological theory that can describe the energy flux and spectrum similar to the ones in buoyancy-driven and rotating turbulence (cf. Lohse & Xia Reference Lohse and Xia2010; Verma, Kumar & Pandey Reference Verma, Kumar and Pandey2017; Alexakis & Biferale Reference Alexakis and Biferale2018).
(ii) Similar to SLOB, the downscale energy flux in catalytic wave induction is also proportional to the wave energy injection rate, and it is shown to be effective (cf. § 4.1) based on our toy-model study, but we still cannot calculate the value of the constant linking the downscale energy flux and the wave energy injection rate. We want to explore further the dependence of the constant on parameters such as the Burger number and the forcing scale.
(iii) We need to note that the mechanism of NIW saturation differs from that in the wave turbulence theory (cf. Zakharov, L'vov & Falkovich Reference Zakharov, L'vov and Falkovich2012) because the governing equation (2.1) does not contain wave nonlinear terms and the nonlinear wave interaction only comes through the mean-flow generation. However, the conserved quantities in the wave dominant regime are the same as those in the wave turbulence theory, and the transfer directions of conserved quantities are the same as that predicted by the (weak) wave turbulence theory. So it is our future work to study the difference and the link between these two mechanisms for turbulent wave saturation, which involves the present not-reached large- $R$ regime.
(iv) In order to capture the key features, this paper studies a 2-D toy-model and finds that there are potential external-forcing-induced sudden changes in the direction of energy transfer in the ocean. But in the 2-D toy-model study, we have omitted several potentially important features, e.g. in 3-D Boussinesq equations there are possible structures with small vertical scales. To check the effect of small vertical scales, we may need to study 3-D models and we may also need to include waves with  $2f$ frequency (cf. Wagner & Young Reference Wagner and Young2016). Since wave action is an adiabatic invariant which is asymptotically obtained based on the time scale separation when deriving the NIW–QG coupled model (Xie & Vanneste Reference Xie and Vanneste2015), a further concern is that in the real ocean, how well the wave action is conserved? So again, simulations of 3-D Boussinesq equations are needed. We also need to note that in our toy-model study the added external forcing does not mimic the real wind forcing to the ocean. The forcings we add on the waves and mean flow have the same characteristic spatial scale, but in the ocean the energy injection into the waves and mean flow may come from different sources with different scales (Ferrari & Wunsch Reference Ferrari and Wunsch2009). Also, our forcings are white noise in time, which may not be true for the real ocean. What is more, we assume that the forcing on the waves and mean flow are independent, which is not true in the ocean as a storm can generate both waves and mean flow simultaneously. Therefore, to check the importance of catalytic wave induction mechanism and to find out the impact of the energy-injection property to the ocean, we would like to run ocean models and look for evidence from measurements in the future.
Acknowledgements
J.-H.X. thanks O. Asselin, R. Barkan, O. Bühler, K. Julien, E. Knobloch, J. Vanneste, M. K. Verma and W. R. Young for valuable discussions. J.-H.X. also thanks G. L. Wagner and two anonymous referees for their constructive comments.
Declaration of interests
The author reports no conflict of interest.
Appendix A. YBJ$^+$-QG coupled model

A.1. A variational derivation for the YBJ$^+$-QG model

In this section, we modify the variational framework in Xie & Vanneste (Reference Xie and Vanneste2015) to obtain the YBJ $^+$-QG coupled model proposed by Asselin & Young (Reference Asselin and Young2019).
The reconstitution by Asselin & Young modifies the dispersion relation of NIW as
 \begin{equation} \omega = f + \frac{4Bu}{4+Bu}\frac{f}{2}=f+\sigma^+, \end{equation}
where the first  $f$ is absorbed in the ansatz of NIW and the second part
 $\sigma ^+$ should be obtained from the YBJ
 $^+$ equation describing the modulation of NIW amplitude. Here we introduce the Burger number
 \begin{equation} Bu = \frac{N^2k^2}{f^2m^2}. \end{equation}
The spirit of the YBJ $^+$ equation motivates us to introduce the following mappings:
 \begin{gather} \chi \to \mathcal{K} A, \end{gather}
 \begin{gather} \partial_{z} \to \frac{N}{f}\mathcal{K}, \end{gather}
where  $u+{\textrm {i}} v = -{\textrm {i}} f\chi {\textrm {e}}^{-{\textrm {i}} ft}$ and
 \begin{equation} \mathcal{K} = \left( \frac{1}{2}\partial_{x},\frac{1}{2}\partial_{y},\frac{f}{N}\partial_{z} \right), \end{equation}
therefore  $\mathcal {K}\cdot \mathcal {K}=L^+$. Here we have assumed that
 $f$ and
 $N$ are constants, for simplicity.
Applying this mapping to the NIW Lagrangian (cf. (3.23) in Xie & Vanneste (Reference Xie and Vanneste2015) and taking  $\beta =0$) we obtain
 \begin{align} \langle\mathcal{L}\rangle_{NIW} &= -\int \left( \frac{{\textrm{i}} f}{4} \left( L^+A D_T L^+A^* - L^+A^* D_T L^+A \right) \right.\nonumber\\ &\quad \left. +\,f\psi G(\mathcal{K}A^*,\mathcal{K}A) + \frac{1}{4}N^2 |\boldsymbol{\nabla} \mathcal{K}A|^2 \right){\textrm{d}} \boldsymbol{x}, \end{align}
where  $D_T=\partial _{T} + \mathcal {J}\left (\psi ,\cdot \right )$ and
 \begin{equation} G(\mathcal{K}A^*,\mathcal{K}A) = \tfrac{1}{2}( 2|\boldsymbol{\nabla} \mathcal{K} A_z|^2 - \mathcal{K}A_{zz}\nabla^2\mathcal{K}A^* - \mathcal{K}A^*_{zz}\nabla^2\mathcal{K}A ). \end{equation}
Taking the variation of  $A^*$ we obtain the wave equation
 \begin{align} & L^+( D_T(L^+A) ) + \frac{{\textrm{i}} f}{2} L^+\nabla^2 A + \frac{2{\textrm{i}}}{f}L^+\left( \boldsymbol{\nabla}\boldsymbol{\cdot}( \psi\boldsymbol{\nabla} L^+A ) - \frac{1}{2}\mathcal{K}\cdot( \psi\nabla^2\mathcal{K} A ) \right)\nonumber\\ &\qquad + \frac{1}{2} \nabla^2\mathcal{K}\cdot( \psi \mathcal{K}^{3/2}A ) = 0. \end{align}
Note that (A 7) has three refraction terms that are comparable with that in the first YBJ equation (Young & Ben Jelloul Reference Young and Ben Jelloul1997).
We can multiply  $(L^+)^{-1}$ by (A 7) to obtain a complicated version of the YBJ
 $^+$ equation
 \begin{equation} D_T(L^+A) + \frac{{\textrm{i}} f}{2} \nabla^2 A + \frac{2{\textrm{i}}}{f} \boldsymbol{\nabla}\boldsymbol{\cdot}( \psi\boldsymbol{\nabla} L^+A ) - \frac{{\textrm{i}}}{f}\mathcal{K}\cdot( \psi\nabla^2\mathcal{K} A ) + \frac{1}{2} \nabla^2\mathcal{K}^{-1}\cdot( \psi \mathcal{K}^{3/2}A ) = 0, \end{equation}
where operator  $\mathcal {K}^{-1}$ is non-local in the last refraction term.
But for the modelling purpose, we introduce a modified wave potential energy
 \begin{equation} G\to G^+ = \tfrac{1}{4}\nabla^2|L^+A|^2, \end{equation}
corresponding to the vertical averaging procedure introduced by Wagner & Young (Reference Wagner and Young2016), then the Lagrangian of NIW becomes
 \begin{equation} \langle\mathcal{L}\rangle_{NIW+} = -\int \left( \frac{{\textrm{i}} f}{4} \left( L^+A D_T L^+A^* - L^+A^* D_T L^+A \right) + \frac{f}{4}\psi\nabla^2|L^+A|^2 + \frac{1}{4}N^2 |\boldsymbol{\nabla} \mathcal{K}A|^2 \right) {\textrm{d}} \boldsymbol{x}, \end{equation}
then taking the variation of  $A^*$ we recover the YBJ
 $^+$ equation,
 \begin{equation} D_T(L^+A) + \frac{{\textrm{i}} f}{2} \nabla^2 A + \frac{{\textrm{i}}}{2}\nabla^2\psi L^+A = 0. \end{equation}
Thus, the potential vorticity with barotropic mean flow becomes
 \begin{equation} \left. \begin{aligned} q & = \nabla^2\psi +\frac{f^2}{N^2}\psi_{zz} + \frac{{\textrm{i}} f}{2}\mathcal{J}(L^+A^*,L^+A) + fG^+\\ & = \nabla^2\psi +\frac{f^2}{N^2}\psi_{zz} + \frac{{\textrm{i}} f}{2}\mathcal{J}(L^+A^*,L^+A) + \frac{f}{4}\nabla^2|L^+A|^2. \end{aligned} \right\} \end{equation}
The relabeling symmetry implies the potential vorticity conservation
 \begin{equation} q_t + \mathcal{J}(\psi,q) = 0, \end{equation}
that together with the YBJ $^+$ (A 11) form a closed couple system. Then, assuming that the mean flow is barotropic, i.e.
 $\partial _{z}=0$, and the wave has only one vertical wave wavenumber
 $m$, and renaming the variable
 $L^+A$ as
 $M$, we obtain the YBJ
 $^+$-QG model (3.1).
A.2. Argument for the transfer of conserved quantities in the YBJ$^+$-QG model

Note that instead of the variable  $A$ used by Asselin & Young (Reference Asselin and Young2019) in the above equations we introduce
 $M={\textrm {i}} L^+A /f$, where
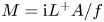
 $L^+A = -f^2m^2/N^2 + \nabla ^2/4$, to directly compare (3.1) with (2.1). We can see that comparing with (2.1a), the YBJ
 $^+$ (3.1a) modifies the linear dispersion term, which bounds the maximum frequency to be resolved as
 $2f$ instead of
 $\infty$, thus, the numerical simulations are accelerated. Meanwhile, the nonlinear terms are not changed, so the system (3.1) remains a good model to study the nonlinear dynamics of NIW-mean flow interaction.
The same as the YBJ–QG model (2.1), the YBJ $^+$-QG model (3.1) preserves the total energy, potential enstrophy and the wave action
 \begin{gather} \mathcal{E} = \int \left( \frac{1}{2}|\boldsymbol{\nabla} \psi|^2 + \frac{f^2}{4}|\mathcal{L}M|^2 \right) {\textrm{d}} \boldsymbol{x},\end{gather}
 \begin{gather} \mathcal{P} = \int q^2 \,{\textrm{d}} \boldsymbol{x}, \end{gather}
 \begin{gather} \mathcal{A} = \int |M|^2\,{\textrm{d}} \boldsymbol{x}, \end{gather}
where
 \begin{equation} \mathcal{L}^2 = \frac{\nabla^2}{\dfrac{f^2}{N^2}m^2-\dfrac{1}{4}\nabla^2}. \end{equation}
In the wave-dominant case, the energy and (potential) enstrophy dominates the dynamics, so the energy transfers upscale and the (potential) enstrophy transfers downscale. Since the waves are nearly passive, the wave action should transfer downscale.
In the mean-flow-dominant case, energy and wave action control the dynamics, and their leading-order expressions are
 \begin{gather} \mathcal{E} = \int \frac{f^2}{4}|\mathcal{L}M|^2 \,{\textrm{d}} \boldsymbol{x}, \end{gather}
 \begin{gather} \mathcal{A} = \int |M|^2\,{\textrm{d}} \boldsymbol{x}. \end{gather}
Again we consider the heuristic scenario that the energy and wave action are injected at an intermediate wavenumber  $k_f$ and dissipate at both small and large wavenumbers
 $k_1$ and
 $k_2$, therefore the conserved energy and wave action imply
 \begin{gather} \mathcal{E}_f = \frac{f^2}{4}\frac{k_1^2}{\dfrac{f^2}{N^2}m^2+\dfrac{1}{4}k_1^2}\mathcal{A}_1 + \frac{f^2}{4}\frac{k_2^2}{\dfrac{f^2}{N^2}m^2+\dfrac{1}{4}k_2^2}\mathcal{A}_2, \end{gather}
 \begin{gather} \mathcal{A}_f = \mathcal{A}_1 + \mathcal{A}_2. \end{gather}
Considering the relation (2.8) we can solve (A 17) to obtain
 \begin{equation} \mathcal{A}_1 = \frac{( 4f^2m^2+N^2k_1^2 )( k_f^2-k_2^2 )}{( 4f^2m^2+N^2k^2 )( k_1^2-k_2^2 )}\mathcal{A}_f \quad\mathrm{and}\quad \mathcal{A}_2 = \frac{( 4f^2m^2+N^2k_2^2 )( k_f^2-k_1^2 )}{( 4f^2m^2+N^2k^2 )( k_2^2-k_1^2 )}\mathcal{A}_f. \end{equation}
In the limit  $k_1\to 0$ and
 $k_2\to \infty$, the leading-order energy and wave action dissipation can be approximated as
 \begin{equation} \mathcal{A}_1 = \frac{4}{4+Bu_f}\mathcal{A}_f,\quad \mathcal{A}_2 = \frac{Bu_f}{4+Bu_f}\mathcal{A}_f,\quad \mathcal{E}_1 = 0 \quad \mathrm{and} \quad \mathcal{E}_2 = \mathcal{E}_f, \end{equation}
where  $Bu_f=N^2k_f^2/(\,f^2m^2 )$ is the forcing Burger number. It is interesting to observe that the YBJ
 $^+$-QG model transfers energy to both wave action to both large and small scales depending on the value of forcing Burger number. If we want the energy and action transfer to recover those obtained in the YBJ–QG model (2.10a–d), the forcing Burger number should be much smaller than
 $4$.
Appendix B. Explicit expressions for the terms in the energy and wave-action equations in the spectral space
In the Fourier space we express (3.3) as
 \begin{gather} \partial_{t}\hat{M} + \widehat{\mathcal{J}(\psi,M)} + \hat{\mathcal{P}}\hat{M} + \frac{{\textrm{i}}}{2}\widehat{\nabla^2\psi M}= -\alpha K^{-2} \hat{M} - \nu K^6 \hat{M} + R \frac{m}{Nk_f} \hat{\mathcal{F}}_1, \end{gather}
 \begin{gather} \partial_{t}K^2\hat{\psi} - \widehat{\mathcal{J}(\psi,\nabla^2\psi)} - \widehat{N(\psi,M)} = -\alpha \hat{\psi} - \nu K^8 \hat{\psi} + \hat{\mathcal{F}}_2, \end{gather}
where  $\hat {\cdot }$ denotes the Fourier transform and
 \begin{equation} \hat{\mathcal{P}} = \frac{2{\textrm{i}} f\, N^2K^2}{4f^2m^2+K^2}. \end{equation}
Therefore we obtain the energy equation in Fourier space
 \begin{equation} \partial_{t}E = -\partial_{K} F_E + D_E + P_E, \end{equation}
where  $F_E$ is the energy flux toward small scales. We decompose the total energy flux into the summation of mean-energy flux and the wave-energy flux,
 $F_E=F_E^{w}+F_E^{m}$, and the mean-energy flux is further decomposed into the mean- and wave-induced components,
 $F_E^m=F_E^{m,m}+F_E^{m,w}$. The expressions of these components are
 \begin{gather} F_E^w = \frac{N^2}{4m^2}\int_{|\boldsymbol{k}| < K} \left( K^2\hat{M}^*\left( \widehat{\mathcal{J}\left(\psi,M\right)}+\frac{{\textrm{i}}}{2}\widehat{M\nabla^2\psi} \right) \right){\textrm{d}} \boldsymbol{k} +\mathrm{c.c.}, \end{gather}
 \begin{gather} F_E^{m,m} = -\tfrac{1}{2}\int_{|\boldsymbol{k}| < K} \hat{\psi}^*\widehat{\mathcal{J}(\psi,\nabla^2\psi)} \,{\textrm{d}} \boldsymbol{k} +\mathrm{c.c.}, \end{gather}
 \begin{gather} F_E^{m,w} = -\tfrac{1}{2}\int_{|\boldsymbol{k}| < K} \hat{\psi}^*\widehat{\mathcal{N}( \psi,M )} \,{\textrm{d}} \boldsymbol{k} +\mathrm{c.c.}, \end{gather}
where  $\mathrm {c.c.}$ denotes the complex conjugate. The energy dissipation is expressed as
 \begin{equation} D_E = -\sum_{|\boldsymbol{k}|= K} ( \alpha + \nu K^8 ) \left( |\hat{\psi}|^2 + \frac{N^2}{2m^2} |\hat{M}|^2 \right), \end{equation}
and the energy injection is expressed as
 \begin{equation} P_E = \sum_{|\boldsymbol{k}|= K} \left( \frac{1}{2}\hat{\psi}^*\hat{\mathcal{F}}_2 + \frac{NK^2R}{4mk_f}\hat{M}^*\hat{\mathcal{F}}_1 \right) +\mathrm{c.c.} \end{equation}
The wave action equation in the Fourier space becomes
 \begin{equation} \partial_{t}A = -\partial_{K} F_A + D_A + P_A, \end{equation}
where  $F_A$ is the wave-action flux toward small scales. The wave action flux is expressed as
 \begin{equation} F_A = \int_{|\boldsymbol{k}| < K} \left( \hat{M}^*\left( \widehat{\mathcal{J}\left(\psi,M\right)}+\frac{{\textrm{i}}}{2}\widehat{M\nabla^2\psi} \right) \right){\textrm{d}} \boldsymbol{k} +\mathrm{c.c.}, \end{equation}
The wave-action dissipation and injection are expressed as
 \begin{equation} D_E = -2\sum_{|\boldsymbol{k}|= K} ( \alpha K^{-2} + \nu K^6 )|\hat{M}|^2, \end{equation}
and
 \begin{equation} P_E = \sum_{|\boldsymbol{k}|= K} \frac{mR}{Nk_f}\hat{M}^*\hat{\mathcal{F}}_1 +\mathrm{c.c.}, \end{equation}
respectively.