Implications
As cow milk fat proportions of fatty acids (FA) affect cheese characteristics (i.e. texture and appearance), considerable FA variations could make farmhouse cheese quality difficult to standardise. Therefore, it seems preferable to reduce variations of milk FA composition when milk fat proportions of specific FA are considered for milk payment. Thus, the identification of factors (e.g. moving of dairy cows to new paddocks, grazing selection) that influence variations of milk fat proportions of FA would be useful for farmers to control farmhouse cheese quality, and therefore milk payment.
Introduction
In upland dairy farming systems, considerable day-to-day variations of milk yield and quality are frequently reported by farmers and cheese makers, resulting in difficult management of dairy product quality for producers. These variations can be attributed to daily changes in milk fat and protein contents and fatty acid (FA) composition. Among these quality parameters, FA composition of milk fat plays an important role for human nutrition (Kratz et al., Reference Kratz, Baars and Guyenet2013) and concurs to determine butter spreadability, cheese texture and sensory notes of dairy products (Martin et al., Reference Martin, Verdier-Metz, Buchin, Hurtaud and Coulon2005; Hurtaud et al., Reference Hurtaud, Faucon, Couvreur and Peyraud2010; Coppa et al., Reference Coppa, Verdier-Metz, Ferlay, Pradel, Didienne, Farruggia, Montel and Martin2011b). However, the origin of these day-to-day FA variations is not well understood, resulting in difficult management of dairy product quality for producers.
The FA composition of pasture-derived milk is affected by several factors. Herbage allowance exerts an effect through the composition of herbage consumed (Dewhurst et al., Reference Dewhurst, Shingfield, Lee and Scollan2006). The total FA and 18:3n-3 contents of grass decreased with the advancement of herbage phenological stage (Chilliard et al., Reference Chilliard, Glasser, Ferlay, Bernard, Rouel and Doreau2007). Different phenological stages induce variations in the herbage chemical composition (i.e. CP and fibre contents), influencing the ruminal biohydrogenation of polyunsaturated fatty acid (PUFA; Gerson et al., Reference Gerson, John and King1986). The effect of the botanical composition of upland pasture is due to specific secondary plant ingredients abundant in dicotyledons, inhibiting ruminal bacteria implied in the ruminal biohydrogenation of PUFA (Willems et al., Reference Willems, Kreuzer and Leiber2014), resulting in larger amounts of PUFA available in the duodenum and then in milk (Leiber et al., Reference Leiber, Kreuzer, Nigg, Wettstein and Scheeder2005). These different factors could interact with cow grazing selection, which can be managed through the grazing system applied (Coppa et al., Reference Coppa, Farruggia, Pradel, Lombardi and Martin2011a).
In the upland dairy cow farming systems of central Europe, rotational grazing systems differed mainly in stocking density and duration of pasture utilisation (Sollemberg and Newman, Reference Sollemberg and Newman2007). Under low stocking density, cows have unlimited and interrupted access to an extensively managed plot for several weeks. By contrast, at higher stocking density, cows usually move to new paddocks quite frequently and have access to a more stable herbage allowance and chemical composition during the season (Sollemberg and Newman, Reference Sollemberg and Newman2007; Farruggia et al., Reference Farruggia, Pomiès, Coppa, Ferlay, Verdier-Metz, Le Morvan, Bethier, Pompanon, Troquier and Martin2014). Vlaeminck et al. (Reference Vlaeminck, Abrahamse, Fievez, Lourenco, Dijkstra and Tamminga2010) showed important variations of the milk FA composition from cows on intensively managed lowland grasslands with a short duration of paddock utilisation (4 days). Moreover, high variations of milk yield and milk FA composition have also been reported with continuous grazing systems, according to the grazing period over the year (Farruggia et al., Reference Farruggia, Pomiès, Coppa, Ferlay, Verdier-Metz, Le Morvan, Bethier, Pompanon, Troquier and Martin2014). However, little information is still available with regard to the day-to-day variations of milk fat proportions of FA at paddock changes, according to the rotational grazing management.
This work aimed to investigate the variations of milk FA composition induced by moving grazing dairy cows to new paddocks with different frequencies. We explored that question within the grazing system and studied two experimental rotational grazing systems, differing by the duration of the rotation, the stocking rate and the type of vegetation.
Material and methods
Experimental design and animal management
The experiment was conducted at the INRA experimental farm of Marcenat in an upland area of Cantal, central France (latitude 45°15′N, longitude 2°55′E; altitude 1135 to 1215 m; annual rainfall of 1100 mm). The experiment presented in this paper represents a focus made within a main long-term ‘system experiment’ (still in progress), described by Pomiès et al. (Reference Pomiès, Martin, Pradel, Verdier-Metz, Constant, Delbès-Paus, Troquier, Fournier, Montel and Farruggia2013), consisting of two different low-input pasture-based production systems with different input levels. Concerning the ‘system experiment’, a total of 24 Holstein and 24 Montbéliarde spring-calving cows were divided into two equivalent groups and were turned out to pasture at the end of April on two different grazing managements: LD characterised by a long duration of paddock utilisation (15 to 20 days) on a highly biodiversified pasture and not fertilised and MD characterised by a medium duration of paddock utilisation (7 to 10 days) on a moderately biodiversified and more intensively managed pasture (about 150 kg/ha of ammonium nitrate per year).
After calving, a sub-group of five Holstein and five Montbéliarde multiparous cows from each experimental system was selected according to individual milk yield, milk protein and fat contents, calving date, BW and parity to create two equivalent groups of 10 cows for the experiment presented in this paper. All the selected cows were at the beginning of the lactation (39 days in milk (DIM); standard deviation: 10.8). Two cows (one per each system) had a case of hypocalcaemia at pasture before the experiment, and thus they were removed. Before the experimental period, from 21 April to 21 May for the MD cows and from 27 April to 21 May for the LD cows, the animals grazed on similar grassland pastures according to the experimental grazing management. The experiment was carried out for 17 days (from 21 May to 6 June) in 2011, aiming to graze the pasture at the first seasonal grazing cycle. During the experimental period, the values for daily temperature and rainfall were on average 11.8°C (minimal and maximal values=6.1°C and 17.6°C/day) and 5.8 mm/day (minimal and maximal values=1.2 and 10.9 mm/day, with cumulate rainfall during on 17 days=46.2 mm), respectively. During this period, the LD group grazed a 9.6-ha permanent mesotrophic pasture at a moderate stocking density (2.5 livestock unit (LU)/ha; 1 LU=600 kg BW/ha), having a high botanical diversity (139 botanical species) and a marked structural heterogeneity of vegetation. The LD cows were fed only this herbage. The MD group grazed a 6.4-ha moderately biodiversified pasture at a higher stocking density (3.75 LU/ha), which was managed to offer cows leafy edible biomass throughout the grazing season. The MD pasture area was divided into two paddocks that were used consecutively. The change between Paddock 1 to Paddock 2 was managed on the basis of the daily milk yield of the group: cows were moved when the milk yield decreased by about 10% of the average of the three consecutive maximum daily milk yields achieved on the paddock. The MD cows were fed herbage and received 4 kg/cow per day of concentrate (ingredients expressed as % of the concentrate dry matter (DM): 38.8% wheat flour, 32.6% barley flour, 24.1% corn flour, 3% cane molasses and 1.5% carbonate-binding agent; FA composition expressed as g/100 g total FA: 12:0, 0.05; 14:0, 0.25; 16:0, 21.48; 18:0, 1.80; c9-18:1, 18.48; 18:2n-6, 54.39; 18:3n-3, 2.46; 20:0, 0.23; 22:0, 0.31; and 24:0, 0.54). The MD cows grazed for 9 days on Paddock 1 (from days 1 to 9) and 8 days on Paddock 2 (from days 10 to 17). The LD cows entered into the plot when the MD cows started grazing Paddock 1, and the LD cows grazed on the plot throughout the duration of the experiment (17 days).
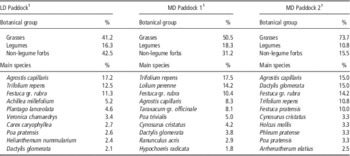
The botanical composition of the vegetation (Table 1) was determined before the experiment by 40 and 33 surveys (Braun-Blanquet, Reference Braun-Blanquet1932) on the LD and MD pastures, respectively. The herbage availability was estimated using the sward-cutting method (Smith et al., Reference Smith, Taweel, Tas, Tamminga and Elgersma2005) the day before the cows started grazing on each paddock. The herbage availability was 0.93 t/DM per ha on LD and 1.45 and 1.29 t/DM per ha on MD Paddocks 1 and 2, respectively. The average maximum herbage height, measured by an electronic plate meter (30×30 cm2, 4.5 kg/m2; Urban and Caudal, Reference Urban and Caudal1990), was 9.3±0.3 cm on LD when cows entered into the paddock and 7.3±0.4 cm at the end of the experiment, whereas it was 16.3±0.2 and 12.4±0.2 cm at the beginning and 10.8±0.2 and 8.3±0.2 cm at the end of Paddock 1 and Paddock 2 utilisation for the MD system, respectively.
Botanical composition expressed as proportion of total ground cover on the different paddocks grazed during the experiment

1 LD=long duration of heterogeneous pasture utilisation; MD=medium duration of paddock utilisation on intensively managed pastures.
Cow grazing selection measurements
Aiming to relate the cow diet composition to the milk FA composition, the grazing selection of each cow was characterised by direct observations and by simulated bites sampled at the beginning (days 1 and 10) and at the end (days 8 and 17) of each MD paddock utilisation, and at the same dates for LD.
Direct observations of grazing selection
All the grazing cows were observed continuously and individually during days 1, 8, 10 and 17 of each MD paddock utilisation, and at the same dates for the LD group, by an observer standing within <5 m at the side of the target animal (Farruggia et al., Reference Farruggia, Dumont, D’Hour and Egal2008). The observer recorded the composition and structure of every fifth bite grazed by the target cow. The patches were classified as follows: short vegetative patches (SV), when patch height was <7 cm and the herbage was at vegetative stage; tall vegetative patches (TV), when patch height was >7 cm and the herbage was at vegetative stage; and tall mature patches (TM) when patch height was >7 cm and the herbage was at mature stage (Farruggia et al., Reference Farruggia, Dumont, D’Hour and Egal2008).
Simulated bites
Once having observed the composition and structure of each target cow bite, the observer collected a ‘simulated bite’: a sward patch similar to that of the bites grazed by the target cow, considering herbage height, phenological stage and botanical composition (Farruggia et al., Reference Farruggia, Dumont, D’Hour and Egal2008; Verheyden-Tixier et al., Reference Verheyden-Tixier, Renaud, Morellet, Jamot, Besle and Dumont2008). Simulated bites per cow were sampled several times during the day of observation (5 to 10 simulated bites in the morning and 5 to 10 simulated bites in the afternoon). The simulated bites were immediately stored at 4°C. The different bite samples of each cow collected at the same days of sampling were pooled to constitute one sample, representative of the herbage grazed daily by the cow. Each pooled sample was then divided into three homogeneous sub-samples. Two sub-samples were stored at −20°C until the analysis of chemical composition and FA composition, respectively. The third sub-sample was used to determine the botanical group composition and grass leaf-to-stem ratio (L/S). The botanical group composition was determined by hand separating the plants into groups of grasses, legumes and non-legume forbs. Each botanical group was weighed after oven drying at 60°C for 72 h to determine the respective proportions on DM basis. Before drying, 100 plants from the group of grasses were randomly selected and divided by hand into stems and leaves and then weighed after oven drying to determine the respective proportions (on DM basis) of the two fractions.
Herbage analyses
For the determination of the chemical composition, a sub-sample of simulated bites was dried at 60°C for 24 h and analysed for total nitrogen content by combustion (LECO method (Sweeney and Rexroad, Reference Sweeney and Rexroad1987)), NDF and ADF contents (Van Soest et al., Reference Van Soest, Robertson and Lewis1991) and pepsin-cellulase solubility (Aufrère and Michalet-Doreau, Reference Aufrère and Michalet-Doreau1983) as a measure of the organic matter digestibility (OMD). The sub-samples of simulated bites were lyophilised (ThermovacTM-20, Froilabo, Ozoir-la-Ferriere, France), ground and analysed for FA composition as described by Ferlay et al. (Reference Ferlay, Martin, Lerch, Gobet, Pradel and Chilliard2010).
Milk sampling and analyses
The individual milk yield was recorded at each milking (days 1 to 17). Individual milk samples were collected at the beginning of each MD paddock utilisation for 3 consecutive days (days 1, 2, 3 and 10, 11, 12 for Paddocks 1 and 2, respectively) and at the end of each MD paddock utilisation for the last 2 days (days 9, 10 and 16, 17 for Paddocks 1 and 2, respectively). Milk samples from the LD cows were collected on the same dates as the MD cows. A sub-sample was preserved with bronopol-B2, stored at 4°C and analysed for fat and protein contents by standard procedures (MilkoScan 4000, Foss System, Hillerød, Denmark, AOAC, 1997). Another sub-sample was stored at −20°C until the FA analysis. After having lyophilised (Thermovac TM-20; Froilabo S.A., Ozoir-la-Ferriere, France), the milk samples were methylated and analysed according to Ferlay et al. (Reference Ferlay, Martin, Lerch, Gobet, Pradel and Chilliard2010). The FA methyl esters (FAME) were injected (0.6 μl) by an auto-sampler into a gas chromatograph equipped with a flame ionisation detector (Agilent Technologies 7890A, Wilmington, DE, USA). The FAMEs from all the samples were separated on a 100 m×0.25 mm i.d. fused-silica capillary column (CP-Sil 88; Chrompack, Middelburg, The Netherlands). The injector temperature was maintained at 255°C and the detector temperature at 260°C. The initial oven temperature was held at 70°C for 1 min, increased to 100°C at a rate of 5°C/min (held for 2 min), then increased by 10°C/min to 175°C (held for 42 min) and 5°C/min to a final temperature of 225°C (held for 15 min). The carrier gas was hydrogen and the pressure was maintained constant (158.6 kPa) during analysis. Peaks were routinely identified by comparing retention times against commercial authentic standards. The FAME proportions were corrected to FA proportions according to their respective molecular weight.
Statistical analyses
Statistical analyses were performed using the SPSS for Windows software package (Version 16.0; SPSS Inc., Chicago, IL, USA). One cow from the LD system was removed from the statistical analyses because of severe digestive problems. This animal was fed hay just before the experiment. The milk FA composition was affected by the hay-based diet, resulting in milk samples not representative of the grazing system. For each grazing system, the data of grazing selection, simulated bites and milk yield and composition were analysed using the repeated measures model of ANOVA, with the day as the repeated factor. For data of the MD system, the paddock was used as a fixed factor and the paddock×day interaction was also tested. In the first step of data exploration, the statistical model included the day as the repeated factor, the breed effect as a fixed factor and the DIM were used as covariate. As the covariate and the breed effect were never significant, a new repeated measures model of ANOVA was tested with only the day as the repeated factor. A principal component analysis (PCA) was performed on the main milk FA, parameters of grazing selection and composition of simulated bites, aiming to show the relationships between the milk fat proportions of FA and grazing selection of cows in the two grazing systems. As the literature data showed a 1-day delay in the response of milk fat proportions of FA to paddock changes (Khanal et al., Reference Khanal, Dhiman and Boman2008; Vlaeminck et al., Reference Vlaeminck, Abrahamse, Fievez, Lourenco, Dijkstra and Tamminga2010; Coppa et al., Reference Coppa, Gorlier, Lonati, Martin, Russo and Lombardi2012), to perform the PCA, data of cow grazing selection were associated with FA composition of milk sampled the day after the grazing selection measurements.
Results
Milk FA composition
The results of the proportions of the complete FA profiles for LD and MD milk samples are given in Supplementary Tables S1 and S2, respectively.
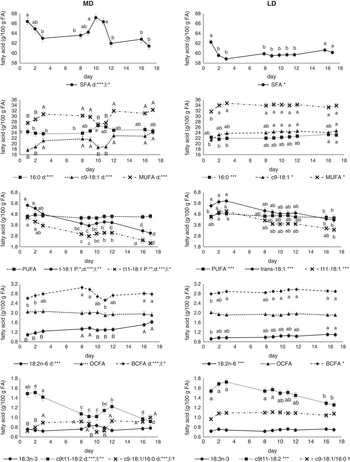
Rapid changes in milk FA composition were observed within the first 2 days after moving cows to a new paddock on both systems (Figure 1). A change from day 1 to day 2 was observed in the LD milk fat proportions of de novo-synthesised FA, saturated fatty acids (SFA) and monounsaturated fatty acids (MUFA), as well as the t10-18:1/t11-18:1 ratio (−2.2, −2.7, +2.3/100 g and −0.02, respectively). The proportions of almost all FA in the LD milk were stable after day 2 (Figure 1), as in the case of de novo-synthesised FA and MUFA, whereas the c9,t11-CLA and trans FA proportions slightly decreased until day 17. The 16:0, c9-18:1, 18:2n-6 and SFA proportions and the 18:2n-6/18:3n-3 ratio slightly increased from day 3 to day 17 in the LD pasture (Figure 1).
Changes in milk fatty acid composition1 during utilisation of the medium duration (MD) and long duration (LD) paddocks. FA=fatty acid; SFA=sum of saturated fatty acids (from 4:0 to 24:0, including odd- and branched-chain fatty acids); OCFA=sum of odd-chain fatty acid (from 5:0 to 23:0); BCFA=sum of branched-chain fatty acids (from iso-13:0 to iso-18:0); MUFA=sum of monounsaturated fatty acid (from c9-10:1 to c11-20:1); PUFA=sum of polyunsaturated fatty acids (from t9t12-18:2 to 22:6n-3). In MD values with different lowercase letters differed at P<0.05 for paddock×day interaction; values with different capital letters differed at P<0.05 for day effect; P=paddock effect; d=day effect; I=paddock×day interaction effect; †P<0.10; *P<0.05; **P<0.01; ***P<0.001; when the significance is not given P>0.10. In LD values with different lowercase letters differed at P<0.05 for day effect; †P<0.10; *P<0.05; **P<0.01; ***P<0.001; when the significance symbol is not given P>0.10.

The MD milk fat proportions of almost all FA showed significant changes at paddock moving (Figure 1). The MD milk fat proportions of de novo-synthesised FA, c9,t11-CLA and SFA decreased from day 3 to day 9 for both paddocks, but important changes were observed for day 9 of Paddock 1 and day 2 of Paddock 2 (Figure 1). The MD milk fat proportion of 16:0 followed the same trend. The MD milk fat proportions of c9-18:1 and MUFA and 18:2n-6/18.3n-3 and c9-18:1cis9/16:0 ratios increased from day 2 to day 9 of each paddock utilisation, showing significant changes with an opposite trend when cows were moved from Paddock 1 to Paddock 2 (Figure 1).
Cow grazing selection
Direct observations of grazing selection
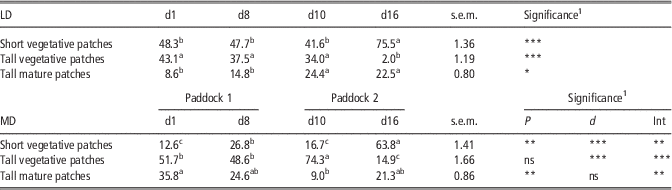
The LD cows selected a similar proportion of TV and SV patches all along the LD paddock utilisation, except the last days for which the proportion of SV patches decreased in favour of that of TV patches (Table 2). The selection of TM patches by LD cows was higher during the last week of utilisation than during the 1st week.
Characteristics of grazed patches of the long (LD) or medium (MD) duration paddocks, obtained by direct observations of cow grazing selection

a,b,cValues within a row with different superscripts differ significantly at P<0.05.
1 P=paddock; d=day; Int=paddock×day interaction.
*P<0.05; **P<0.01; ***P<0.001.
The MD cows selected more SV patches at the end than at the beginning of each paddock utilisation (Table 2). On the contrary, the selection of TV patches was lower at the end than at the beginning of Paddock 2 utilisation.
Simulated bites
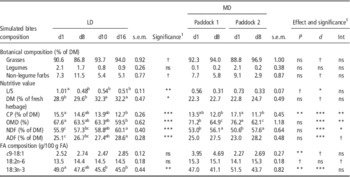
Grasses were the dominant botanical group in the simulated bites of both the MD and LD cows (>85% of DM), whereas legumes were poorly represented (Table 3). No significant differences in the botanical composition of simulated bites were observed among days during the experiment for both the grazing systems. The L/S ratio for LD-simulated bites decreased after the 1st day, and then it remained constant. The L/S for MD-simulated bites decreased from the beginning to the end of each paddock utilisation. The CP content and OMD value of the LD-simulated bites decreased slightly from the beginning to the end of the experiment, while the NDF and ADF contents increased. The CP content and OMD value of the MD-simulated bites increased when moving cows from Paddock 1 to Paddock 2, whereas the opposite trend was observed for the NDF and ADF contents. The 18:3n-3 proportion of the LD- or MD-simulated bites decreased slightly from the beginning to the end of each paddock utilisation, with an important increase at paddock change. The 18:2n-6 proportion of the LD- or MD-simulated bites did not change during the experimental period. Only the c9-18:1 proportion of MD-simulated bites increased during the utilisation of Paddock 1.
Botanical composition, chemical composition, oleic, linoleic and linolenic acid proportions of simulated bites of the long (LD) or medium (MD) paddocks

DM=dry matter; OMD=organic matter digestibility; L/S=grass leaf-to-stem ratio.
a,b,cValues within a row with different superscripts differ significantly at P<0.05.
1 P=paddock; d=day; int=paddock×day interaction..
†P<0.10; *P<0.05; **P<0.01; ***P<0.001.
Dairy cow performance
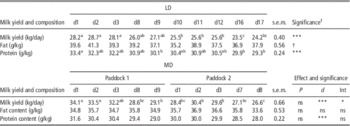
From the beginning to the end of the experiment, the LD daily milk yield decreased regularly, whereas the MD value decreased more dramatically, but with a recovery of 2 kg/day between the two paddocks (Table 4). The milk protein content decreased from the beginning to the end of the experiment in both systems, whereas the milk fat content tended to decrease (P<0.10) for LD and was stable for the MD system (Table 4).
Milk production and composition of cows offered the long (LD) or medium (MD) duration paddocks

a,b,cValues within a row with different superscripts differ significantly at P<0.05.
1 P=paddock; d=day; Int=interaction day×paddock; ns=not significant.
†P<0.10; *P<0.05; **P<0.01; ***P<0.001.
Relationships between grazing selection and milk FA composition
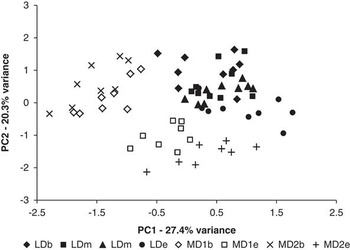
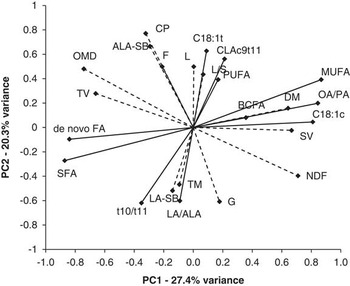
On the PCA plot of individual distribution, samples were separated according to the day of paddock utilisation for principal component 1 (PC1 scores increasing from the beginning to the end of the utilisation) and according to the grazing system for both PC1 and PC2 (Figure 2). On PCA plot of variable distribution, PC1 (27.4% of variance) was positively and very closely correlated to the DM and NDF contents for the simulated bites, SV patches and milk fat proportions of cis isomers of 18:1 and MUFA and c9-18:1/16:0 ratio (Figure 3; correlation coefficients with PC1>0.64). The PC1 was also negatively and closely correlated to the OMD value of simulated bites, total TV patches, milk fat proportions of SFA and de novo-synthesised FA (Figure 3; correlation coefficients with PC1<−0.66). The PC2 (20.3% of variance) was correlated to the CP content, OMD value, the proportion of legumes and non-legume forbs, the L/S of simulated bites and milk fat proportions of c9,t11-CLA, trans isomers of 18:1 and PUFA (Figure 3; correlation coefficients with PC2>0.44), and negatively correlated to the NDF content and grasses proportion of simulated bites, TM patches and milk 18:2n-6/18:3n-3 and t10-18:1/t11-18:1 ratios (Figure 3; correlation coefficients with PC2<−0.40).
Principal component analysis (PCA) performed on the main milk fatty acid proportions, the grazing selection and composition of simulated bites. Plot of sample distribution of the medium (MD) and long (LD) grazing systems and day of paddock utilisation, projected on the two principal components (PC1 and PC2). LD=long duration of paddock utilisation on heterogeneous pasture; MD=medium duration of paddock utilisation on intensively managed pastures; b=beginning; m=middle; e=end; MD 1 and MD 2 indicated the Paddocks 1 and 2, respectively.

Principal component analysis (PCA) performed on the main milk fatty acid (FA) proportions, the grazing selection and composition of simulated bites3. Plot of variables distribution projected on the two principal components (PC1 and PC2). BCFA=branched-chain fatty acids; C18:1c=cis-18:1; C18:1t=trans-18:1; CLAc9t11=c9,t11-18:2; de novo FA=de novo-synthesised FA; linoleic acid/α-linolenic acid (LA/ALA)=18:2n-6/18:3n-3 ratio; MUFA=monounsaturated fatty acids; OA/PA=c9-18:1/16:0 ratio; PUFA=polyunsaturated fatty acids; SFA=saturated fatty acids; t10/t11=t10-18:1/t11-18:1 ratio. TM=tall mature patches; TV=tall vegetative patches; SV=short vegetative patches. Chemical composition and species proportion of stimulated bites: DM=dry matter; F=non-legume forbs proportion; G=grasses proportion; L=legumes proportion; L/S=grass leaf-to-stem ratio; OMD=organic matter digestibility; SB-ALA: 18:3n-3 proportion of stimulated bites; SB-LA: 18:2n-6 proportion of stimulated bites.

Discussion
The original result of this study is the broad day-to-day changes in milk FA composition when dairy cows moved to new paddocks in relationship with the changes in herbage composition and grazing selection of the cows.
An abrupt change in milk FA composition in the MD milk was highlighted when cows were moved to Paddock 2, changing their selection from the bottom layers of the previous paddock (rich in short patches and with a high proportion of stems and fibre content) to the top vegetative layers of the new paddock rich in leaves. The PCA confirms this marked separation between the samples derived from the beginning to the end of each MD paddock utilisation. These findings are supported by our results on the simulated bites. Indeed, the MD-simulated bites at the beginning of each paddock utilisation were characterised by a higher CP content and OMD value than at the end of utilisation. The high L/S and the selection of TV patches support the hypothesis that cows grazed ‘by layers’ (Teague and Dowhower, Reference Teague and Dowhower2003; Coppa et al., Reference Coppa, Farruggia, Pradel, Lombardi and Martin2011a). The SV patches were selected as the paddock utilisation progressed. Consequently, the quality of consumed patches rapidly decreased, whereas the proportion of stems increased, mainly located in the lower sward layers, as shown by Abrahamse et al. (Reference Abrahamse, Dijkstra, Vlaeminck and Tamminga2008). Thus, a rapid change in the quality and composition of grazed patches is in agreement with a shift from the lower level of a paddock to the upper layer of the following one. The increase in the selection of short patches with high DM proportion during paddock utilisation was found much more important with increasing stocking density and utilisation rate (Abrahamse et al., Reference Abrahamse, Dijkstra, Vlaeminck and Tamminga2008).
This grazing ‘by layers’ causes a rapid increase in the nutritional quality of ingested patches from the end to the beginning of paddock utilisation at paddock change (Abrahamse et al., Reference Abrahamse, Dijkstra, Vlaeminck and Tamminga2008). As a consequence, the dietary readily available energy supply increased and could have favoured mammary lipogenesis, as suggested by the higher milk fat proportions of de novo-synthesised FA obtained in our study and in agreement with Dewhurst et al. (Reference Dewhurst, Shingfield, Lee and Scollan2006). The increase in the 18:3n-3 proportion of simulated bites could have increased the ruminal production of intermediate products, including t11-18:1, and thus their proportions in milk fat (Chilliard et al., Reference Chilliard, Glasser, Ferlay, Bernard, Rouel and Doreau2007). Moreover, due to a lower proportion of stems, the reduced herbage NDF and ADF contents at the beginning of MD paddock utilisation at paddock change could disfavour the development of cellulolytic bacteria in the rumen. As these bacteria are implicated in the production of branched-chain fatty acid (BCFA) (Vlaeminck et al., Reference Vlaeminck, Fievez, Cabrita, Fonseca and Dewhurst2006), this can explain the lower milk fat proportion of BCFA at changing MD paddock. Furthermore, the c9-18:1/16:0 ratio varied rapidly about 1.0 to 0.7 at MD paddock change. Couvreur et al. (Reference Couvreur, Hurtaud, Lopez, Delaby and Peyraud2006) showed that a decrease in c9-18:1/16:0 ratio below 0.8 was sufficient to change thermal characteristics of butter fat, and a decrease below 0.9 made perceptible in mouth a softer butter texture. In addition, the variations of SFA and MUFA proportions, linked to dairy product texture, were large (differences of about 6/100 g FA in SFA and MUFA proportions).
Such extent of FA variations of the MD milk at paddock change was quite unexpected, considering that each cow additionally received 4 kg of concentrate/day. Indeed, the marked effect of concentrate intake was a high milk fat proportion of 18:2n-6 for the MD cows (on average 1.03 v. 1.35/100 g FA for LD and MD groups, respectively), in agreement with Chilliard et al. (Reference Chilliard, Glasser, Ferlay, Bernard, Rouel and Doreau2007). The concentrate intake did not change the milk fat proportions of 18:3n-3 between the two groups (0.74 v. 0.77/100 g FA for LD and MD groups, respectively). Furthermore, the extent of our variations was similar to those of Vlaeminck et al. (Reference Vlaeminck, Abrahamse, Fievez, Lourenco, Dijkstra and Tamminga2010), obtained with cows grazing on temporary lowland grassland, although in this experiment cows were supplemented only with 2.4 kg of concentrate/day. The range of variations at MD paddock change was also similar to those observed by Coppa et al. (Reference Coppa, Ferlay, Monsallier, Verdier-Metz, Pradel, Didienne, Farruggia, Montel and Martin2011c) from the beginning to the end of a grazing season. These authors showed significant effects of variations of FA proportions across the season on cheese texture and appearance.
Regarding the MD milk production, the cyclic and consistent decrease in milk yield during each MD paddock utilisation and the increase at paddock change were already observed by Hoden et al. (Reference Hoden, Muller, Journet and Faverdin1986) and by Farruggia et al. (Reference Farruggia, Pomiès, Coppa, Ferlay, Verdier-Metz, Le Morvan, Bethier, Pompanon, Troquier and Martin2014), and are consistent with the evolution of the quality of patches grazed by layers.
The FA proportions in LD milk were stable from day 3, after the adaptation of the cows to the characteristics of the herbage of the new paddock. The milk fat proportions of de novo-synthesised FA, BCFA and MUFA (including c9-18:1, cis-18:1 and trans-18:1) changed slightly between the beginning to the end of LD paddock utilisation. This slight differentiation was also confirmed by the poor separation of these milk samples on the PCA axes (Figure 2).
The free-grazing selection allowed the LD cows to ingest herbage with fibre and CP contents and OMD values that were quite constant throughout the experiment (Dumont et al., Reference Dumont, Garel, Ginane, Decuq, Farruggia, Pradel, Rigolot and Petit2007; Coppa et al., Reference Coppa, Farruggia, Pradel, Lombardi and Martin2011a). The overgrazing of preferred patches was also observed on continuous grazing systems at the beginning of the season (Coppa et al., Reference Coppa, Farruggia, Pradel, Lombardi and Martin2011a).
The biodiversity and heterogeneity in species distribution of the vegetation of LD pasture can result in patches with different palatabilities and nutritive value (Dumont et al., Reference Dumont, Garel, Ginane, Decuq, Farruggia, Pradel, Rigolot and Petit2007; Coppa et al., Reference Coppa, Farruggia, Pradel, Lombardi and Martin2011a; Farruggia et al., Reference Farruggia, Pomiès, Coppa, Ferlay, Verdier-Metz, Le Morvan, Bethier, Pompanon, Troquier and Martin2014), allowing cows to select vegetative patches with high proportion of leaves, CP content and OMD value and low NDF and ADF contents, in agreement with our results. As the LD pasture utilisation progressed, the cows selected less TV patches in favour of the SV and TM patches that became dominant at the end of utilisation. The decrease in CP content and OMD value of the simulated bites and the increase in the NDF and ADF contents appear to be contradictory to the increase in the number of short patches at vegetative stage. However, the overgrazing of the preferred and already partially consumed patches – so-called ‘patch grazing’ (Adler et al., Reference Adler, Raff and Lauenroth2001), characteristic of extensive grazing management – could easily explain this apparent contradiction. The short patches, although at a vegetative stage, contained grasses with a high proportion of stems and with higher NDF and ADF contents (Coppa et al., Reference Coppa, Farruggia, Pradel, Lombardi and Martin2011a).
The low selection of legumes and non-legume forbs by grazing cows may be because of the small size of legumes and non-legume forbs, compared with the tall dominant grass, which could limit their prehension by grazing cows (Carpino et al., Reference Carpino, Licitra and Van Soest2003). This result could explain the small changes in milk fat proportions of n-3 FA when compared with other studies in upland pastures (Collomb et al., Reference Collomb, Bütikofer, Sieber, Jeangros and Bosset2002; Leiber et al., Reference Leiber, Kreuzer, Nigg, Wettstein and Scheeder2005; Coppa et al., Reference Coppa, Ferlay, Monsallier, Verdier-Metz, Pradel, Didienne, Farruggia, Montel and Martin2011c), because legumes are rich in 18:3n-3 (Chilliard et al., Reference Chilliard, Glasser, Ferlay, Bernard, Rouel and Doreau2007). However, in those studies on upland pasture, the cow grazing selection and the chemical composition, phenology and leafiness of selected patches were poorly investigated.
The moderate decrease observed in milk yield for LD is in agreement with the high herbage allowance and the selection of high nutritive value patches by grazing cows through patch grazing (Adler et al., Reference Adler, Raff and Lauenroth2001; Farruggia et al., Reference Farruggia, Pomiès, Coppa, Ferlay, Verdier-Metz, Le Morvan, Bethier, Pompanon, Troquier and Martin2014). Further investigation would be required to determine whether this rapid variation in milk yield would also be observed at LD paddock changes. Indeed, the LD system could be sensitive in late season, when the regrowth of high-quality patches is limited (i.e. by the dryness), and the cows have been obliged to also graze the less-preferred patches, with a consequent decrease in milk yield (Coppa et al., Reference Coppa, Farruggia, Pradel, Lombardi and Martin2011a; Farruggia et al., Reference Farruggia, Pomiès, Coppa, Ferlay, Verdier-Metz, Le Morvan, Bethier, Pompanon, Troquier and Martin2014).
In conclusion, our study highlighted important variations of milk FA composition at each paddock change. These variations could be related to the characteristics of the vegetation grazed by the cows. The extent of milk FA variations could be frequent in intensive grazing systems and sufficient to influence cheese sensory properties such as texture and appearance. Furthermore, these milk FA variations could be difficult to evaluate and manage for farmers who deliver milk to dairy plants in the case of milk payment based on FA proportions, which is occurring in some European countries (Borreani et al., Reference Borreani, Coppa, Revello-Chion, Comino, Giaccone, Ferlay and Tabacco2013). The variations observed in our experiment could be a criticism if milk payment based on proportions of FA will be extensively introduced. In this case, adaptation to rotational grazing systems should be tested, aiming to reduce these variations, such as moving cows to a new paddock before the end of herbage utilisation and introduce other livestock categories to finish the utilisation. Applying different grazing systems in several geographical areas, with various vegetation types, and studying day-to-day variations of milk FA composition all along the grazing season would be needed to give farmers valuable tools to manage these variations.
Acknowledgements
This work was funded by the transversal programme on dairy systems of the INRA-UMR 1213 Herbivores. The authors also thank D. Bany and E. Tixier for the determination of the FA composition of the stimulated bites and milk, respectively.
Supplementary material
To view supplementary material for this article, please visit http://dx.doi.org/10.1017/S1751731114003000.