





Attention-deficit hyperactivity disorder (ADHD) is classified as a neurodevelopmental disorder characterised by core symptoms of inattention, impulsivity and/or hyperactivity. 1 Diagnostic criteria require symptoms to be present in at least two different settings, and problems in school are often the initial cause for referral to health services. Previous research has shown that students with ADHD have lower test scores in reading, writing, spelling and maths; lower grades and grade point average; and increased absenteeism, grade retention and school drop-out. Reference Lawrence, Houghton, Dawson, Sawyer and Carroll2–Reference Fleming, Fitton, Steiner, McLay, Clark and King4 Pharmacological treatment, particularly with stimulants, robustly reduces core ADHD symptoms in randomised controlled trials (RCTs) and evidence syntheses. Reference Cortese, Adamo, Del Giovane, Mohr-Jensen, Hayes and Carucci5–Reference Gosling, Garcia-Argibay, De Prisco, Arrondo, Ayrolles and Antoun7 Whether it improves long-term academic performance is less clear; recent evidence syntheses conclude that high-quality evidence on long-term functional outcomes is sparse. Reference Chaulagain, Lyhmann, Halmøy, Widding-Havneraas, Nyttingnes and Bjelland8,Reference Kortekaas-Rijlaarsdam, Luman, Sonuga-Barke and Oosterlaan9 Most RCTs on pharmacological treatment for ADHD have follow-up periods of 12 weeks or less, Reference Cortese, Adamo, Del Giovane, Mohr-Jensen, Hayes and Carucci5 and trials on educational outcomes commonly span only a few days. Reference Kortekaas-Rijlaarsdam, Luman, Sonuga-Barke and Oosterlaan9 Consequently, effects are measured on standardised achievement tests, which may not translate into improved results on functionally relevant outcomes such as grades and drop-out rates. Reference Kortekaas-Rijlaarsdam, Luman, Sonuga-Barke and Oosterlaan9,Reference Langberg and Becker10 It has thus been questioned whether findings from such studies are clinically meaningful, Reference Kortekaas-Rijlaarsdam, Luman, Sonuga-Barke and Oosterlaan9,Reference Langberg and Becker10 and whether results are maintained over time. Reference Currie, Stabile and Jones11 Observational studies, in contrast, can investigate associations between pharmacological treatment and functional academic outcomes in a wider time perspective, but are constrained in terms of causal inference because of potential confounding and bias.
As a pragmatic compromise between RCTs and observational studies, administrative data can be used to conduct quasi-experiments that combine better control for unobserved confounding with long-term follow-up and functional outcomes. In the current study, we implemented a quasi-experimental design that exploits as-if random geographical variation in pharmacological treatment of ADHD in Norway. Reference Mykletun, Widding-Havneraas, Chaulagain, Lyhmann, Bjelland and Halmøy12–Reference Hofstad, Nyttingnes, Bjelland and Mykletun18 Using variation in providers’ treatment preferences as an instrumental variable, our objective was to examine long-term causal effects of pharmacological treatment for ADHD on functional academic outcomes. Our main outcome measures were final grades for nine common subjects and their combined grade point average in tenth grade.
Given limited RCT evidence for long-term effects and recent findings of attenuated effects in marginal-patient subgroups, Reference Kazda, Bell, Thomas, McGeechan, Sims and Barratt19,Reference Li, Coghill, Sjölander, Yao, Zhang and Kuja-Halkola20 we hypothesised that instrumental variable estimates for patients on the margin of treatment would be small or null, whereas ordinary least squares (OLS) estimates would show small positive associations reflecting residual confounding.
Method
Sample
Norway has a universal healthcare system, and virtually all contact with clinical services and medication prescriptions are recorded in comprehensive national registries covering the entire population on the individual level. Specialist ADHD assessment and pharmacological treatment initiation is delivered through approximately 80 publicly funded child and adolescent mental health service (CAMHS) clinics, each serving a defined catchment area; switching between clinics is rare. Reference Mykletun, Widding-Havneraas, Chaulagain, Lyhmann, Bjelland and Halmøy12–Reference Chaulagain, Widding-Havneraas, Elwert, Markussen, Lyhmann and Halmøy16 We analysed data from several national registries in Norway, linked on the individual level by deidentified social security numbers. We assembled two data-sets, one of patients and one of healthy controls. The patient sample included all children in the Norwegian population aged 5–18 years who had any contact with CAMHS in 2009–2011. This inclusion window allows sufficient follow-up to tenth grade graduation; the same window is used across the project. Reference Mykletun, Widding-Havneraas, Chaulagain, Lyhmann, Bjelland and Halmøy12 The healthy control sample consisted of individuals from the general population who were not in contact with the CAMHS during 2009–2011, and was matched to the CAMHS sample on place of residence, gender (as recorded in the national registries, i.e. legal/registered gender) and age, on a randomly chosen date in 2009–2011.
The ADHD patient sample was selected from the CAMHS data-set and consisted of all individuals who received their ADHD diagnosis in CAMHS, as registered in the Norwegian Patient Registry, during 2009–2011 (n = 8051). ADHD was defined as ICD-10 hyperkinetic disorder diagnoses F90.0 (81.3%), F90.1 (11.3%), F90.8 (6.2%) and F90.9 (1.1%). We included only cases with complete data on all variables (n = 7302) and where the student received any of the relevant grades in the included school subjects (see Outcome; n = 7282). We further restricted the sample to individuals who received the ADHD diagnosis at least 6 months before their graduation from tenth grade (n = 6481), as we considered this the minimum time for treatment to be initiated and plausibly affecting final grades (outcome measurement). Finally, individuals who were 16 years or older at the time of ADHD diagnosis were excluded, as graduating later is highly unusual and these students likely represent extraordinary cases. The final ADHD sample thus comprised 6255 individuals.
For descriptive analyses, we included two comparison samples: a non-ADHD psychiatric patient group, consisting of all of the 5- to 15-year-old children who were in contact with CAMHS between 2009 and 2011, but were not registered with ADHD (n = 50 328); and a corresponding healthy control group (n = 51 609).
Measures
Treatment
Medication data included information from the Norwegian Prescription Database about filled prescriptions for methylphenidate (87.4% of total prescriptions; Anatomical Therapeutic Chemical (ATC) code N06BA04; World Health Organization (WHO) defined daily dose (DDD) 30 mg/day), atomoxetine (9.9% of total prescriptions; ATC code N06BA09; DDD 80 mg/day), lisdexamfetamine (2.2% of total prescriptions; ATC code N06BA12; DDD 30 mg/day), dexamfetamine (0.4% of total prescriptions; ATC code N06BA02; DDD 15 mg/day), guanfacine (0.2% of total prescriptions; ATC code C02AC02; DDD 3 mg/day) and racemic amfetamine (0.1% of total prescriptions; ATC code N06BA01; DDD 15 mg/day). Treatment was measured as the cumulative number of DDDs collected by the patient during the follow-up period, i.e. from the time of ADHD diagnosis until tenth grade graduation. The DDD is a WHO measurement unit for drug utilisation, not an optimal individual dose; the same exposure measure is used in our previous papers. Reference Widding-Havneraas, Zachrisson, Markussen, Elwert, Lyhmann and Chaulagain13–Reference Chaulagain, Widding-Havneraas, Elwert, Markussen, Lyhmann and Halmøy16 The WHO DDD value is fixed across patients and clinics, so any DDD imprecision is unrelated to our clinic-level instrument. Measurement was scaled so that a value of one corresponds to an approximation of ‘full-time treatment’ (i.e. 365 DDD if follow-up was 1 year, 730 DDD if follow-up was 2 years, etc.). Medication is often combined with non-pharmacological treatment interventions. However, these interventions are not recorded in the registries, and thus could not be included as variables in this study.
Outcome
Academic outcome measures consisted of final grades at graduation from compulsory schooling in tenth grade (at age 15 or 16 years, depending on birth month), as registered in the Norwegian National Education Database. Teacher assigned grades are designated on a scale from 1 to 6, with higher scores indicating better performance (1 equals fail). In some instances, students will qualify for exemption: the school subject is not assessed, and is excluded when calculating the grade point average. For instance, this may be the case for students struggling with severe intellectual disabilities or for newly arrived immigrants. If teachers conclude that they have insufficient information to evaluate a student in the subject at all, e.g. because of excessive absence from class, they may assign the grade ‘no basis for assessment’ (NBA). This grade is scored as 0 when calculating grade point average, following the Norwegian convention for lower secondary school points prescribed in the regulations to the Education Act and used by Statistics Norway and the Directorate for Education in official statistics. Reference Sunde, Kleppestø, Gustavson, Nordmo, Reme and Torvik21,Reference Arencibia Alemán, Sandsør, Zachrisson and Blömeke22 Schools have a statutory obligation to provide an assessable basis through differentiated instruction and special education; NBA is reserved for residual cases where no basis can be established.
We separately analysed the subject-specific grades in the nine school subjects that are mandatory in tenth grade (Norwegian – written and oral, English – written and oral, maths, science, social studies, religion and physical education) and the grade point average defined as their average. Exemption and NBA are additionally analysed separately as binary outcomes, where 1 indicates having been exempted or denied assessment, respectively, in at least one school subject.
Covariates
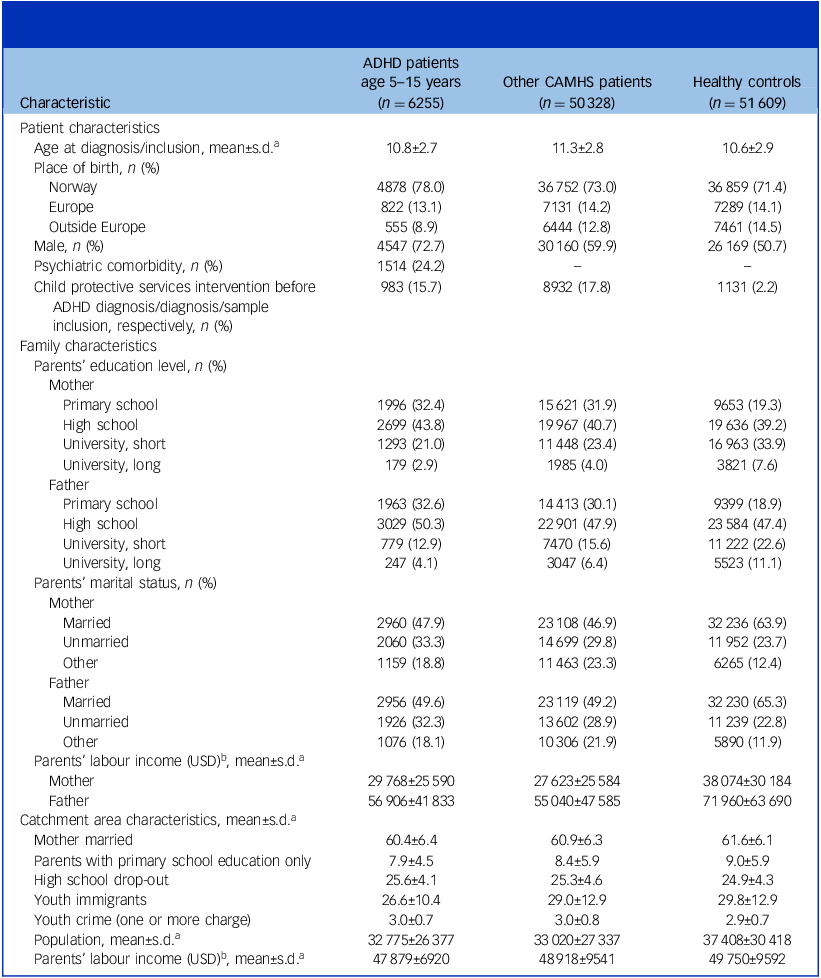
All analyses controlled for multiple individual, family and CAMHS clinic catchment area covariates, e.g. gender, parents’ educational level and high school drop-out rate, listed in Table 1.
Baseline characteristics of patients diagnosed with attention-deficit hyperactivity disorder aged 5–15 years, other child and adolescent mental health services patients aged 5–15 years and healthy controls in Norway 2009–2011

Table 1 Long description
The table presents baseline characteristics of patients diagnosed with attention-deficit/hyperactivity disorder (ADHD) aged 5-15 years, other child and adolescent mental health services (CAMHS) patients aged 5-15 years, and healthy controls in Norway from 2009 to 2011. The table is divided into several sections: Patient characteristics, Family characteristics, and Catchment area characteristics. Each section contains multiple rows and columns with specific data points. Patient characteristics include age at diagnosis/inclusion, place of birth, gender, psychiatric comorbidity, and child protective services intervention. Family characteristics include parents’ education level, parents’ marital status, and parents’ labor income in USD. Catchment area characteristics include the percentage of mothers married, parents with primary school education only, high school drop-out rate, youth immigrants, youth crime, population, and parents’ labor income in USD. The table provides mean values and standard deviations for various metrics. Row 1: ADHD patients age 5-15 years (n = 6255), Other CAMHS patients (n = 50328), Healthy controls (n = 51609). Row 2: Age at diagnosis/inclusion, 10.8 ± 2.7, 11.3 ± 2.8, 10.6 ± 2.9. Row 3: Place of birth, Norway, 4878 (78.0), 36752 (73.0), 36859 (71.4). Row 4: Place of birth, Europe, 822 (13.1), 7131 (14.2), 7289 (14.1). Row 5: Place of birth, Outside Europe, 555 (8.9), 6444 (12.8), 7461 (14.5). Row 6: Male, 4547 (72.7), 30160 (59.9), 26169 (50.7). Row 7: Psychiatric comorbidity, 1514 (24.2), 8932 (17.8), 1131 (2.2). Row 8: Child protective services intervention before ADHD diagnosis/diagnosis/sample inclusion, 983 (15.7), 8932 (17.8), 1131 (2.2). Row 9: Parents’ education level, Mother: Primary school, 1996 (32.4), 15621 (31.9), 9653 (19.3). Row 10: Parents’ education level, Mother: High school, 2699 (43.8), 19967 (40.7), 19636 (39.2). Row 11: Parents’ education level, Mother: University, short, 1293 (21.0), 11448 (23.4), 16963 (33.9). Row 12: Parents’ education level, Mother: University, long, 179 (2.9), 1985 (4.0), 3821 (7.6). Row 13: Parents’ education level, Father: Primary school, 1963 (32.6), 14413 (30.1), 9399 (18.9). Row 14: Parents’ education level, Father: High school, 3029 (50.3), 22901 (47.9), 23584 (47.4). Row 15: Parents’ education level, Father: University, short, 779 (12.9), 7470 (15.6), 11222 (22.6). Row 16: Parents’ education level, Father: University, long, 247 (4.1), 3047 (6.4), 5523 (11.1). Row 17: Parents’ marital status, Mother: Married, 2960 (47.9), 23108 (46.9), 32236 (63.9). Row 18: Parents’ marital status, Mother: Unmarried, 2060 (33.3), 14699 (29.8), 11952 (23.7). Row 19: Parents’ marital status, Mother: Other, 1159 (18.8), 11463 (23.3), 6265 (12.4). Row 20: Parents’ marital status, Father: Married, 2956 (49.6), 23119 (49.2), 32230 (65.3). Row 21: Parents’ marital status, Father: Unmarried, 1926 (32.3), 13602 (28.9), 11239 (22.8). Row 22: Parents’ marital status, Father: Other, 1076 (18.1), 10306 (21.9), 5890 (11.9). Row 23: Parents’ labor income (USD), Mother, 29768 ± 25590, 27623 ± 25584, 38074 ± 30814. Row 24: Parents’ labor income (USD), Father, 56906 ± 41833, 55040 ± 47585, 71960 ± 63690. Row 25: Catchment area characteristics, Mother married, 60.4 ± 6.4, 60.9 ± 6.3, 61.6 ± 6.1. Row 26: Catchment area characteristics, Parents with primary school education only, 7.9 ± 4.5, 8.4 ± 5.9, 9.0 ± 5.9. Row 27: Catchment area characteristics, High school drop-out, 25.6 ± 4.1, 25.3 ± 4.6, 24.9 ± 4.3. Row 28: Catchment area characteristics, Youth immigrants, 26.6 ± 10.4, 29.0 ± 12.9, 29.8 ± 12.9. Row 29: Catchment area characteristics, Youth crime, 3.0 ± 0.7, 3.0 ± 0.8, 2.9 ± 0.7. Row 30: Catchment area characteristics, Population, 32775 ± 26377, 33020 ± 27337, 37408 ± 30418. Row 31: Catchment area characteristics, Parents’ labor income (USD), 47879 ± 6920, 48918 ± 9541, 49750 ± 9592.
Individual-level covariates measured at baseline. Parents’ labour income and education level measured at the time the child was age 6 years. Catchment area covariates measured in 2009–2011. Municipality-level percentage of youth immigrants, marriage among mothers, parents’ general education level, parents’ average labour income and clinic-level percentage of youth crime developed based on aggregated measures of the healthy control sample. ADHD, attention-deficit hyperactivity disorder; CAMHS, child and adolescent mental health services.
a. Plus–minus values are mean±s.d.
b. USD/NOK exchange rate average for 2010 (USD 1/NOK 6.0453).
Statistical analyses
Risk ratios for exemption and NBA in the ADHD sample, compared with the CAMHS sample and healthy control sample, were calculated overall and stratified by gender. We estimated the association between ADHD pharmacological treatment and numerical grades by using OLS regression, and we used linear probability models (LPMs) to examine exemption and NBA. Analyses were adjusted for all baseline covariates and clustered by clinic.
These conventional regression models, however, are likely biased because of unobserved confounding, such as a patient’s unmeasured symptom load that may affect both the receipt of pharmacological treatment and academic performance. To address this bias, we next performed an instrumental variable analysis, a quasi-experimental approach that exploits naturally occurring as-if-random variation in treatment to identify causal effects.
Specifically, we implement a provider-preference instrumental variable design Reference Mykletun, Widding-Havneraas, Chaulagain, Lyhmann, Bjelland and Halmøy12,Reference Widding-Havneraas, Chaulagain, Lyhmann, Zachrisson, Elwert and Markussen23 that exploits as-if-random variation in the pharmacological treatment of ADHD across CAMHS clinics. Reference Ørstavik, Gustavson, Rohrer-Baumgartner, Biele, Furu and Karlstad24 We measured provider preference as the average number of DDDs of ADHD medication filled over the follow-up period by ADHD patients at each clinic. The leave-one-out average was used to eliminate any influence patients may have on their own provider’s preference.
Instrumental variable analysis identifies causal effects under four key assumptions. Reference Widding-Havneraas, Chaulagain, Lyhmann, Zachrisson, Elwert and Markussen23 First, the instrumental variable must predict treatment status (relevance). Second, the instrumental variable should be as good as randomly assigned to patients (independence). Third, the instrumental variable must only impact the outcome through treatment (exclusion). Finally, the instrumental variable must impact treatment status in one direction only (monotonicity).
The relevance assumption was assessed by the first-stage F-statistic. Reference Lee, McCrary, Moreira and Porter25 The independence assumption was assessed with covariate balance plots, Reference Swanson and Hernán26 and the exclusion assumption was examined with reduced form estimates in the healthy control sample. Finally, the relation between provider preference and predicted treatment values was examined as an assessment of monotonicity. Reference Swanson, Miller, Robins and Hernán27
Instrumental variable analysis estimates the local average treatment effect, i.e. the average causal effect of pharmacological treatment for patients whose treatment depends on their healthcare provider’s preference (commonly referred to as patients ‘on the margin’ of treatment as their receipt of medication is subject to professional discretion). This effect does not necessarily generalise to patients for whom there is broad clinical agreement regarding the pharmacological treatment provided.
We adjusted standard errors for clustering at the clinic level in all models. We report OLS, LPM and instrumental variable results with 95% confidence intervals, presented for the overall sample. Because of known associations with both ADHD and academic performance, Reference Sunde, Kleppestø, Gustavson, Nordmo, Reme and Torvik21 we stratified analyses by gender. However, results for females separately were very imprecise, and stratified results are thus not reported. As supplementary analyses, we stratified the sample by age at ADHD diagnosis (median split at 11 years of age), as we suspected that potential medication effects might differ between diagnostic age groups. The local average treatment effect was estimated with two-stage least squares. Probit models were conducted as alternative specifications to LPM and instrumental variable analyses on binary outcomes as robustness checks. Data processing, including visual presentation, was performed in Stata version 17 for Windows (StataCorp LLC, College Station, Texas, USA; https://www.stata.com).
Ethics statement
The research was performed with permission from the Regional Committees for Medical and Health Research Ethics (number 2017/2150/REC South-East D). Because of the large number of individuals included in the samples, the requirement for informed consent was waived. This work has been prospectively registered with the ISRCTN registry (ISRCTN11891971) and protocolled. Reference Mykletun, Widding-Havneraas, Chaulagain, Lyhmann, Bjelland and Halmøy12
Results
Descriptive statistics
Table 1 shows the baseline characteristics of the samples. In the ADHD patient sample, 73% of patients were male, their parents generally had lower education and fewer parents were married than in the two control samples. Parents’ labour income was considerably lower in the two patient groups than among the healthy controls. We further examined how ADHD patient characteristics varied by age at diagnosis and pharmacological treatment status (age at diagnosis by groups: 5–8, 9–12 and 13–15 years; and treatment status (yes/no) for corresponding age periods within each diagnostic age group). Children diagnosed earlier in life had parents with higher education and income (both measured at the time the child was age 6 years) relative to those diagnosed later. The proportion of patients that filled prescriptions was high across all groups and pharmacological treatment periods (74–88%).
Figure 1(a) shows the distribution of grade point averages for each of the three samples, overall and by gender. The ADHD sample performed somewhat poorer than the CAMHS sample, which in turn underperformed considerably compared with healthy controls. Figure 1(b) presents coefficient plots for the risk ratios of the binary outcome variables (exemption and NBA) for the ADHD patient sample compared with the CAMHS and healthy control samples, respectively, overall and by gender. Compared with the healthy control sample, the risk of being exempted or assigned NBA in one or more subjects was considerably higher among both males and females with ADHD (for exemption: overall risk ratio 5.8, 95% CI 5.4–6.3; for NBA: risk ratio 3.9, 95% CI 3.4–4.4). Compared with the CAMHS group, ADHD patients had a risk ratio of 1.2 (95% CI 1.2–1.3) for exemption, whereas the risk of NBA was slightly reduced (risk ratio 0.9, 95% CI 0.8–1.0), driven by females.
(a) Grade point average distribution (kernel smoothed) and mean, overall and by gender, for the three samples (patients diagnosed with ADHD: mean 3.05, s.d. 0.94; other CAMHS patients: mean 3.34, s.d. 1.12; healthy controls: mean 4.14, s.d. 0.94). (b) Coefficient plot of risk ratios for being exempted from or assigned no basis for assessment in one or more school subjects in the ADHD patient sample compared with the healthy control sample (top) and to the CAMHS sample (bottom), overall and by gender. ADHD, attention-deficit hyperactivity disorder; CAMHS, child and adolescent mental health services.

Assessment of instrumental variable
We tested the relevance assumption by inspecting the estimated first-stage F-statistic, which equalled 61.9 (Supplementary Fig. 1A available at https://doi.org/10.1192/bjp.2026.10754). This value falls short of the threshold of F > 104.7 for conventional two-stage least squares t-ratio inference. Reference Lee, McCrary, Moreira and Porter25 However, it exceeds the threshold F > 50 for using Anderson–Rubin tests, which, although their confidence intervals are asymmetrical, are valid and have superior properties in finite samples. Reference Keane and Neal28 The remaining instrumental variable assumptions cannot be empirically tested, but rely on considerations about their credibility based on subject matter expertise and supplementary analyses. Reference Widding-Havneraas, Chaulagain, Lyhmann, Zachrisson, Elwert and Markussen23 The independence assumption was supported by covariate balance plots (Supplementary Fig. 1B) and theoretical arguments that build on the structure of the Norwegian healthcare system: clinics are assigned by residence, parents have no overview of the clinic’s relative prescription rate, and there is very little switching between clinics. Geographical variation in diagnostic rates is not explained by variation in population symptom levels Reference Widding-Havneraas, Markussen, Elwert, Lyhmann, Bjelland and Halmøy17 or catchment area characteristics. Reference Hofstad, Nyttingnes, Bjelland and Mykletun18 Finally, we additionally controlled for baseline covariates to guard against possible violations of independence. Reduced form estimates in the healthy control sample supported exclusion, as provider preference was not related to grades in the healthy control sample (Supplementary Fig. 2). Monotonicity was supported by a positive relation between the instrumental variable and predicted treatment values (Supplementary Fig. 3).
Associations and causal effects of pharmacological treatment on grades
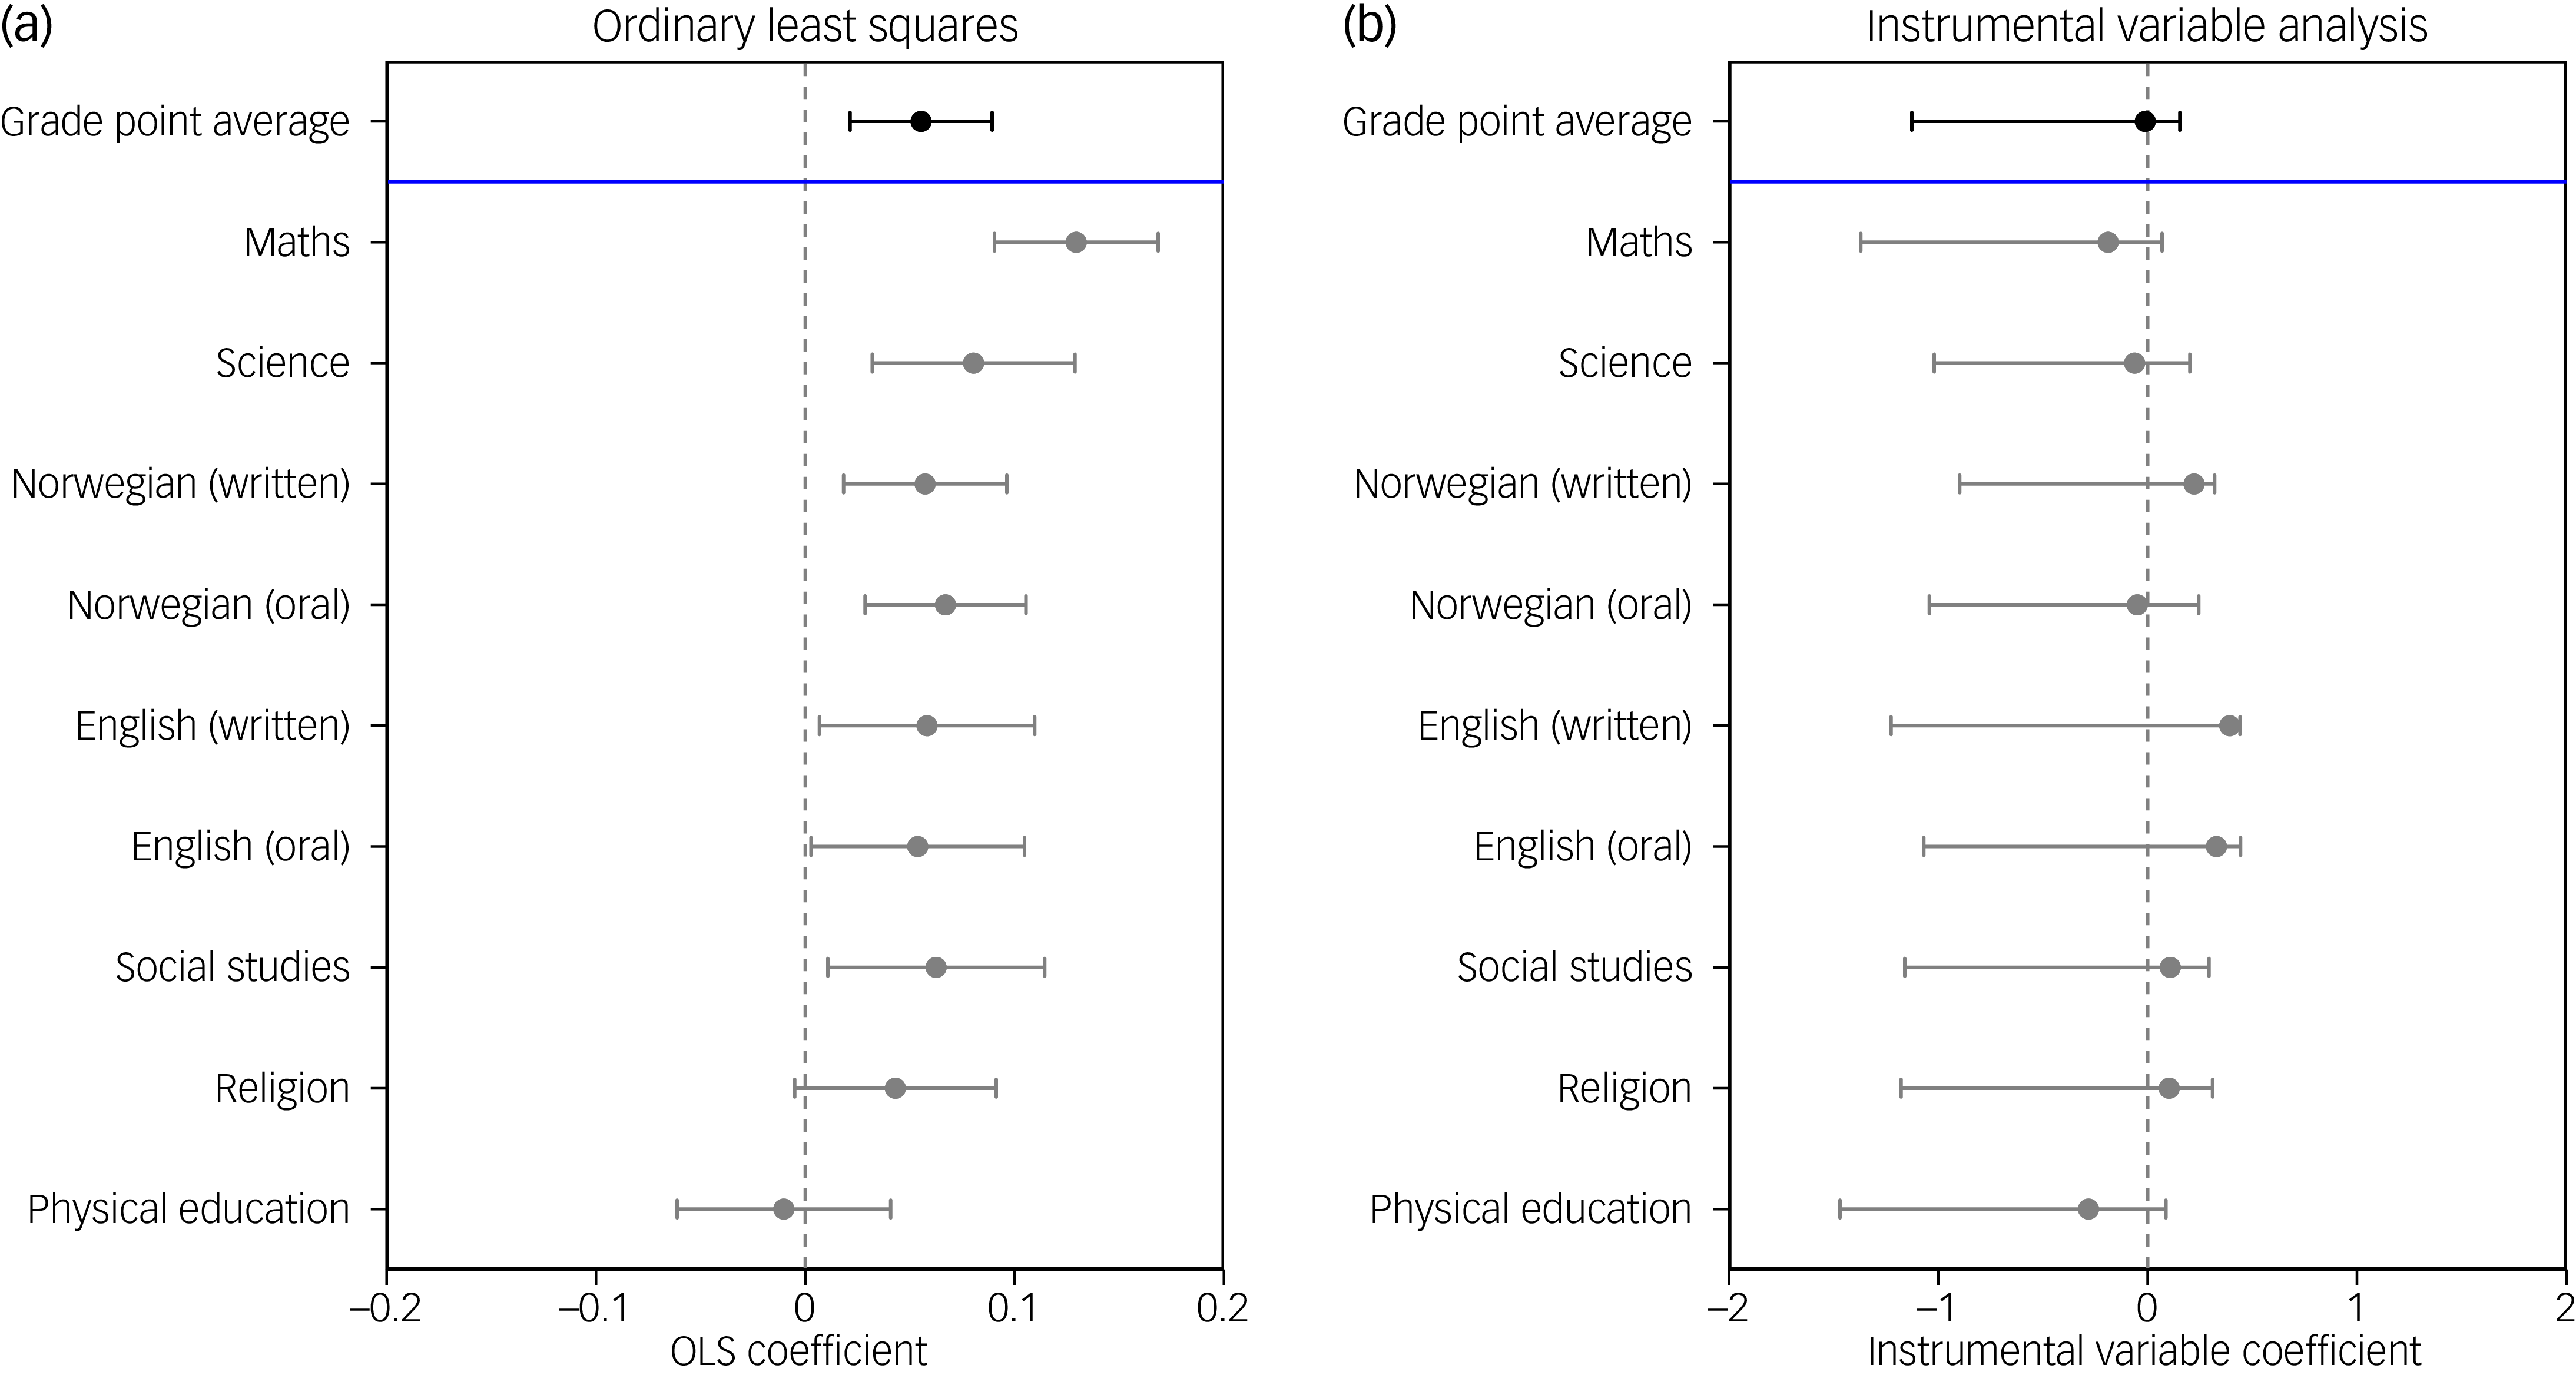
In the overall ADHD sample, conventional regression analysis indicated that pharmacological treatment was positively associated with final grades in all school subjects except religion and physical education (Fig. 2(a)). Net of observed covariates, pharmacological treatment was associated with a 0.05-higher grade point average (95% CI 0.02–0.09; s.d. 0.94). This corresponds to about 5% of the standard deviation, which indicates a weak effect. The strongest relation was found for maths, with a coefficient of 0.13 (95% CI 0.09–0.17; s.d. 1.07; OLS results for all individual school subjects in Supplementary Table 1). Exemption and NBA were not associated with pharmacological treatment of ADHD (exemption: 0.01, 95% CI −0.01 to 0.03; NBA: −0.01, 95% CI −0.02 to 0.00). In gender-stratified analyses, associations were at least as strong for females as for males, but confidence intervals for female coefficients were very wide.
Patients diagnosed with attention-deficit hyperactivity disorder (ADHD) at age 5–15 years in Norway 2009–2011. Coefficient plots with 95% confidence intervals, controlled for baseline covariates and clustered by clinic. (a) Associations between pharmacological treatment for ADHD and tenth grade final grades; ordinary least squares (OLS) estimates. (b) Effects of pharmacological treatment on tenth grade final grades; instrumental variable analysis, two-stage least squares estimates with Anderson–Rubin confidence intervals.

Instrumental variable analysis showed no statistically significant support for a causal effect of pharmacological treatment on individual school subject grades (Fig. 2(b)), grade point average (−0.01, Anderson–Rubin 95% CI −1.13 to 0.15) or non-assessment (exemption: 0.07, Anderson–Rubin 95% CI −0.17 to 0.31; NBA: 0.01, Anderson–Rubin 95% CI −0.04 to 0.14) among patients on the margin of treatment. Further, there was no clear trend in estimated treatment effects across different subjects, with some negative and some positive estimates. We note, however, that instrumental variable estimates were imprecise, with wide confidence intervals. The estimated first-stage F-statistic for females was 5.7, which does not support the relevance assumption and indicates that the instrumental variable model was not valid for females alone.
For context, the instrumental variable grade point average estimate of −0.01 corresponds to about 0.01 s.d. (grade point average s.d. 0.94). The instrumental variable risk differences for exemption (0.07) and NBA (0.01) translate to a number needed to treat (NNT) of approximately 14 and 100; consistent with our previous papers we report these descriptively. Reference Widding-Havneraas, Zachrisson, Markussen, Elwert, Lyhmann and Chaulagain13,Reference Widding-Havneraas, Elwert, Markussen, Zachrisson, Lyhmann and Chaulagain14,Reference Chaulagain, Widding-Havneraas, Elwert, Markussen, Lyhmann and Halmøy16 Both instrumental variable estimates are non-significant (Anderson–Rubin intervals span zero), so NNT bounds are infinite and these values describe point-estimate magnitudes only.
Regression analyses stratified by age at diagnosis showed that the positive association between pharmacological treatment and academic performance was driven by patients diagnosed at an older age. Among patients diagnosed below age 11 years, the association was not statistically significant for grade point average or any school subject, whereas the association was positive and statistically significant among patients diagnosed from age 11 years for grade point average and all school subjects except physical education (Supplementary Figs 4 and 5). Supplementary exploratory analyses that stratified by both age at diagnosis and the timing of pharmacological treatment further suggested that the positive association between pharmacological treatment and academic outcomes was driven by patients who were diagnosed at an older age and received pharmacological treatment in years closer to the outcome measurement (Supplementary Table 2).
These associational results, however, may be biased by unobserved confounding and hence lack a causal interpretation. The F-statistics on the first stage in the age-stratified instrumental variable models were too small (F = 31 below age 11 years; F = 38 from age 11 years) for valid statistical inference with t-ratio or Anderson–Rubin tests, Reference Keane and Neal28 precluding the interpretation of the corresponding age-stratified instrumental variable models.
Discussion
By providing quasi-experimental causal estimates using a population sample with functional outcome measures and up to 10 years of follow-up, this study addresses a knowledge gap in the literature on long-term effects of pharmacological treatment of ADHD on academic outcomes. Descriptive analysis confirmed that children and adolescents with ADHD had lower grade point averages and were at considerably higher risk of being exempted or assigned NBA than controls from the general population who were not in contact with the mental health services. Conventional regression analyses indicated that initiation of pharmacological treatment was positively, but negligibly associated with grades; and the probability of exemption and NBA were not associated with pharmacological treatment net of observed controls. Our causal inference rests on the instrumental variable analysis, which exploits exogenous variation in clinic-level prescribing preferences (restrictive to liberal Reference Mykletun, Widding-Havneraas, Chaulagain, Lyhmann, Bjelland and Halmøy12 ).
However, despite controlling for a wide range of relevant covariates, the OLS results are likely biased by residual confounding. Important confounders such as symptom severity are not administratively registered. Further, sustained pharmacological treatment depends on parental capacity to renew prescriptions, attend follow-up and manage side-effects; these behaviours correlate with broader parental educational investment, which is more consistent in higher-socioeconomic households. The OLS estimate therefore likely reflects a composite of any pharmacological effect, parental investment and selection on academic prospects. Thus, we next implemented a quasi-experimental instrumental variable approach to investigate the potential causal effect of pharmacological treatment in the group of ADHD patients on the margin of treatment. Instrumental variable analysis showed no statistically significant evidence of causal effects on single school subjects or grade point average for this patient group. Moreover, there was no support for causal effects of pharmacological treatment on exemption or NBA. The contrast between the positive OLS estimate and the near-null instrumental variable estimate is consistent with this selection mechanism.
Previous observational registry studies with 2- to 3-year treatment periods have reported positive Reference Jangmo, Stålhandske, Chang, Chen, Almqvist and Feldman3,Reference Zoëga, Rothman, Huybrechts, Ólafsson, Baldursson and Almarsdóttir29 or clinically insignificant Reference Varnet Pérez, Øvergaard, Frigessi and Biele30 results. Our OLS analyses stratified by age at diagnosis showed that the observed positive associations in these analyses were driven by the patients diagnosed close to the outcome measurement and diminished with increasing length of follow-up. The significance of temporal proximity between treatment initiation and outcome measurement may stem from various factors, including decreases over time following diagnosis in treatment adherence, Reference Langberg and Becker10,Reference Brikell, Yao, Li, Astrup, Gao and Gillies31 medication effectiveness and/or the overall quantity and quality of healthcare services received. Qualitative dissimilarities between patient groups depending on diagnostic age is also plausible (e.g. diagnosis early in life may be associated with higher symptom load, Reference Zoëga, Rothman, Huybrechts, Ólafsson, Baldursson and Almarsdóttir29 more hyperactivity Reference Keilow, Holm and Fallesen32 or distinctive familial characteristics Reference Zoëga, Rothman, Huybrechts, Ólafsson, Baldursson and Almarsdóttir29 ). Our supplemental exploratory analysis indicated that both age at diagnosis and timing of medication use relative to outcome measurement were related to the strength of the associations between pharmacological treatment and grades. The change in curricular demands between primary and lower secondary school may also contribute.
When applying the instrumental variable model, we found no evidence of causal effects of pharmacological treatment. Our findings sit within a growing quasi-experimental literature on ADHD medication. Dalsgaard et al Reference Dalsgaard, Nielsen and Simonsen33 used a Danish provider-preference instrumental variable for childhood outcomes, and Chorniy and Kitashima Reference Chorniy and Kitashima34 a similar approach for risky behaviours; within our project, the same instrumental variable has been applied to criminality, Reference Widding-Havneraas, Zachrisson, Markussen, Elwert, Lyhmann and Chaulagain13 injuries, Reference Widding-Havneraas, Elwert, Markussen, Zachrisson, Lyhmann and Chaulagain14 comorbidity Reference Lyhmann, Widding-Havneraas, Bjelland, Markussen, Elwert and Chaulagain15 and child welfare contacts. Reference Chaulagain, Widding-Havneraas, Elwert, Markussen, Lyhmann and Halmøy16 For academic outcomes specifically, quasi-experimental findings are mixed. Reference Molina, Hinshaw, Swanson, Arnold, Vitiello and Jensen35 Keilow et al Reference Keilow, Holm and Fallesen32 used Danish registry data in a natural experiment and found positive effects of pharmacological treatment on grade point average, although with shorter follow-up. Currie et al Reference Currie, Stabile and Jones11 found that an insurance reform that expanded medication use in Quebec was followed by increased probability of grade repetition and lower mathematics scores. A Norwegian target trial emulation found no clinically relevant long-term effect on national test scores Reference Varnet Pérez, Øvergaard, Frigessi and Biele30 and the Multimodal Treatment Study of Children with ADHD reported no significant academic differences between originally randomised groups at 8 years, Reference Molina, Hinshaw, Swanson, Arnold, Vitiello and Jensen35 both consistent with our findings. A recent Swedish target trial emulation reported protective effects on several non-academic outcomes, but did not examine academic performance. Reference Zhang, Zhu, Sjölander, Nourredine, Li and Garcia-Argibay36 The discrepancy between instrumental variable and OLS analyses suggests that conventional regressions are biased by unobserved confounding and should not be interpreted causally. The instrumental variable model identifies effects only for marginal patients, so samples are not directly comparable; reduced instrumental variable power could mask effects, yet the instrumental variable did not show any clear pattern across subjects or non-assessment outcomes.
Several other factors may contribute to the imprecision of the instrumental variable analysis results. Because we include many years follow-up, the strength of the instrumental variable decreases over time. Reference Widding-Havneraas, Zachrisson, Markussen, Elwert, Lyhmann and Chaulagain13 Our treatment measure averages over time and may obscure effects that depend on timing or continuity. Adherence and monitoring in this naturalistic setting cannot match a controlled study, and most individuals with ADHD are non-continuous medication users. Reference Brikell, Yao, Li, Astrup, Gao and Gillies31 Community-setting dosage is not as well-titrated as when under close specialist follow-up, and may even be titrated to the ‘wrong’ outcome, since the ideal dosage for cognitive performance differs from that for behaviour improvement. Reference Langberg and Becker10 The latter will arguably in many cases be the main motive for children to be prescribed pharmacological treatment, even within the school setting. Our instrumental variable estimates therefore reflect treatment as delivered in routine care, the effect size most relevant for clinical and policy decisions.
Confounding may also arise at an institutional level. A recent Norwegian study showed that there are differences between schools in the extent to which risk for ADHD is associated with educational achievement, suggesting that the learning environment may potentially mitigate this risk. Reference Cheesman, Eilertsen, Ayorech, Borgen, Andreassen and Larsson37 This may influence both the need for and effect of medication. Non-pharmacological interventions (behavioural therapy, parent training, school adaptations) are not consistently recorded in registries and could not be included as exposures or controls; they may vary across clinics and schools and contribute to residual heterogeneity. CAMHS clinics may also differ in their psychosocial interventions, which are not registered and could potentially influence both provider preference and outcome.
The large increase in prevalence of ADHD diagnoses in recent years Reference Kazda, Bell, Thomas, McGeechan, Sims and Barratt19,Reference Hartz, Madsstuen, Andersen, Handal and Odsbu38 may comprise a larger proportion of patients on the margin of treatment, i.e. patients being more prone to variation in clinical assessment and treatment decision. These likely overlap substantially with the patients that the overdiagnosis literature Reference Kazda, Bell, Thomas, McGeechan, Sims and Barratt19 argues have been added to the treated population through diagnostic expansion. Our null instrumental variable is consistent with narrowing average benefit as expansion proceeds. Studies applying instrumental variable analyses on more recent cohorts may thus yield more informative results on how pharmacological treatment may or may not impact academic performance in this rising group of patients. Earlier research has suggested that expanding the group of children being treated yields diminishing returns, Reference Currie, Stabile and Jones11,Reference Dalsgaard, Nielsen and Simonsen33 and in a recent Swedish registry study, Li et al Reference Li, Coghill, Sjölander, Yao, Zhang and Kuja-Halkola20 found that the observed risk reductions associated with ADHD medication for several functional outcomes attenuated as prescription rates rose.
The instrumental variable estimate is statistically indistinguishable from zero and substantively very small (about 0.01 s.d.), below effect sizes generally considered clinically meaningful. Reference Wasserstein, Schirm and Lazar39,Reference Matthay, Hagan, Gottlieb, Tan, Vlahov and Adler40 The combination of non-significance and a near zero point-estimate makes the null finding informative.
In summary, this study aimed to contribute to the literature by providing estimates of long-term, causal effects of pharmacological ADHD treatment on functional academic outcomes. We found a weak, clinically insignificant association between pharmacological treatment and school results, but no evidence of a causal relationship, at least for patients on the margin of treatment. Methodological limitations must however be taken into consideration, and as always, generalisation to populations in other countries or at different points in time must be made with caution. Although our results do not provide evidence of any positive causal effects of pharmacological treatment on academic outcomes, neither do they suggest negative effects. Nonetheless, the potential improvement of grades is not the only reason to consider pharmacological treatment for ADHD. In a clinical setting, the effect of pharmacological treatment will vary between individuals, and will be the main guide for further decision-making in the follow-up of each patient.
Supplementary material
The supplementary material is available online at https://doi.org/10.1192/bjp.2026.10754
Data availability
Access to registry data requires approval from authorised data owners and thus cannot be shared by the authors.
Author contributions
I.L., T.W.-H., S.M., H.D.Z., A.H. and A.M. were responsible for study conceptualisation. I.L., T.W.-H., S.M., H.D.Z., F.E. and A.M. were responsible for the study methodology. I.L., T.W.-H. and S.M. conducted the analysis. I.L. wrote the original draft of the manuscript. I.L., T.W.-H., F.E., A.H., A.C., S.M., I.B. and A.M. reviewed and edited the manuscript. A.H., I.B., A.M., H.D.Z. and S.M. conducted study supervision. A.M. was the Principal Investigator.
Funding
The contributions of all authors are funded by the Research Council of Norway (grant number 288585/IAR). T.W.-H was also funded by the Western Norway Regional Health Authority (grant number 912197). The research group is additionally supported by Centre for Research and Education in Forensic Psychiatry, Haukeland University Hospital, Bergen, Norway.
Declaration of interest
None.



 Open access


eLetters
No eLetters have been published for this article.