Learning to read and write has been shown to affect the way individuals process spoken words. Using lexical decision, Ziegler and Ferrand (Reference Ziegler and Ferrand1998) reported one of the most convincing and robust orthographic effects: words that end with a consistent rime (i.e., a phonological rime that can be spelled in only one way) led to faster decision times and lower error rates than those ending with an inconsistent rime (i.e., a phonological rime that can be spelled in several ways). This orthographic consistency effect has been explained in terms of the bimodal interactive activation model proposed by Grainger and colleagues (e.g., Grainger, Diependaele, Spinelli, Ferrand, & Farioli, Reference Grainger, Diependaele, Spinelli, Ferrand and Farioli2003; Grainger & Ferrand, Reference Grainger and Ferrand1994; Ziegler & Ferrand, Reference Ziegler and Ferrand1998; Ziegler, Ferrand, & Montant, Reference Ziegler, Ferrand and Montant2004; Ziegler, Muneaux, & Grainger, Reference Ziegler, Muneaux and Grainger2003). The model assumes the existence of feedback (sound to spelling) and feedforward (spelling to sound) connections between the phonological and orthographic representations at both lexical and sublexical levels. Note, however, that Ziegler, Petrova, and Ferrand (Reference Ziegler, Petrova and Ferrand2008) found evidence for feedback connections to be restricted to the auditory modality. In auditory tasks, inconsistent words would be at a disadvantage compared to consistent words because the sublexical phonological representation activated by an inconsistent phonological rime (e.g., in French, the rime /ɔr/ of the word nord) would activate several spellings (like ort, ord, or, orc, etc.) that are not necessarily compatible with the orthographic representation of the target (ord). This lack of consistency of the phonology–orthography mapping would slow down and/or make less precise the activation of the phonological representation of inconsistent spoken words (Grainger, Muneaux, Farioli, & Ziegler, Reference Grainger, Muneaux, Farioli and Ziegler2005; Stone, Vanhoy, & Van Orden, Reference Stone, Vanhoy and Orden1997; Ziegler & Ferrand, Reference Ziegler and Ferrand1998; Ziegler, Montant, & Jacobs, Reference Ziegler, Montant and Jacobs1997).
Although the assumption of feedback and feedforward connections between phonology and orthography provides a coherent explanation for the orthographic effects reported so far, the highly interactive model reviewed above is not entirely supported by recent findings. In Portuguese and French speakers, orthographic inconsistency did not affect shadowing ability (Pattamadilok, Morais, Ventura, & Kolinsky, Reference Pattamadilok, Morais, Ventura and Kolinsky2007; Ventura, Morais, Pattamadilok, & Kolinsky, Reference Ventura, Morais, Pattamadilok and Kolinsky2004). Shadowing is a task that can be performed at a prelexical processing level, that is, before lexical activation or, at least, lexical selection. Based on these results, the authors opted for a more conservative theoretical position: the partially autonomous and partially interactive account (Kolinsky, Reference Kolinsky1998; Morais & Kolinsky, Reference Morais and Kolinsky1994; Morais, Kolinsky, & Nakamura, Reference Morais, Kolinsky, Nakamura, Otake and Cutler1996; Morais, Kolinsky, Ventura, & Cluytens, Reference Morais, Kolinsky, Ventura and Cluytens1997) according to which only the phonological representations activated at the lexical and/or postlexical processing levels are sensitive to orthographic knowledge, whereas those activated earlier in the speech processing route (in occurrence, the ones involved in shadowing) are influenced only by early linguistic experience.
Accounts of the orthographic consistency effect described above rely exclusively on findings obtained in skilled readers. Yet learning to read and write is a long and laborious process that requires years of training. To reach skilled readers' proficiency, children go through different stages. The first step involves learning the mapping between sublexical phonological and orthographic units, more particularly at the phoneme–grapheme level. This allows the beginning reader to translate a printed letter string into its spoken format. The acquisition of this phonological decoding ability enables the child to use it as a self-teaching mechanism to progressively develop word-specific orthographic representations (Share, Reference Share1995, Reference Share2004). This shift toward the establishment of lexical orthographic representations is necessary for fast and automatic written word recognition.
The way in which orthographic knowledge becomes increasingly connected to the existing phonological system in the course of literacy acquisition may also result in a change in the pattern of orthographic influence on the processing of spoken words. Ventura, Morais, and Kolinsky (Reference Ventura, Morais and Kolinsky2007) investigated this issue. Testing second- to fourth-grade Portuguese children, the authors observed a widespread consistency effect, both for words and pseudowords, in both auditory lexical decision and shadowing. In addition, the size of the effect was stable throughout Grades 2 to 4. This pattern of results contrasts with those obtained with skilled adult readers, who exhibited an orthographic consistency effect restricted to words in lexical decision, but showed no effect on shadowing, as was found in previous studies (Ventura et al., Reference Ventura, Morais, Pattamadilok and Kolinsky2004; Ziegler & Ferrand, Reference Ziegler and Ferrand1998). According to Ventura et al. (Reference Ventura, Morais and Kolinsky2007), this disparity stems from the different characteristics of early and skilled literacy processes. As mentioned above, in the early years of literacy acquisition, phonological decoding is the main mechanism used by children to decipher words. Because it requires focused attention on the sublexical phonological and orthographic mapping, the intensive use of this mechanism would create strong connections, favoring the flow of activation between the sublexical orthographic representations and their already existing phonological counterparts. With reading experience, this sublexical phoneme–grapheme transcoding mechanism is progressively replaced by direct access to the lexical orthographic representations. Such a change would make the connections between phonology and orthography at the lexical level increasingly active, and at the same time, decrease the flow of activation between phonology and orthography at the sublexical level. Under this view, although the orthographic consistency effect observed in skilled readers could be assumed to result mainly from the mapping between phonology and orthography at the lexical level (Pattamadilok et al., Reference Pattamadilok, Morais, Ventura and Kolinsky2007; Ventura et al., Reference Ventura, Morais, Pattamadilok and Kolinsky2004), the more general effect observed in young children would take place at the sublexical level. In other words, the connections between the phonological and orthographic units at different structural levels appear to be modulated by the cognitive processes involved at specific literacy levels.
The present study had three aims. The first was to assess the generality, across different orthographic codes, of the shift from a sublexical to a lexical locus of the orthographic consistency effect as individuals learn to read and write. As the previous study with Portuguese-speaking children showed a general orthographic consistency effect in both lexical decision and shadowing, we examined whether French-speaking children display the same initial general effect in contrast to the more restricted effect found in skilled adult readers (Pattamadilok et al., Reference Pattamadilok, Morais, Ventura and Kolinsky2007; Ziegler & Ferrand, Reference Ziegler and Ferrand1998).
The second aim was to investigate whether children learning to read and spell French exhibit an earlier shift from orthographic sublexical to lexical activation in spoken word recognition than Portuguese children do. French orthography presents a much larger number of inconsistencies than are seen in Portuguese. In French, the average number of possible spellings for inconsistent rimes is 3.7, with the number of possible rime spellings varying from 2 to 13,Footnote 1 whereas in Portuguese, inconsistent rimes have only two possible spellings. Recently, Pattamadilok et al. (Reference Pattamadilok, Morais, Ventura and Kolinsky2007) found that the extent to which the adults' performance in lexical decision was affected by orthographic inconsistency depended on the overall consistency of the language's orthographic code. The size of the consistency effect observed in French speakers was stronger than the one observed in Portuguese speakers, even when the consistency ratio of the stimuliFootnote 2 presented during the task was controlled across languages. Overcoming the difficulties caused by strong inconsistency at the sublexical level may push the child to develop lexical orthographic representations as early as possible. This would provide the basis for an early shift in the orthographic consistency effect. A more precocious activation of lexical orthographic representations in the recognition of spoken words would be in line with data showing that children who learn to read in highly inconsistent orthographic codes, such as the English one, seem to rely less on grapheme–phoneme decoding and more on larger processing units, including whole words, than those who learn to read in less inconsistent codes (e.g., Frith, Wimmer, & Landerl, Reference Frith, Wimmer and Landerl1998; Goswami, Gombert, & De Barrera, Reference Goswami, Gombert and de Barrera1998; Goswami, Porpodas, & Wheelwright, Reference Goswami, Porpodas and Wheelwright1997; Goswami, Ziegler, Dalton, & Schneider, Reference Goswami, Ziegler, Dalton and Schneider2001; Landerl, Wimmer, & Frith, Reference Landerl, Wimmer and Frith1997; Wimmer & Goswami, Reference Wimmer and Goswami1994).
The third aim of the present study was to obtain more evidence on the behavior of French-speaking adults in lexical decision. Results obtained on shadowing tasks have been consistent across different studies, with no consistency effects being observed either on words or on pseudowords (Pattamadilok et al., Reference Pattamadilok, Morais, Ventura and Kolinsky2007; Ventura et al., Reference Ventura, Morais, Pattamadilok and Kolinsky2004, Reference Ventura, Morais and Kolinsky2007). However, results obtained on lexical decision tasks with native French speakers are more contradictory. A significant and reliable orthographic consistency effect was observed on pseudowords by Pattamadilok et al. (Reference Pattamadilok, Morais, Ventura and Kolinsky2007), but not by Ziegler and Ferrand (Reference Ziegler and Ferrand1998) or by Ventura and collaborators (Reference Ventura, Morais, Pattamadilok and Kolinsky2004, Reference Ventura, Morais and Kolinsky2007). As argued in Pattamadilok et al., the presence of this effect on pseudowords in lexical decision is not necessarily at odds with a lexical account. Although pseudowords are often assumed to be processed at the prelexical level because of the absence of corresponding lexical representations in memory, it has already been demonstrated that, under certain circumstances, they can also be lexically processed, for example, when they are presented in a lexical context as in the lexical decision task (Vitevitch & Luce, Reference Vitevitch and Luce1998, Reference Vitevitch and Luce1999). In addition, such lexical processing is more likely when pseudowords are close to real words (Connine, Titone, Deelman, & Blasko, Reference Connine, Titone, Deelman and Blasko1997), as was the case in Pattamadilok et al. In an attempt to understand the origin of the orthographic consistency effect on pseudowords, the density of their lexical neighborhood (i.e., the number of words that can be obtained from them by changing one phoneme) was calculated. If an effect still occurred in pseudoword decisions after accounting for lexical neighborhood density, then this might suggest that there is a stronger impact of orthographic lexical activation in French than in Portuguese.
To summarize, we investigated the pattern of the orthographic consistency effect obtained in French-speaking adults and second- to fourth-grade beginning readers. Both auditory lexical decision and shadowing tasks were used, as well as word and pseudoword stimuli, to examine the orthographic influence at the lexical and sublexical levels.
METHOD
Participants
A total of 133 children participated in the experiment. Of these, 66 completed the lexical decision task: 22 second graders (mean age = 7 years, 8 months [7;8]), 24 third graders (mean age = 8;7), and 20 fourth graders (mean age = 9;7). The other 67 children completed the shadowing task: 20 second graders (mean age = 7;8), 22 third graders (mean age = 8;8), and 25 fourth graders (mean age = 9;8). All were native French speakers and came from three public schools in Brussels. All were free from language and auditory impairment. We also ascertained that all of them had a normal reading level: their reading scores in the Outil de Depistage des Dyslexies (ODEDYS) Test (Jacquier-Roux, Valdois, & Zorman, Reference Jacquier-Roux, Valdois and Zorman2002; Jacquier-Roux, Valdois, Zorman, Lequette, & Pouget, Reference Jacquier-Roux, Valdois, Zorman, Lequette and Pouget2005) were above the standard score of their education level minus 2.5 SD. All were tested in February and March (academic year begins in the beginning of September and ends at the end of June). Because none of them had ever repeated a class, participants who were in the same grade always had the same number of months of reading acquisition.
Forty-eight undergraduate students from the Université Libre de Bruxelles constituted the adult control group (10 men, 38 women, aged 18–36 years, average = 21;6). Half of them participated in lexical decision and the rest in shadowing. All were native French speakers and were paid for their participation. None reported any problems with language or audition.
Materials
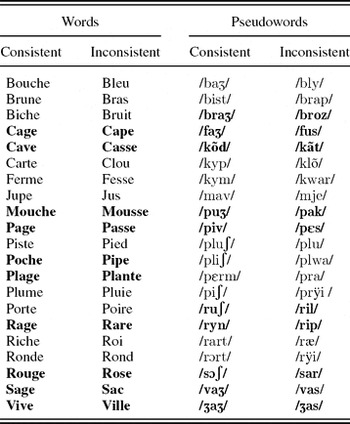
To use stimuli adapted to the young children's reading ability, we first constructed a list of 45 pairs of monosyllabic words selected on the basis of a statistical analysis of bidirectional consistency of spelling and sound in French (Ziegler, Jacobs, & Stone, Reference Ziegler, Jacobs and Stone1996). Each pair contained one consistent and one inconsistent word that shared at least their first phoneme.
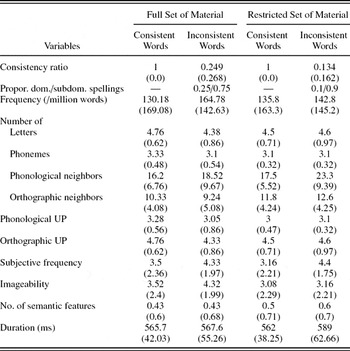
These 45 pairs of words were presented in a spelling task to an independent group of 30 second graders coming from two public schools in Brussels. All of them were at the 16th month of reading acquisition when the spelling task was administered (end of January). On the basis of their spelling results, 26 pairs of words that were correctly spelled by at least 80% of the children were kept. This new list of stimuli was further reduced to 21 pairs of critical words (see Table A.1 in Appendix A) to keep the consistent and the inconsistent words matched for the following variables (ps > .05, see Table A.2 in Appendix A): number of phonemes, number of letters, number of phonological and orthographic neighbors (i.e., words that can be obtained by changing one phoneme or one letter, respectively), phonological and orthographic uniqueness point (Lexique database; New, Pallier, Ferrand, & Matos, Reference New, Pallier, Ferrand and Matos2001), word frequency (MANULEX database; Lété, Sprenger-Charolles, & Colé, Reference Lété, Sprenger-Charolles and Colé2004), subjective frequency and imageability (OMNILEX database; Desrochers & Bergeron, Reference Desrochers and Bergeron2000), number of semantic features (Brulex database; Content, Mousty & Radeau, Reference Content, Mousty and Radeau1990), and mean duration.
Twenty-one pairs of pseudowords were constructed by recombining the onsets and the rimes of different critical words (e.g., the onset of the word “carte” combined with the rime of the word “ronde” led to the pseudoword “conde”). This way, they included the critical words' rimes and initial phonemes. As shown in Table A.1, within a pair, these consistent and inconsistent critical pseudowords always shared at least their initial phoneme(s). Consistent and inconsistent pseudowords had the same mean duration (545 and 546 ms on average, respectively) and number of phonemes (in both cases, 3.2 on average).
Because the critical stimuli contained several rime repetitions, 84 fillers (not controlled for the different variables mentioned) were added. They included 21 consistent words, 21 inconsistent words, 21 consistent pseudowords, and 21 inconsistent pseudowords, with rimes different from those used for the critical stimuli.
A native male French speaker recorded all the stimuli on a MiniDisc recorder. They were digitized at a sampling rate of 44 kHz with 16-bit analog-to-digital conversion, using Sound Tools/DigiDesign editor software on a Macintosh G3 Powerbook.
Procedure
Participants were tested individually in a quiet room. The stimuli were presented at a comfortable level through headphones. For the lexical decision task, participants were instructed to listen carefully to each stimulus and to indicate, as quickly and accurately as possible, whether the stimulus was a real French word or a pseudoword. Participants pressed the green button (on the right of the button box) if the stimulus was a word and the red button (on the left of the button box) if it was a pseudoword. Response latency was measured from the onset of the stimulus until the button-press response. The same procedure was used in shadowing except that in this task participants were asked to repeat back each stimulus as rapidly and accurately as possible. The vocal response triggered a voice key connected to a button box. Naming latencies were measured from the onset of the stimulus to the onset of the participants' vocal response. Responses were recorded on a MiniDisk recorder, which enabled identification of naming errors. In both tasks, presentation, timing, and reaction time (RT) data collection were controlled by E-prime 1.1 software (Schneider, Eschman, & Zuccolotto, Reference Schneider, Eschman and Zuccolotto2002a, Reference Schneider, Eschman and Zuccolotto2002b).
The stimuli were divided into seven blocks of 24 stimuli each. Order of stimulus presentation was pseudorandomized, with the constraints that words or pseudowords and consistent or inconsistent stimuli never occurred more than three times in a row and that the same phonological rime never occurred consecutively. Each block started with at least three fillers. There was a 2-s interval between each response and the beginning of the next trial. After each block, participants decided when they were ready to continue. The experimental session was preceded by two practice blocks of 20 trials consisting of 10 monosyllabic words and 10 monosyllabic pseudowords randomly presented. The rimes of these practice stimuli were different from those of the critical stimuli. Feedback was provided only during the practice blocks. The experiment lasted about 20 min.
A few minutes before starting the experiment described above, children were given the ODEDYS Reading Test (Jacquier-Roux et al., Reference Jacquier-Roux, Valdois and Zorman2002, Reference Jacquier-Roux, Valdois, Zorman, Lequette and Pouget2005), which lasted about 10 min.
To control for orthographic knowledge, the critical stimuli were presented through headphones once more at the end of the session, one at a time with a 4-s interval between stimuli. The adult participants were asked to write down each critical stimulus as they heard it. For the children, the spelling task was not run directly after the experimental session but given collectively to all the participants from each school at the end of March. The schoolteacher read the critical words and the children were invited to write them down.
RESULTS
A preliminary inspection of the adults' data did not reveal the expected pattern for the orthographic consistency effect: performance was modulated by orthographic consistency not only in lexical decision, but also in shadowing, for both words and pseudowords. Nevertheless, a detailed inspection of the characteristics of the stimuli suggested that, although consistent and inconsistent stimuli were matched for all of the variables presented in Table A.2, they were not matched for their syllable structure: the structure of the inconsistent stimuli was more heterogeneous and complex.Footnote 3 These differences could explain the better performance observed in the consistent relative to the inconsistent condition in shadowing. Indeed, the effect of syllabic complexity on speech production has been illustrated in both healthy participants and those with language impairments. Santiago and collaborators (Santiago, MacKay, & Palma, Reference Santiago, MacKay and Palma2002; Santiago, MacKay, Palma, & Rho, Reference Santiago, MacKay, Palma and Rho2000) showed an effect of onset complexity (and, to a lesser extent, of coda complexity) in picture naming, with longer naming latencies for words beginning with complex consonant clusters. Developmental and neuropsychological data reinforce the idea that structural complexity matters in speech production: children tend to reduce consonant clusters to a singleton when they speak (Bernhardt & Stemberger, Reference Bernhardt and Stemberger1998; Ingram, Reference Ingram1974; Spencer, Reference Spencer and Ball1988) and similar observations were reported in aphasic patients (Beland, Caplan, & Nespolous, Reference Beland, Caplan and Nespoulous1990; Mackenzie, Reference Mackenzie1982; Romani & Galluzzi, Reference Romani and Galluzzi2005).
To control for this dimension, among the critical stimuli presented in Table A.1, we chose the 10 pairs of consistent and inconsistent words and pseudowords that shared the same syllable structure (in bold in Table A.1). Note that these stimuli were still matched on all the variables presented in Table A.2 (all ps > .10); in addition, acoustic duration did not differ significantly for the word and pseudoword sets, either on average or separately for consistent and inconsistent items (all ps > .10). Only the data from this restricted set of stimuli were taken into account in the analyses presented below; the unmatched pairs were thus treated as fillers. In addition, for all analyses we confirmed that results did not change when individual performance on the spelling task was taken into account (by discarding misspelled words).
The results from the shadowing and lexical decision tasks were analyzed separately, as were RT and error rate data. Mean RTs were calculated for each stimulus type (as defined by lexicality and consistency) for each subject. Preliminary inspection of the RT data on correct trials led us to discard from further analyses RTs longer or shorter than the mean RT ± 2.5 SD for each subject and for each condition. For shadowing, 0.84% and 0.9% of the data were discarded for adults and children, respectively, whereas for lexical decision, adult and child exclusion rates were 1.9% and 2.3%, respectively.
Shadowing
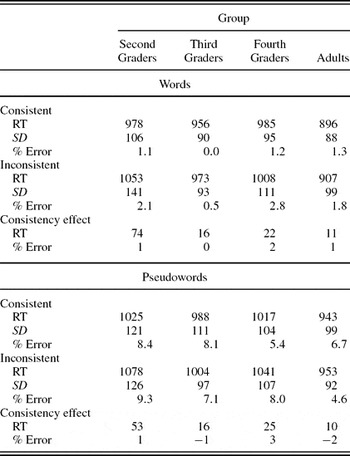
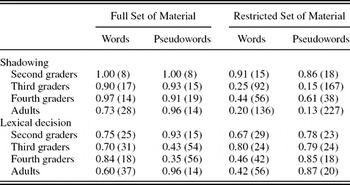
The shadowing results obtained by the different groups of participants are presented in Table 1.
Mean reaction times (ms) and standard deviations for correct responses and mean percentages of errors observed in shadowing

The analyses of variance (ANOVAs) run by subjects (F1) and by items (F2) on the RT data (see Table 1) included consistency (consistent vs. inconsistent) and lexicality (word vs. pseudowords) as within-subject and between-item factors, respectively. Group (adults and second, third, and fourth graders) was treated as a between-subject and within-item factor. The effects of lexicality, F1 (1, 87) = 67.6, p < .0001; F2 (1, 36) = 2.9, p = .096, and of consistency, F1 (1, 87) = 27.8, p < .0001; F2 (1, 36) = 3.1, p = .089, were significant in the subject analysis but not in the item analysis. The group effect was significant in both analyses, F1 (3, 87) = 5.4, p < .005; F2 (3, 108) = 72.8, p < .0001. It was important that we also found a significant Group × Consistency interaction, F1 (3, 87) = 4.5, p = .005; F2 (3, 108) = 3.8, p = .01.Footnote 4 No other interactions were significant (Fs < 1).
Using the Bonferroni adjustment (the adjusted significance threshold was p < .0125), a post hoc test performed on each group of participants revealed a significant consistency effect only in second graders, F1 (1, 19) = 17.6, p < .0001; F2 (1, 36) = 8.3, p < .01, with consistent stimuli (words and pseudowords) being repeated faster than inconsistent stimuli. This effect was totally absent in adults, F1 (1, 23) = 1.5, p > .10; F2 (1, 36) = 1.1, p > .25, and third graders, F1 (1, 21) = 2.1, p > .10; F2 < 1, and was unreliable in fourth graders, F1 (1, 24) = 7.8, p = .01; F2 (1, 36) = 1.7, p > .10.Footnote 5
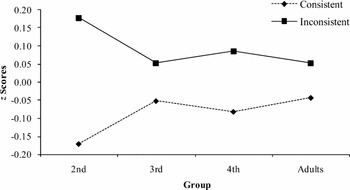
However, because the different groups of participants differed in their overall RT, z score transformation was applied to each individual's RT distribution. As illustrated in Figure 1, the ANOVA performed on the z scores showed a marginal interaction between group and consistency, F (3, 87) = 2.52, p = .06. The post hoc test using Bonferroni adjustment (the adjusted significance threshold was p < .0125) showed that the consistency effect was significant only in second graders, F (1, 87) = 21.31, p < .00005; F (1, 87) = 2.11, p > .10 for third graders, = 6.12, p > .015 for fourth graders, and = 1.95, p > .10 for adults.
Cross-group comparisons of the consistency effect obtained in shadowing. The reaction times are expressed in average z scores.

The same analyses performed on the error rates only showed a significant effect of lexicality, F1 (1, 87) = 84.1, p < .0001; F2 (1, 36) = 6.5, p < .025. No other main factor or interaction reached significance (Fs ≤ 1).
In sum, the most interesting result obtained in shadowing was the fact that only second graders, that is, those who had the least experience in reading and writing, showed an orthographic consistency effect. The performance of third and fourth graders resembled the one of the adults. This early disappearance of the orthographic consistency effect in the shadowing task contrasts with the observations made by Ventura et al. (Reference Ventura, Morais and Kolinsky2007) on Portuguese children. Indeed, the Portuguese children's shadowing performance was still affected by orthographic consistency at Grade 4 and no developmental trend was found between the second and fourth grades.
Lexical decision
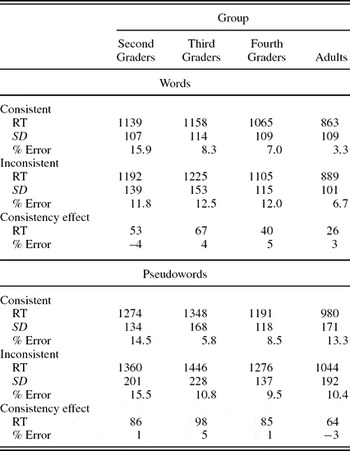
The results obtained in the different groups of participants in the lexical decision task are provided in Table 2.
Mean reaction times (ms) and standard deviations for correct responses and percentages of errors observed in lexical decision

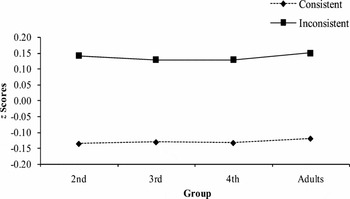
The analyses performed on the RT data showed significant effects of lexicality, F1 (1, 86) = 205; F2 (1, 36) = 33.9, both p < .0001, and group, F1 (3, 86) = 34.9; F2 (3, 108) = 247.7, both p < .0001. Of importance, the effect of consistency was also significant, F1 (1, 86) = 47.9, p < .0001; F2 (1, 36) = 5.7, p < .025, and, contrary to what was observed in shadowing, did not interact with group (F1 and F2 < 1). The stability of the consistency effect across groups is illustrated in Figure 2 and was confirmed in the analysis performed on subjects' z scores, showing a significant consistency effect, F (1, 86) = 57, p < .0001, with no interaction with group (F < 1).
Cross-group comparisons of the consistency effect obtained in lexical decision. The reaction times are expressed in average z scores.

Consistency interacted with lexicality only unreliably, F1 (1, 86) = 5.4, p < .025; F2 < 1: although the effect seems somewhat stronger for pseudowords, the subject analysis showed that it was significant for both words, F1 (1, 86) = 22.2, p < .0001, and pseudowords, F1 (1, 86) = 34.5, p < .0001. No other interaction was significant (Fs < 1), except Lexicality × Group, where F1 (3, 86) = 2; F2 (3, 108) = 2.1, both p > .10.
The ANOVA performed on the error rates showed only a significant effect of group, F1 (3, 86) = 6.1, p = .001; F2 (3, 108) = 3.9, p = .01. There was a marginal main effect of consistency in the subject analysis, F1 (1, 86) = 3.7, p = .059; F2 < 1. The interactions between consistency and group, F1 (3, 86) = 3, p < .05; F2 < 1, and between lexicality and group, F1 (3, 86) = 3.8, p < .025; F2 (3, 108) = 2, p > .10, were significant only in the subject analysis. No other main effect or interaction was significant (Fs ≤ 1). Using the Bonferroni adjustment (the adjusted significance threshold was p < .0125), a post hoc test performed on each group of participants revealed that the lexicality effect was significant only for adults, F1 (1, 23) = 15.4, p = .001; for the other groups, F1 ≤ 1, and that the consistency effect was significant only for third graders, F1 (1, 23) = 8, p < .01; F1 < 1 for both adults and second graders; F1 (1, 19) = 5.1, p > .025 for fourth graders.
The main finding obtained in lexical decision was the occurrence in the RT data of the orthographic consistency effect in all groups of participants for both words and pseudowords. Contrary to the results observed in shadowing, the size of the effect did not vary significantly with reading experience. The accuracy data showed only an unreliable consistency effect in the third graders.
The adult RT data were also analyzed separately to compare them with the findings reported by Pattamadilok et al. (Reference Pattamadilok, Morais, Ventura and Kolinsky2007). An ANOVA was conducted with consistency and lexicality as within-subject and between-item factors, respectively, and study (present study vs. Pattamadilok et al., Reference Pattamadilok, Morais, Ventura and Kolinsky2007) as a between-subject and between-item factor. This showed a significant consistency effect, F1 (1, 48) = 37.02, p < .0001; F2 (1, 192) = 9.17, p < .005, that did not interact significantly with lexicality (Fs < 1) nor with study (Fs < 1). The three-way interaction was unreliable, F1 (1, 48) = 7.73, p < .01; F2 (1, 192) = 1.42, p > .10.
Thus, with lexical decision, we replicated our earlier finding (Pattamadilok et al., Reference Pattamadilok, Morais, Ventura and Kolinsky2007) of a consistency effect for both words and pseudowords. Similar analyses performed on error rates did not reveal a significant consistency effect (Fs < 1). The interactions between consistency and the other factors were either unreliable or nonsignificant; Consistency × Lexicality: F1 (1, 48) = 3.8, p = .06; F2 (1, 192) = 1.74, p > .10; Consistency × Study, Fs < 1; Consistency × Study × Lexicality: F1 (1, 48) = 1.99, p = .164; F2 < 1.
In an attempt to understand the origin of the orthographic consistency effect on pseudowords, we estimated the density of their lexical neighborhood for the material used here. Inconsistent pseudowords had more lexical neighbors (21.9 on average, SD = 6.8) than consistent ones (15.7 on average, SD = 4.4), t (18) = −2.4, p < .05, and thus, might have been more difficult to reject. However, the analysis of covariance (ANCOVA) by item performed on the pseudowords' RT data using number of lexical neighbors as covariate still showed a significant effect of consistency on lexical decision, F2 (1, 17) = 6.4, p < .025, suggesting that the imbalance in the number of lexical neighbors by itself might not be relevant. In accordance with this result, although in the present material the number of lexical neighbors was higher for inconsistent than for consistent pseudowords by 48%, a similar imbalance (40%) also occurred in the Portuguese material of Ventura et al. (Reference Ventura, Morais, Pattamadilok and Kolinsky2004, their experiments 2–4) and Ventura et al. (Reference Ventura, Morais and Kolinsky2007), although no effect was found on pseudoword decisions in their studies. In addition, in Pattamadilok et al. (Reference Pattamadilok, Morais, Ventura and Kolinsky2007) the number of lexical neighbors was almost the same for consistent and inconsistent pseudowords (8.2 and 9.4, respectively). Nevertheless, a consistency effect was found for pseudowords in that experiment (as in the present one).
GENERAL DISCUSSION
Previous work has shown that although literate Portuguese adults display an orthographic consistency effect in spoken word recognition that is specific to word stimuli in tasks requiring lexical activation (such as lexical decision; Ventura et al., Reference Ventura, Morais, Pattamadilok and Kolinsky2004, Reference Ventura, Morais and Kolinsky2007), Portuguese beginning readers, from the second to the fourth grade, display a general and stable effect, observable on both words and pseudowords, and on both lexical and prelexical tasks such as shadowing (Ventura et al., Reference Ventura, Morais and Kolinsky2007). More recently, Ventura, Kolinsky, Pattamadilok, and Morais (Reference Ventura, Kolinsky, Pattamadilok and Morais2008) replicated this pattern of results in Portuguese fourth graders and found the adult pattern to be stable and without any qualitative modification from the sixth grade on. As argued by the authors and in the present introductory section, the generalized effect would reflect an influence of orthography on phonology at the level of sublexical connections, whereas the limited effect would reflect an influence of orthography at the level of lexical connections.
Literate French adults also exhibit an orthographic consistency effect in the lexical decision task but not in shadowing (Pattamadilok et al., Reference Pattamadilok, Morais, Ventura and Kolinsky2007; Ziegler & Ferrand, Reference Ziegler and Ferrand1998). The only difference compared to the Portuguese adults concerns pseudowords: Pattamadilok et al. observed an effect in lexical decision, although Ziegler and Ferrand did not.
The main aim of the present study was to verify the generality of the orthographic consistency effect in the French beginning readers. We also investigated the accelerating role that a larger degree of inconsistency in the language's orthographic code may play on the shift from a general (or sublexical) to a limited (lexical) impact of orthography on the speech recognition processes. This acceleration hypothesis relies on evidence that the size of the orthographic consistency effect obtained in lexical decision seems to decrease with the degree of transparency of the orthographic code: this effect was stronger in the French-speaking adults (Pattamadilok et al., Reference Pattamadilok, Morais, Ventura and Kolinsky2007) than in the Portuguese adults (Ventura et al., Reference Ventura, Morais, Pattamadilok and Kolinsky2004). We therefore hypothesized that the degree of transparency of the orthographic code might also influence the developmental pattern of the orthographic consistency effect in young children, in the sense that a less transparent code would stimulate the child to develop faster the lexical connections between orthographic and phonological representations. Finally, we also looked for more evidence in an attempt to resolve the discrepant results reported so far concerning a possible consistency effect on pseudoword decisions (Pattamadilok et al., Reference Pattamadilok, Morais, Ventura and Kolinsky2007; Ventura et al., Reference Ventura, Morais, Pattamadilok and Kolinsky2004; Ziegler & Ferrand, Reference Ziegler and Ferrand1998).
Using material in which consistent and inconsistent items were matched in terms of their syllable structure, we observed a general orthographic consistency effect in French-speaking second graders, as had previously been found in Portuguese second graders. Their performance was affected by inconsistency in both lexical decision and shadowing, and for both words and pseudowords. Thus, in both French and Portuguese beginning readers, the intensive use of sublexical units (viz., the grapheme–phoneme and phoneme–grapheme correspondences) at this stage of literacy acquisition contributes to establish a vivid flow of information between sublexical orthographic and phonological representations in the spoken word processing system. These sublexical connections cause inconsistent spellings to interfere with the recognition of spoken words at the prelexical stage, and potentially also at the subsequent lexical activation stage.
As predicted, the shift from the beginning reader to the adult's pattern of consistency effect occurred earlier in French than had been found for Portuguese. Although French-speaking second graders showed the consistency effect in both lexical decision and shadowing, third and fourth graders showed the effect only in lexical decision, as did adults. We can thus conclude from these results that the adult pattern of consistency effects in spoken word recognition is reached during the third grade in French speakers. This is much earlier than in Portuguese, where it is reached only 2 or even 3 years later. This clearly suggests that the transparency of the language's orthographic code has a strong influence on the speed at which the functional connections between orthographic and phonological representations develop, at least for the purpose of spoken word recognition.
One could argue that the second graders displayed a consistency effect in shadowing because they might have greater resort to lexical representations than the older groups in this task. However, this is counterintuitive, given what we know about the development of the orthographic lexicon in reading and writing. Moreover, it is also incompatible with the finding of a smaller consistency effect in the task that requires lexical activation (lexical decision = 53 ms) than in the task that does not necessarily require it (shadowing = 74 ms). It is therefore more likely that sublexical mapping was responsible for the general consistency effect found in second graders.
The reason why French-speaking children reached the adult pattern of the orthographic consistency effect in spoken word recognition earlier than the Portuguese children must be related to differences in the way that written language is processed. It is likely that the code constraints in learning to read and spell French requires the child to discard the sublexical decoding mechanism in favor of a lexical read-out, earlier than is the case for Portuguese. As mentioned in the introductory section, French orthography is much more inconsistent than Portuguese. Using the phoneme-to-grapheme conversion strategy to spell, for example, the word /fɔr/ (fort, meaning “strong”), children could commit several different errors such as fore, forre, ford, forc, forps, and so forth, given the high degree of inconsistency in the spelling of the rime /ɔr/ in French. Frequent confrontation with the inefficiency of this sublexical decoding strategy might induce French children to develop lexical orthographic representations of words earlier than their Portuguese peers. To our knowledge, there is no direct comparison of Portuguese and French-speaking children in terms of the characteristics of the literacy acquisition process in the age group studied here. However, evidence from a study on first graders is compatible with our hypothesis. Sprenger-Charolles, Siegel, and Bonnet (Reference Sprenger-Charolles, Siegel and Bonnet1998) found that by the end of the first grade French children displayed a clear lexicality effect in both reading and spelling; this was not yet the case in a similar study carried out on Portuguese first graders by Fernandes, Ventura, Querido, and Morais (in press).
The assumption that French-speaking children begin to build and use lexical orthographic representations relatively early is also supported by other data. In a study investigating the development of reading and spelling skills in French children, Sprenger-Charolles and Casalis (Reference Sprenger-Charolles and Casalis1995) showed that first graders' reading and spelling performance was affected not only by word regularity but also by word frequency. Based on this finding, the authors argued that during the first year of literacy acquisition, French children already rely on both the sublexical decoding mechanism (or alphabetical processing, according to the authors' terminology) and on their knowledge of the whole word orthographic representations when they read and write.
In shadowing, the error rates displayed a clearly significant effect of lexicality and RTs were also affected (although unreliably) by this factor. The presence of the lexicality effect in all groups contrasted with the absence of a consistency effect in the three oldest groups. At first sight, this could present a problem. Interpreting the presence of the consistency effect in lexical decision and the absence of the effect in shadowing in the oldest groups as reflecting a flow of information from orthographic to phonological representations only at lexical level may seem at odds with the fact that these groups displayed in shadowing a lexicality effect without consistency effect. However, there are other reasons apart from the involvement of word spelling knowledge that might lead to better processing of words than of pseudowords in the auditory modality. A lexicality effect in shadowing may result from the benefit that automatic activation of preexisting long-term memory trace for words can afford (for electrophysiological evidence of this automatic activation, see, e.g., Shtyrov & Pulvermüller, Reference Shtyrov and Pulvermuller2002). Word shadowing may also benefit from the availability of phonological output representations, whereas pseudoword shadowing requires the construction of these representations. However, this kind of lexicality effect seems rather unstable. In Pattamadilok et al. (Reference Pattamadilok, Morais, Ventura and Kolinsky2007) there was no genuine effect of lexicality in shadowing latency once the duration of the stimuli was taken into account, neither was a lexicality effect found by Ventura et al. (Reference Ventura, Morais, Pattamadilok and Kolinsky2004).
Comparing the present pattern of adult performance on words and pseudowords in the shadowing and lexical decision tasks with that of Ventura et al. (Reference Ventura, Morais, Pattamadilok and Kolinsky2004, Reference Ventura, Morais, Pattamadilok and Kolinsky2007) is particularly illuminating for the understanding of the subtle ways in which processing adapts itself to the characteristics of the material. In Ventura et al., lexicality had a clear effect on lexical decision (81 ms) but not on shadowing (10 ms) and word decisions were much slower than word repetitions (by 137 ms). In the present adult data the lexicality effect was similarly much stronger in lexical decision (136 ms) than in shadowing (46 ms). However, it was interesting that the effect of task varied with the lexicality of the stimuli,Footnote 6 with subjects repeating pseudowords faster (by 64 ms) than they were able to reject them in lexical decision, but, unusually, accepting words faster (by 25 ms) than they were able to repeat them.
This discrepancy may be related to the idea that, in phonological encoding, syllables are represented as schemas (phonological structure in terms of the sequence of consonantal or vocalic segments), not just as chunks (a sequence of phonological identities; Ferrand & Segui, Reference Ferrand and Segui1998; Rosenbaum, Weber, Hazelett, & Van Hindorff, Reference Rosenbaum, Weber, Hazelett and Van Hindorff1986; Sevald, Dell, & Cole, Reference Sevald, Dell and Cole1995). For the Portuguese studies, only items with a consonant–vowel–consonant (CVC) syllable structure were used. By having to repeat the CVC items systematically, the Portuguese subjects may have simply activated a representation of the CVC syllable structure, and filled it with the corresponding segments (or with the articulatory representations activated during the processing of the stimulus). They were thus quite fast in shadowing, regardless of the lexical status of the stimuli. This low-level processing eliminated any chance of displaying a lexicality effect in this task. The situation in the present study was different, because there were several syllable structures, although CVC was the most frequent one. The listeners were thus unable to anticipate the syllable structure of each stimulus, and had to construct an output structure on-line. This extra time allowed the occurrence of a significant lexicality effect (although smaller than the one obtained in lexical decision), and most notably, led to the finding that words could not be repeated as fast as they could be accepted as words. Investigating the role of syllable structure of the stimuli on the occurrence of both the lexicality and consistency effects will be an objective of our subsequent research.
A secondary aim of the present study was to gather more evidence on the occurrence of a consistency effect on pseudowords in the lexical decision task. As in Pattamadilok et al. (Reference Pattamadilok, Morais, Ventura and Kolinsky2007), we found this effect. The fact that it was present in all groups, that is, not only in second graders but also in third graders, fourth graders, and adults, who did not show the consistency effect in shadowing, is particularly meaningful. This did not occur in the Portuguese samples. A possible explanation of this discrepancy would be that the Portuguese pseudowords used by Ventura et al. (Reference Ventura, Morais, Pattamadilok and Kolinsky2004, Reference Ventura, Morais and Kolinsky2007, Reference Ventura, Kolinsky, Pattamadilok and Morais2008) did not activate lexical neighbors as promptly as would have been the case for the French pseudowords used here and by Pattamadilok et al. (Reference Pattamadilok, Morais, Ventura and Kolinsky2007). However, because the difference in the number of lexical neighbors calculated for the Portuguese and French pseudowords used so far by our group could not account for the discrepancy between the French and the Portuguese studies as regards the consistency effect on pseudoword decisions, it is tempting to interpret this discrepancy in the same vein as was used to account for the differences in the developmental shift from a general to a limited consistency effect. In French, the functional connectivity between orthography and phonology at the lexical level of structure for spoken word recognition purpose would not only be established earlier than in Portuguese, but would reach a stronger degree of flow of activation at the mature stage. In accordance with this view, Pattamadilok et al. (Reference Pattamadilok, Morais, Ventura and Kolinsky2007) reported that French-speaking adult listeners showed a stronger effect on word decision than the Portuguese ones (Ventura et al., Reference Ventura, Morais, Pattamadilok and Kolinsky2004).
CONCLUSION
In conclusion, together with the finding previously reported in Portuguese (Ventura et al. Reference Ventura, Morais and Kolinsky2007), we provided evidence suggesting that differences in the degree of inconsistency of orthographic codes influence the development of functional connections between the orthographic and phonological systems involved in the recognition of spoken words. Other things being equal, the more inconsistent the orthographic code, the more precocious is the shift from sublexical to lexical connectivity between orthography and phonology, and the stronger is the flow of information between these systems in speech processing by proficient readers.
APPENDIX A
Sets of words (n = 42) and pseudowords (n = 42) selected in the study

Note: The restricted set of the stimuli used in the final analyses (20 words, 20 pseudowords) is in bold.
Characteristics of the critical word stimuli (standard deviations)

Note: The number of phonological and orthographic neighbors and the phonological and orthographic uniqueness point (UP) were computed from the Lexique database (New et al., Reference New, Pallier, Ferrand and Matos2001). Frequency was computed from the Manulex database (Lété et al., Reference Lété, Sprenger-Charolles and Colé2004). Subjective frequency and imageability were computed from the Omnilex database (Desrochers & Bergeron, Reference Desrochers and Bergeron2000). The number of semantic features was computed from the Brulex database (Content et al., Reference Content, Mousty and Radeau1990).
Statistical power estimated to detect a significant difference at α = .05 and required sample size to reach a statistical power of .80 (in parentheses)

ACKNOWLEDGMENTS
Preparation of this article was supported by the Belgian French community (ARC 06/11–342); a joint grant from Fundação para a Ciência e a Tecnologia, Ministério da Ciência, Tecnologia e Ensino Superior, and European Community FEDER funding (Project POCI/PSI/56901/2004); and the Centro de Psicologia Clínica e Experimental, Desenvolvimento, Cognição e Personalidade of the Universidade de Lisboa, Portugal. We thank two anonymous reviewers for their insightful comments.