INTRODUCTION
Ecologists have discussed the non-random distribution of epiphytes among host species, and a distinction has been made between host specificity and host preference (ter Steege & Cornelissen Reference TER STEEGE and CORNELISSEN1989). Host specificity is the exclusive existence of an epiphyte species on a single host species (ter Steege & Cornelissen Reference TER STEEGE and CORNELISSEN1989, Tremblay et al. Reference TREMBLAY, ZIMMERMAN, LEBRÓN, BAYMAN, SASTRE, AXELROD and ALERS-GARCÍA1998). Host preference is usually defined as the greater abundance of an epiphyte species on a few host species (ter Steege & Cornelissen Reference TER STEEGE and CORNELISSEN1989). Host preference has been interpreted as niche partitioning by epiphytes (Benzing Reference BENZING1990, Gentry & Dodson Reference GENTRY and DODSON1987), but this interpretation is difficult to sustain in forests where epiphyte species richness is low, and many tree individuals do not support any epiphyte at all (as in some tropical dry forests), or even in epiphyte-rich forests where trees are not saturated by epiphytes (Flores-Palacios & García-Franco Reference FLORES-PALACIOS and GARCÍA-FRANCO2006) making partition of the forest unnecessary.
Although host preference has been discussed among epiphyte ecologists we consider it has not been documented correctly. A challenge for testing host preference is that host species differ in abundance. It is expected that host species of greater abundance will support more epiphyte individuals. However few authors (Bennett Reference BENNETT1987, Bernal et al. Reference BERNAL, VALVERDE and HERNÁNDEZ-ROSAS2005, Martínez-Meléndez et al. Reference MARTÍNEZ-MELÉNDEZ, PÉREZ-FARRERA and FLORES-PALACIOS2008) have incorporated abundance of host species and a measurement of abundance of epiphyte species as a response variable in their analysis of host–epiphyte association.
In addition to host specificity and preference, epiphytes could be host limited (Benavides et al. Reference BENAVIDES, DUQUE, DUIVENVOORDEN, VASCO and CALLEJAS2005, Tremblay et al. Reference TREMBLAY, ZIMMERMAN, LEBRÓN, BAYMAN, SASTRE, AXELROD and ALERS-GARCÍA1998), a less commonly adopted concept to describe host–epiphyte relationships. Host limitation is defined as the concentration of epiphytes on a few host species as a result of the scarcity of habitable hosts. As a first step host–epiphyte associations can be identified by measuring the abundance of epiphytes among host species. In a neutral host, the abundance of epiphytes must be equal to that expected by chance (proportional to host abundance). In host preference, epiphytes must be able to colonize all tree species but, for a few host species, their abundance must be greater than that expected by chance. In host specificity, an epiphyte species must occur on a single host species. Finally, in host limitation the host species limiting the epiphytes must contain fewer epiphyte individuals than expected by chance while the habitable host species must have an abundance of epiphytes as expected by chance.
We tested for host–epiphyte association in a tropical dry forest of central Mexico. In general, tropical dry forests harbour a low number of epiphyte species and, in some localities, epiphytes also show a low abundance (Gentry & Dodson Reference GENTRY and DODSON1987, Wolf & Flamenco Reference WOLF and FLAMENCO2003, Zimmerman & Olmsted Reference ZIMMERMAN and OLMSTED1992). In this forest type, only drought-tolerant epiphytes prosper (Gentry & Dodson Reference GENTRY and DODSON1987, Wolf & Flamenco Reference WOLF and FLAMENCO2003) and it is expected that those epiphytes able to live in dry climates would develop abundant populations (Zimmerman & Olmsted Reference ZIMMERMAN and OLMSTED1992) as has already been noted in some semi-arid regions (Benzing Reference BENZING1990). The low abundance of vascular epiphytes in some tropical dry forest could be due to the abundance of limiting host-tree species, with many tree species proving unsuitable for colonization by epiphytes because of their thin, smooth, peeling barks.
Tree size (Bernal et al. Reference BERNAL, VALVERDE and HERNÁNDEZ-ROSAS2005) and bark characteristics have been suggested to explain the presence of epiphytes on trees (Benzing Reference BENZING1990). It is generally expected that large adult trees with a non-peeling, thick and fissured bark should harbour more epiphytes than small hosts with a peeling, thin and smooth bark (Bernal et al. Reference BERNAL, VALVERDE and HERNÁNDEZ-ROSAS2005, Castro Hernández et al. Reference CASTRO-HERNÁNDEZ, WOLF, GARCÍA-FRANCO and GONZÁLEZ-ESPINOSA1999, López-Villalobos et al. Reference LÓPEZ-VILLALOBOS, FLORES-PALACIOS and ORTIZ-PULIDO2008, ter Steege & Cornelissen Reference TER STEEGE and CORNELISSEN1989). In the present study, we assessed epiphyte species distribution and abundance on hosts in the tropical dry forest of San Andrés de la Cal, Morelos, Mexico. Taking into account differences among host abundances, we tested for host–epiphyte associations, we predict that epiphytes must prefer host species with large adult individuals, non-peeling, thick and fissured bark, while limiting hosts species should have small individuals with peeling, thin and smooth bark.
MATERIALS AND METHODS
Study site
This study was carried out in the tropical dry forest of San Andres de la Cal, Tepoztlan, Morelos, Mexico (99°06′50.2″N, 18°57′22.2″W, 1495 m asl). Mean annual temperature is about 20.5 °C and mean annual precipitation is 1091.8 mm (Comisión Nacional del Agua, unpubl. data). The tropical dry forest in the studied area has an open canopy with low-stature trees (maximum 16 m). Some of the dominant tree species are Sapium macrocarpum Müll. Arg. (Euphorbiaceae), Bursera fagaroides (Kunth) Engl., B. glabrifolia (Kunth) Engl. (Burseraceae) and Conzattia multiflora (B.L. Rob.) Standl. (Fabaceae), which is the tallest (M. C. Pacheco-Alvarez, unpubl. data). According to published lists of species, in Tepoztlán there are 51 species of epiphyte (Espejo-Serna et al. Reference ESPEJO-SERNA, GARCIA CRUZ, LÓPEZ-FERRARI, JIMENEZ MACHORRO and SÁNCHEZ SALDAÑA2002, Reference ESPEJO-SERNA, LÓPEZ-FERRARI, RAMIREZ-MORILLO, HOLST, LUTHER and HILL2004; Riba et al. Reference RIBA, PACHECO, VALDÉS and SANDOVAL1996), of the families Orchidaceae (24 species), Polypodiaceae (16 species) and Bromeliaceae (11 species), but no specific work has been carried out to survey the epiphyte diversity of the municipality.
Data collection
Ten 0.1-ha forest plots (10 × 100 m), selected previously in order to describe the tropical dry forest of the area (M. C. Pacheco-Alvarez, unpubl. data), were surveyed in this study. Plots were separated by a mean distance of 998 m (range = 67–2411 m). In each plot we tagged (with aluminium labels) and identified all woody species with a diameter at breast height (dbh) > 3 cm. We included thin plants of 3 cm as in this forest they can reach the low-stature canopy. For each woody plant, we recorded dbh and identified and counted all the epiphyte stands. Trees greater than 5 m in height were climbed (Jepson Reference JEPSON1998), while those less than 5 m were evaluated from the ground using binoculars. To obtain epiphyte abundance, we counted the number of stands (Sanford Reference SANFORD1968) of each epiphyte species. Following Sanford (Reference SANFORD1968), we considered as a stand a group of rosettes (Bromeliaceae), leaves (ferns) or stems (Orchidaceae) of a single epiphyte species separated from another group of the same species. Voucher specimens of the species were deposited in the herbarium HUMO (Universidad Autónoma del Estado de Morelos) and UAMIZ (Universidad Autónoma Metropolitana–Iztapalapa).
We determined two bark characteristics for each woody species; texture and peeling behaviour (Moreno Reference MORENO1987, Pennington & Sarukhán Reference PENNINGTON and SARUKHÁN1998). Texture was classified in three categories; rugose, when the bark surface had irregular pleats and/or wrinkles; fissured, when bark had strong longitudinal crevices and ribs; and smooth, when the surface bark was plain and glossy from a distance of 1–2 m, but could have small irregularities, such as lenticels (Moreno Reference MORENO1987, Pennington & Sarukhán Reference PENNINGTON and SARUKHÁN1998). A host species was defined as with peeling bark if its bark had abundant sheets or flakes separating from the trunk and branches. We determined bark thickness for those host species with more than five individuals. From each individual a piece of trunk bark was collected and frozen (−20 °C). From each piece we obtained a clean cut (5 cm width), which was scanned (to 800 dpi and enlarged to 15 cm width) with a 50-mm scale, and bark thickness was measured with the software Image Basic (Versión 1.38). From each sample we obtained five measurements of thickness but for data analysis we used the mean of each sample.
Host–epiphyte association
To test for host-epiphyte association, we used the ten woody species with at least ten individuals that were present in at least three plots, and the category of ‘other hosts’ (for the remaining host species). In this analysis, we used six true epiphyte species with more than 150 stands, plus the category ‘seedlings’ (which included small seedlings of all the species that could not be identified to species). We constructed a contingency table of 11 rows (host types) and seven columns (epiphyte taxa) containing the number of epiphyte stands observed in each host. With a χ2 goodness-of-fit test, we tested for association between epiphytes and host species (Siegel & Castellan Reference SIEGEL and CASTELLAN2005). Expected values of the epiphyte stands on each host were obtained considering host abundance. No host abundance measure has been suggested as the main one determining epiphyte abundance, to resolve this we used two different measures of host species abundance: pooled number of individuals observed in the ten transects and pooled basal area (Appendix 1).
As the contingency table analyses were significant, we performed analyses of Haberman standardized residuals (Haberman Reference HABERMAN1973, Siegel & Castellan Reference SIEGEL and CASTELLAN2005) in order to isolate values observed which differed from those expected (Bernal et al. Reference BERNAL, VALVERDE and HERNÁNDEZ-ROSAS2005, López-Villalobos et al. Reference LÓPEZ-VILLALOBOS, FLORES-PALACIOS and ORTIZ-PULIDO2008). Using the standardized residual value, we determined whether each host species had an abundance of epiphytes higher, lower or as expected by chance for each epiphyte taxon. A preferred host species had a standardized residual > 2, showing that epiphyte abundance was higher than expected; a limiting host species had a standardized residual < −2, showing that epiphyte abundance was lower than expected; a neutral host species had a standardized residual ≤ 2 and ≥ −2, showing that epiphyte abundance was as expected. To obtain a community-based classification of host quality (i.e. as preferred, neutral or limiting) we considered that a preferred host species had more epiphyte stands for ≥5 epiphyte taxa (including seedlings) and a limiting host species had fewer epiphyte stands for ≥5 epiphyte taxa; while a neutral host species had an abundance of epiphyte taxa as expected by chance for ≥5 epiphyte taxa.
Host characteristics determining host preferences
With Kruskall–Wallis ANOVA (Siegel & Castellan Reference SIEGEL and CASTELLAN2005), we tested whether the size of individual trees or their bark thickness differed between host species. As a measure of host size between the individuals of different species we used the basal area of each individual. All multiple comparisons among medians were done with the Duncan test (Siegel & Castellan Reference SIEGEL and CASTELLAN2005).
RESULTS
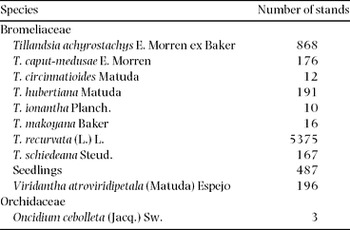
We found ten vascular plant species living as true epiphytes (Table 1). The majority of the 7501 epiphyte stands were of Tillandsia recurvata (72%), followed by T. achyrostachys (12%) (Table 1). Additionally we noted 28 stands of accidental epiphytes such as seedlings and saplings of trees and terrestrial plant species.
Species list and number of true epiphyte stands found in ten 0.1-ha transects of tropical dry forest at San Andres de la Cal, Morelos, Mexico.

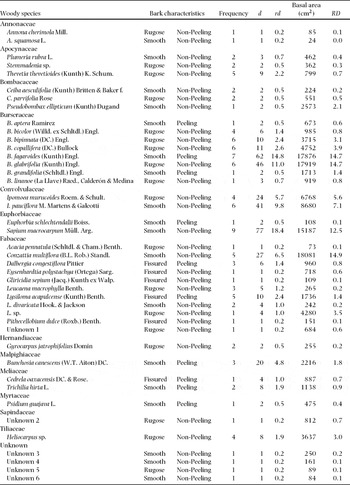
We found 418 individuals of 42 host species (Appendix 1). Sapium macrocarpum was the host comprising most individuals (18.4%) and Conzattia multiflora was the host with the largest pooled basal area (14.9%) in the forest studied (Appendix 1).
Host–epiphyte association
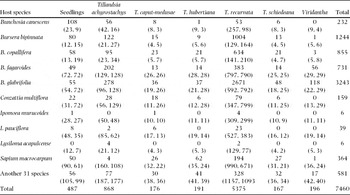
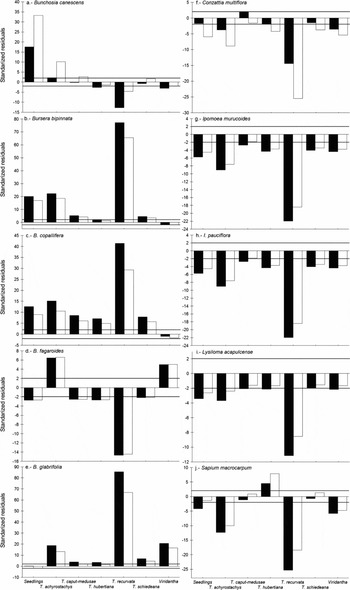
Amongst host species, epiphyte distribution was not random when epiphyte expected values were calculated using the number of individuals of the host species (χ2 = 21216, P < 0.00001) or pooled basal area (χ2 = 15542, P < 0.00001) (Table 2). Analyses of standardized residual showed that Bursera bipinnata, B. copallifera and B. glabrifolia were preferred by more than five epiphyte taxa (Figure 1).
Observed number of epiphyte stands on each host species. Observed values correspond to the number of epiphyte stands found in ten 0.1 ha transects of tropical dry forest at San Andres de la Cal, Morelos, Mexico. Figures in parentheses are the expected number of stands according to two host abundance measures, number of individuals and pooled basal area (individuals, basal area).

Standardized Haberman residuals showing the direction of association between seven epiphyte taxa and Bunchosia canescens (a), Bursera bipinnata (b), B. copallifera (c), B. glabrifolia (d), B. fagaroides (e), Conzattia multiflora (f), Ipomoea murucoides (g), I. pauciflora (h), Lysiloma acapulcense (i) and Sapium macrocarpum (j) in a tropical dry forest at San Andres de la Cal, Morelos, Mexico. Residuals come from two different methods of measuring host abundance for epiphytes: number of individuals (black bars) and pooled basal area (white bars). Residuals with a value < −2 show that epiphytes were less abundant than expected by chance; residuals with a value between −2 and 2 show that epiphytes were as abundant as expected by chance and finally, residuals with a value >2 show that epiphytes were more abundant than expected by chance. The continuous lines show the limits of 2 and −2.

We did not find any neutral hosts. The hosts Bunchosia canescens, Sapium macrocarpum (Figure 1) and ‘another 31 host species’ could not be classified as preferred, neutral or limiting hosts, because residual analyses did not show a clear pattern and they could be neutral, limiting or preferred for some epiphyte taxa or its quality for epiphytes depends on the measure of host abundance used to calculated the expected values of epiphytes (Figure 1). For the rest of analysis we deal with B. canescens and S. macrocarpum as indeterminate hosts.
Bursera fagaroides, Conzattia multiflora, Ipomoea murucoides, I. pauciflora and Lysiloma acapulcense were limiting hosts, as they had a lower abundance of epiphytes than expected by chance for five to seven epiphyte taxa (Figure 1). However, B. fagaroides was a preferred host for Tillandsia achyrostachys and Viridantha atroviridipetala.
Host characteristics determining host preferences
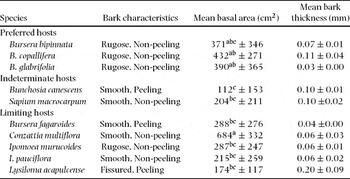
Basal area of phorophytes differed between host species (H = 81.7, P < 0.001) (Table 3). Basal area of phorophytes followed a gradient of size in which the biggest was Cozattia multiflora, a limiting host species (Table 3). Host size also differed (H = 36.7, P < 0.001) when species were grouped by their quality for epiphytes (preferred, limiting or indeterminate). The basal area of indeterminate host was smaller (186 ± 204 cm2 of basal area per individual, hereafter mean ± 1 SD) than preferred (395 ± 344 cm2 of basal area per individual), and limiting hosts (327 ± 312 cm2 of basal area per individual). The basal area of limiting hosts did not differ from that of preferred ones.
Mean basal area and bark thickness of individual (dbh ≥3 cm) of 14 woody species found in ten 0.1-ha transects of tropical dry forest at San Andres de la Cal, Morelos, Mexico. Values are mean ± SD. Different letters indicate significant differences between means (Duncan test, P < 0.05).

Six host species had fissured bark (three with peeling behaviour and three non-peeling); 18 host species had smooth bark (seven with peeling behaviour and 11 non-peeling); and 18 host species had non-peeling rugose bark (Appendix 1). Bark thickness did not differ between host species (H = 15.8, P > 0.05) (Table 3), however, bark thickness differed among host species grouped as preferred, limiting and indeterminate (H = 6.1, P = 0.047). Indeterminate hosts had thicker bark (0.10 ± 0.04 mm) than the preferred (0.07 ± 0.06 mm) and limiting hosts (0.08 ± 0.09 mm). Preferred and limiting hosts had bark of similar thickness.
We could not correlate bark properties (texture and peeling behaviour) with host quality (preferred, limiting and indeterminate) because there were no hosts with rugose, peeling bark in the sample (Appendix 1), nor with fissured, non-peeling bark between those host species determined as preferred, limiting and indeterminate (Table 3). However, woody species with rugose, non-peeling bark were equally frequent amongst preferred and limiting host species (χ2 = 1.0, P = 0.31), suggesting that neither texture nor peeling behaviour influence host quality.
DISCUSSION
The vascular epiphytes studied showed host associations with the species of woody plants, and host associations were sufficiently consistent among epiphyte taxa to lead to host associations at community level. Host size could be important in determining host–epiphyte association because size could determinate the susceptibility of a host to be found by epiphyte seeds. However, the species with the tallest and widest tree in the studied forest (Conzattia multiflora) was found to be a limiting host and limiting and preferred hosts were of similar size.
Contrary to our expectations, bark characteristics (bark thickness, texture and peeling behaviour) did not correlate with host quality. Some authors have found that thick and porous bark is a determinant factor in epiphyte seedling survival (Castro-Hernández et al. Reference CASTRO-HERNÁNDEZ, WOLF, GARCÍA-FRANCO and GONZÁLEZ-ESPINOSA1999), while others (ter Steege & Cornelissen Reference TER STEEGE and CORNELISSEN1989, Zimmerman & Olmsted Reference ZIMMERMAN and OLMSTED1992) have found that hosts with peeling bark contain a lower epiphyte species richness than non-peeling-bark hosts, possibly because peeling bark could increase seedling mortality (López-Villalobos et al. Reference LÓPEZ-VILLALOBOS, FLORES-PALACIOS and ORTIZ-PULIDO2008). Our results indicate that host quality did not depend on texture or peeling behaviour. We determined bark characteristics based on trunk samples, but at the study area epiphytes are most abundant on branches (J. P. Ruiz Cordova., unpubl. data). Maybe bark of branches differs from that of the trunk. Because branches are younger than trunk, branch bark is generally smooth, thin and with less peeling (López-Villalobos et al. Reference LÓPEZ-VILLALOBOS, FLORES-PALACIOS and ORTIZ-PULIDO2008). However, for preferred and limiting hosts the older trunk bark did not differ in thickness. Additionally to bark texture and behaviour, other bark properties (such as chemical composition) might be determining epiphyte colonization success.
Host species have a combination of unique characteristics (Laube & Zotz Reference LAUBE and ZOTZ2006), making it difficult to suggest general host properties that determine host quality. For example, although a host species with fissured/rugose and non-peeling bark could be considered a favourable habitat for epiphytes, we found two limiting hosts with this combination of bark characteristics (Ipomoea murucoides, Lysiloma acapulcense). For these host species, new experiments suggest that their bark contains allelochemicals that exerted a negative effect on the seed germination of T. recurvata (Valencia-Díaz et al. Reference VALENCIA-DÍAZ, FLORES-PALACIOS, RODRÍGUEZ-LÓPEZ, VENTURA-ZAPATA and JIMÉNEZ-APARICIO2010).
We found that forest host composition could limit the abundance of epiphytes. In the tropical dry forest studied, only 7% of the host species and 16% of the host individuals were preferred hosts for epiphytes. We recorded 72% of the epiphyte stands on these hosts, indicating a clear epiphyte preference. Limiting host species formed 12% of the total host species and 39% of host individuals and supported only 13% of epiphyte stands. As a consequence, temporal and spatial changes in the woody plant composition of the tropical dry forest studied could determine the abundance of epiphytes. In some other forests a similar pattern has been observed: for example, in a lower montane cloud forest in Veracruz, Mexico, it was found that tree-ferns hosted a unique epiphyte community, but the tree-ferns did not survive in secondary habitats (Flores-Palacios & García-Franco Reference FLORES-PALACIOS and GARCÍA-FRANCO2008); the major difference between that cloud forest and the tropical dry forest in the present study is that, in San Andrés de la Cal, the majority of epiphytes preferred a small group of host species, making host preference a community-level phenomenon.
At the species level, the general pattern of host quality could be slightly different. In the case of Tillandsia recurvata, the most abundant epiphyte species, the forest was composed of preferred and limiting hosts. Tillandsia recurvata is the bromeliad species with the largest geographical distribution range in the family Bromeliaceae (Smith & Downs Reference SMITH and DOWNS1977); it can inhabit power lines and in some areas has even been considered a weed (Claver et al. Reference CLAVER, ALANIZ and CALDIZ1983). Our data suggest that, instead of host preference, T. recurvata was strongly host limited in the forest studied. A similarly biased distribution of T. recurvata has been observed in the xerophytic shrubland of Mexico (Bernal et al. Reference BERNAL, VALVERDE and HERNÁNDEZ-ROSAS2005). The degree of host limitation found for T. recurvata is similar to that found in the host-specific orchid Lepanthes caritensis (Tremblay et al. Reference TREMBLAY, ZIMMERMAN, LEBRÓN, BAYMAN, SASTRE, AXELROD and ALERS-GARCÍA1998). In the Carite State Forest, Puerto Rico, Tremblay et al. (Reference TREMBLAY, ZIMMERMAN, LEBRÓN, BAYMAN, SASTRE, AXELROD and ALERS-GARCÍA1998) found that only one tree species and only 7% of the individual hosts at tree community level supported L. caritensis stands.
In the tropical dry forest of San Andrés de la Cal, the low abundance of epiphytes, coupled with the high concentration on a few host species, suggests host limitation. Strong evidence supporting our interpretation of host limitation can be seen in the fact that 12% of the host species were limiting hosts, which differs from previous studies (Bennett Reference BENNETT1987) in which the focus was to find epiphyte host preferences, rather than determining the direction of host–epiphyte associations. More research on this topic is necessary, particularly experimental research focusing on the fitness consequences of host selection by epiphytes.
ACKNOWLEDGEMENTS
A. Espejo-Serna (Bromeliaceae), K. Mehltreter (Pteridophytes), N. Mariano (Convolvulaceae) and J. M. de Jesús Almonte (Fabaceae) helped with species identification. We strongly acknowledge the help provided by the Tepoztlán authorities and the Technical Direction of the Corredor Biológico Chichinautzin (CONANP). Comments and criticism of A. Flores Morales, C. Martínez-Garza, J. G. García-Franco, R. E. Pérez Pérez, R. Alcala, K. MacMillan and two anonymous reviewers improved the manuscript. This research was supported by a PROMEP grant to AFP (PROMEP/103.5/05/1901), a PROMEP scholarship to CAVT and CIByC. An earlier version was presented by CAVT as a Bachelor's thesis at the Faculty of Biological Sciences, Universidad Autónoma del Estado de Morelos.
Woody species (dbh ≥3 cm) found in a sample of ten 0.1-ha transects of tropical dry forest at San Andres de la Cal, Morelos, Mexico. For each species is shown its frequency (number of plots where the species was found), number of individuals found in the sample (d), relative density (rd), pooled basal area of each species in the sample and relative dominance (RD). The relative values were calculated as: rd=100·d 1/∑Si=1di and RD=100·BA 1/∑Si=1BAi where di is the number of individuals of species i found in the sample and BAi is the pooled basal area of species i found in the sample. Basal area was obtained from the dbh measured to each trunk of each host individual with the formulae BA=π·(1/2·dbh)2.