Introduction
Persian walnut (Juglans regia L.) is one of the most important species belonging to the family Juglandaceae. It has high commercial importance due to its nuts with high nutritional value. Iran has been known as one of the critical centres of the origin and diversity of walnuts worldwide. Cross-pollination and sexual propagation are the main reasons for high genetic diversity in walnuts (Arzani et al., Reference Arzani, Mansouri-Ardakan and Vezvaei2008). Monoecism and dichogamy in walnuts, which usually cause outcrossing, have increased the genetic diversity of this plant.
Many research works have investigated the morphological diversity of walnut genotypes (Ebrahimi et al., Reference Ebrahimi, Fattahi-Moghadam, Zamani and Vahdati2009; Vahdati et al., Reference Vahdati, Mohseni-Pourtaklu, Karimi, Barzehkar, Amiri, Mozaffari and Keith2014). Kernel and nut characteristics are the most critical morphological traits to differentiate the genotype (Ebrahimi et al., Reference Ebrahimi, Fatahi and Zamani2011; Karimi et al., Reference Karimi, Ershadi, Ehteshamnia, Sharifani, Rasouli, Ebrahimi and Vahdati2014; Poggetti et al., Reference Poggetti, Ermacora, Cipriani, Pavan and Testolin2017) but these characteristics are affected by the environment and growth stage of the plant (Shah et al., Reference Shah, Bakshi, Sharma, Jasrotia, Itoo, Gupta and Singh2021).
The research indicated that molecular markers, regardless of the environment and growth stage of plant, can be applied to evaluate diversity at DNA level and reveal the inter- and intra-species genetic relationships of Juglans genus (Shah et al., Reference Shah, Bakshi, Sharma, Jasrotia, Itoo, Gupta and Singh2021). The genetic diversity of walnuts has been investigated using different molecular markers such as random amplified polymorphism (RAPD) markers (Ahmed et al., Reference Ahmed, Mir, Mir, Rather, Rashid, Wani, Shafi, Mir and Sheikh2012), inter simple sequence repeats (ISSR) (Yang et al., Reference Yang, Wu, Zheng, Chen, Liu and Huang2007) and simple sequence repeat (Chen et al., Reference Chen, Ma, Chen, Wang and Pei2014; Torokeldiev et al., Reference Torokeldiev, Ziehe, Gailing and Finkeldey2018; Balapanov et al., Reference Balapanov, Suprun, Stepanov, Tokmakov and Lugovskoy2019; Bernard et al., Reference Bernard, Barreneche, Lheureux and Dirlewanger2020).
In the past few years, start codon of target (SCoT) markers have emerged and been used to evaluate genetic diversity in different plant species. SCoT marker is one of the PCR-based markers amplified using single primers, designed to attach to the protected nucleotide sequences of ATG codon (Collard and Mackill, Reference Collard and Mackill2009). Compared to ISSR and RAPD markers, SCOT markers have higher polymorphism and are reproducible (Amirmoradi et al., Reference Amirmoradi, Talebi and Karami2012) and cost-effective. SCoT markers have been successfully employed in investigating genetic diversity in citrus (Mahjbi et al., Reference Mahjbi, Baraket, Oueslati and Salhi-Hannachi2015; Juibary et al., Reference Juibary, Seyedmehdi, Sheidai, Noormohammadi and Koohdar2021), grapes (Guo et al., Reference Guo, Zhang and Liu2012) and pistachio (Baghizadeh and Dehghan, Reference Baghizadeh and Dehghan2018; Malekzadeh et al., Reference Malekzadeh, Mahmoodnia and Amirebrahimi2018), but there are limited reports on walnuts. A study investigated the genetic diversity of 20 walnut populations with three SCoT primers and reported that molecular variance percentages between and within populations were 59 and 41%, respectively (Tabasi et al., Reference Tabasi, Sheidai, Hassani and Koohdar2020). The first step in walnut breeding programmes is the identification, evaluation and selection of genotypes emphasizing on native and old ones due to their long-term adaptation to environmental conditions (Aslantas, Reference Aslantas2006). Native and old walnut genotypes are tolerant to environmental stresses; therefore, it is essential to study genetic structures and conserve them as genetic resources to use in breeding programmes (Lindenmayer et al., Reference Lindenmayer, Laurance and Franklin2012).
The genetic diversity of walnut was studied using molecular and morphological markers regardless of genotype age. Therefore, the objective of this study was to determine the genetic relationships of some old walnut genotypes in Iran in order to select superior genotypes and improve their conservation. In addition, the efficiency of SCoT marker in determining the genetic relationships of walnuts was investigated in order to improve the management of the genetic resources of walnut. The results of this research can be used in the future in breeding works or preparing walnut cuttings.
Materials and methods
Morphological evaluation
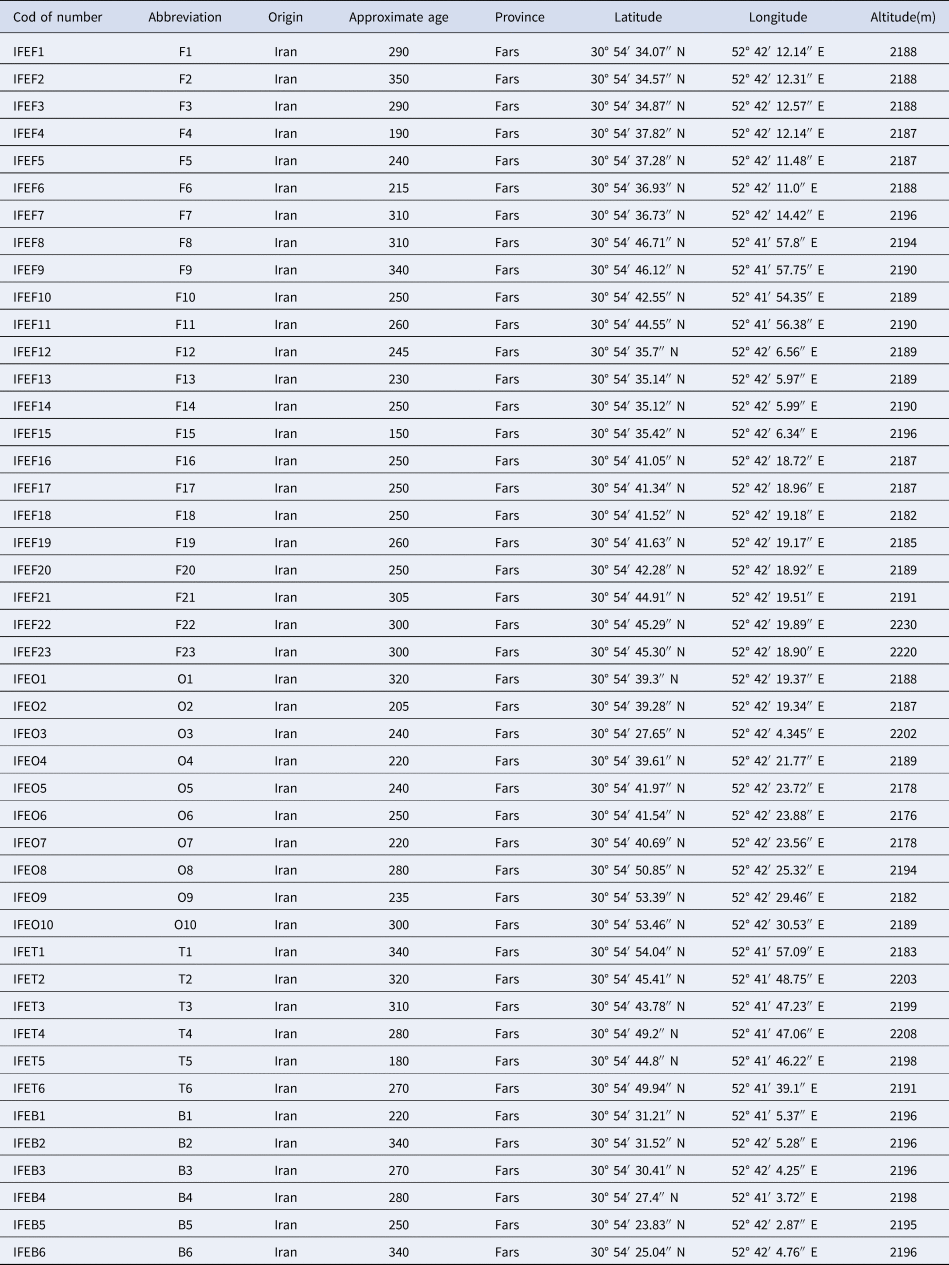
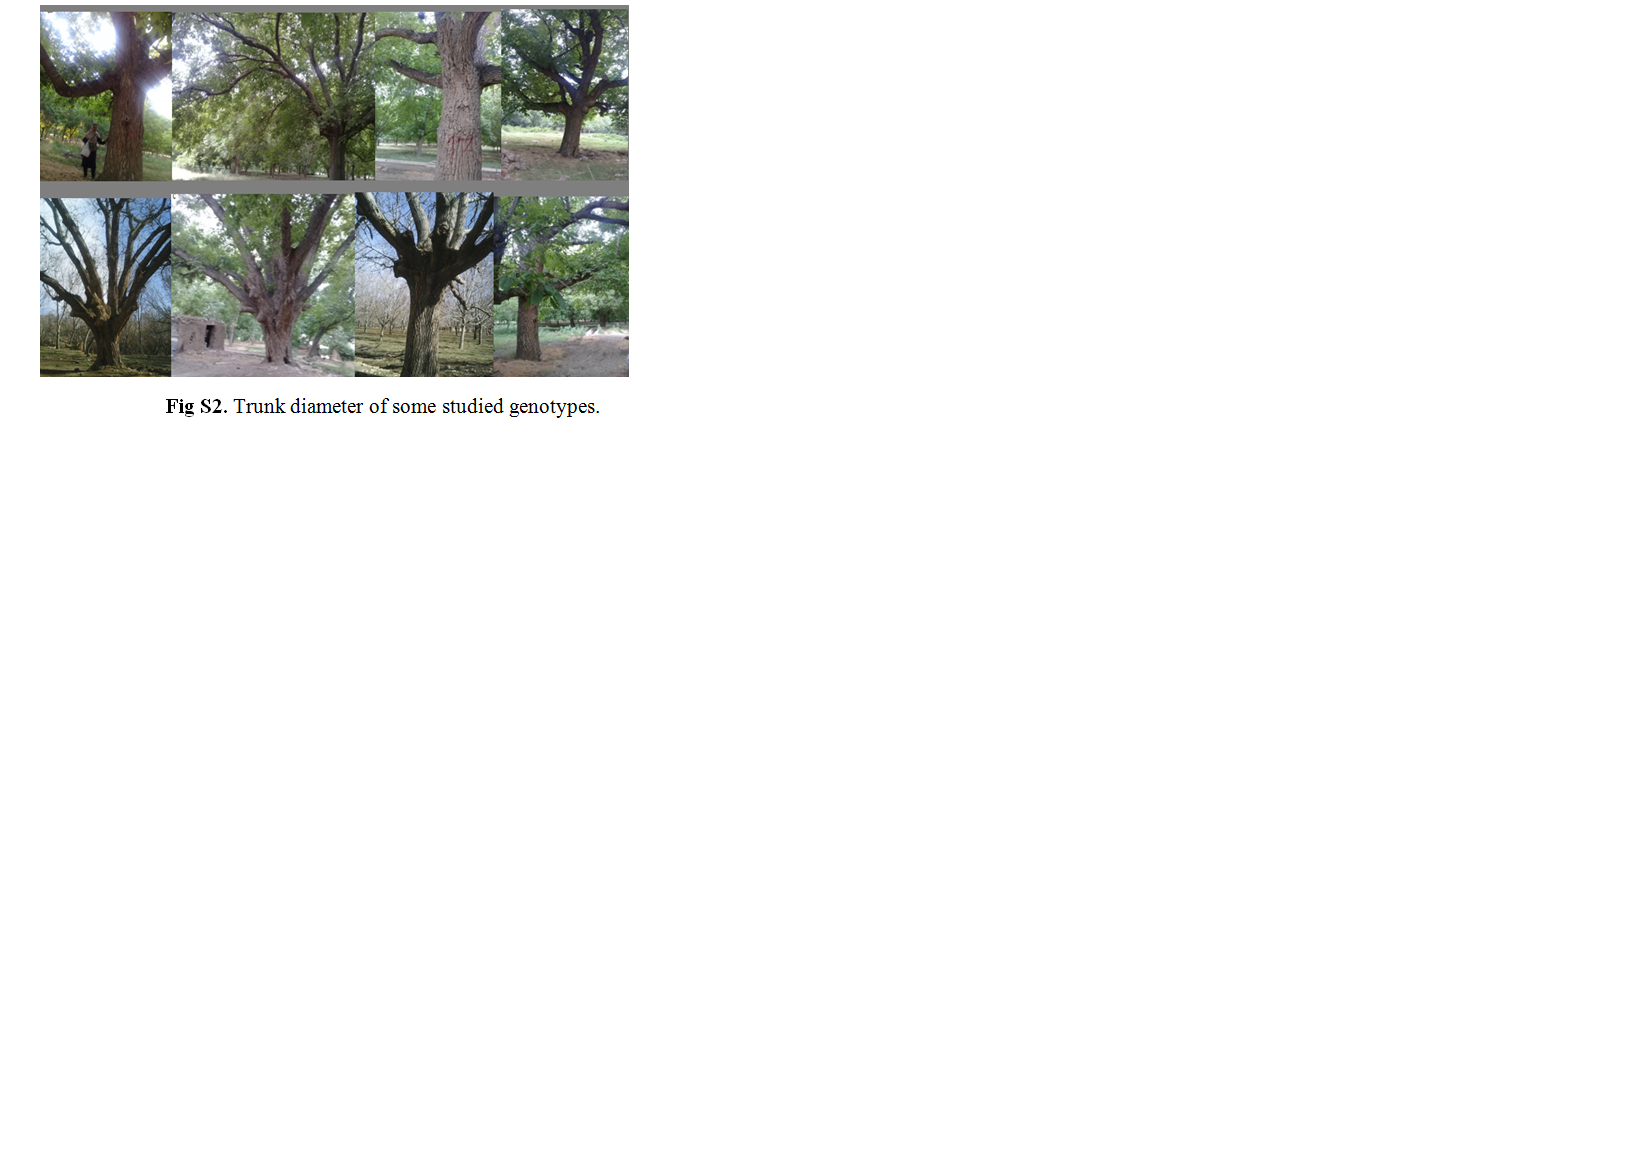
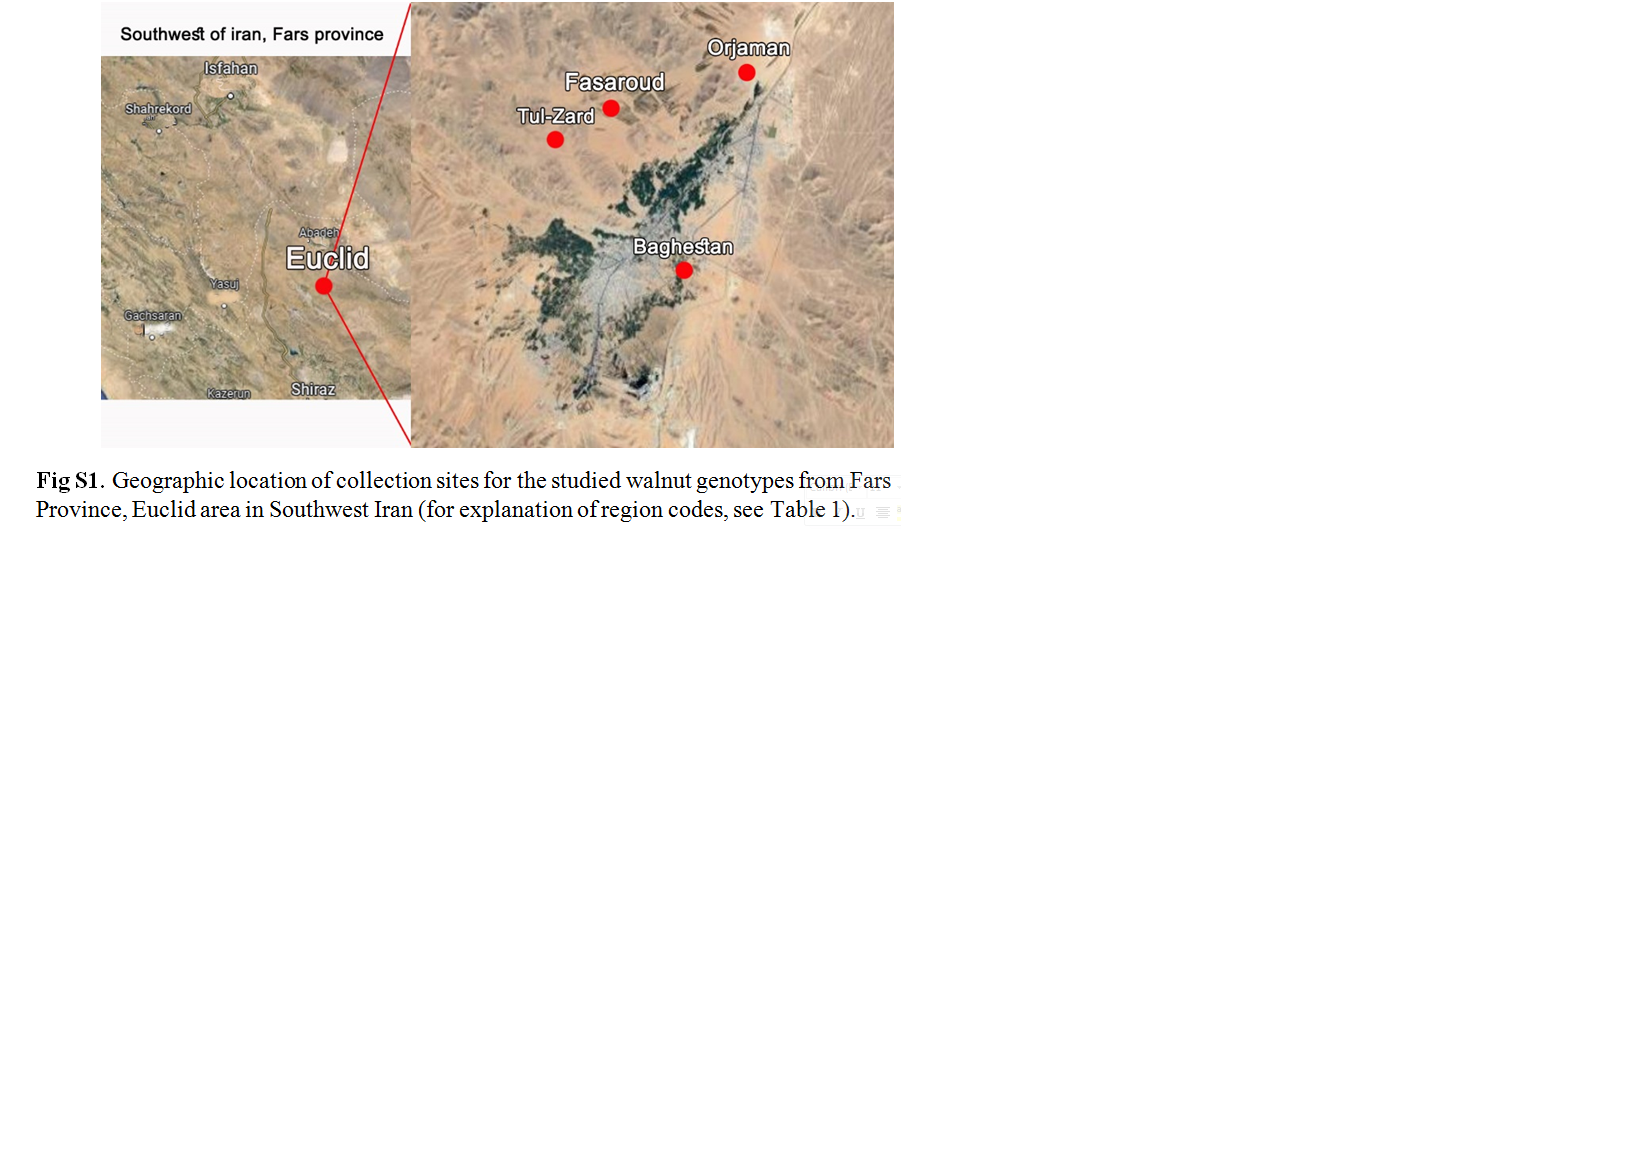
In this study, 45 old walnut genotypes aged 150–350 years were identified from Southwestern Iran, Fars province and were evaluated based on nut and kernel quantitative traits in two consecutive years of 2018 and 2019, using International Plant Genetic Resources Institute (IPGRI, 1994) descriptor. Considering that the density and availability of genotypes were different in each region, the trees were grouped into four geographical areas of region one (Fasaroud), region two (Orjaman), region three (Tul-Zard) and region four (Baghestan) (Table 1; online Supplementary Fig. S1). The studied genotypes included old walnut trees of seedling origin (online Supplementary Fig. S2). The approximate ages of genotypes were estimated based on the information available in the region and experienced and elderly people. The quantitative traits investigated in this research included 14 morphometric traits of the length, width and thickness of nut and kernel as well as shell thickness, thickness and length of packing tissue, the weights of kernel, nut, shell and packing tissue and kernel percentage (online Supplementary Table S1). From each genotype, 15–20 fruits were randomly selected and after removing their hull, they were dried at a temperature of 25°C. The weights of kernel, packing tissue, nut and shell were measured by a digital scale (model BPSIID, Sartorius, Germany). Characteristics of length, width and thickness of nut and kernel as well as shell thickness, packing tissue thickness and packing tissue length were determined using digital caliper (model EGL-111, Guanglu Company, Japan). Kernel percentage in each genotype was obtained based on the ratio of kernel weight to nut weight (Zeneli et al., Reference Zeneli, Kola and Dida2005).
Genotypes, code of number and geographic origin of the walnut material studied

Molecular evaluation with SCOT marker
Genomic DNA from the fresh tissue of young leaves of different genotypes was extracted according to Murray-Thomson method (Reference Murray and Thompson1980). The quantity and quality of the extracted DNA were determined using a Nanodrop Spectrophotometer (Nanophotometer NPOS 1.1 a build 11648 Implen) and agarose gel electrophoresis method.
Polymerase chain reaction
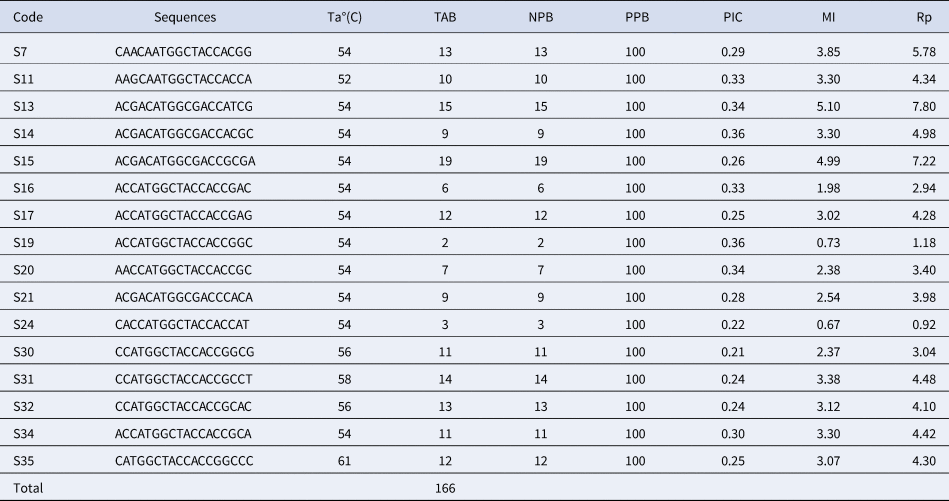
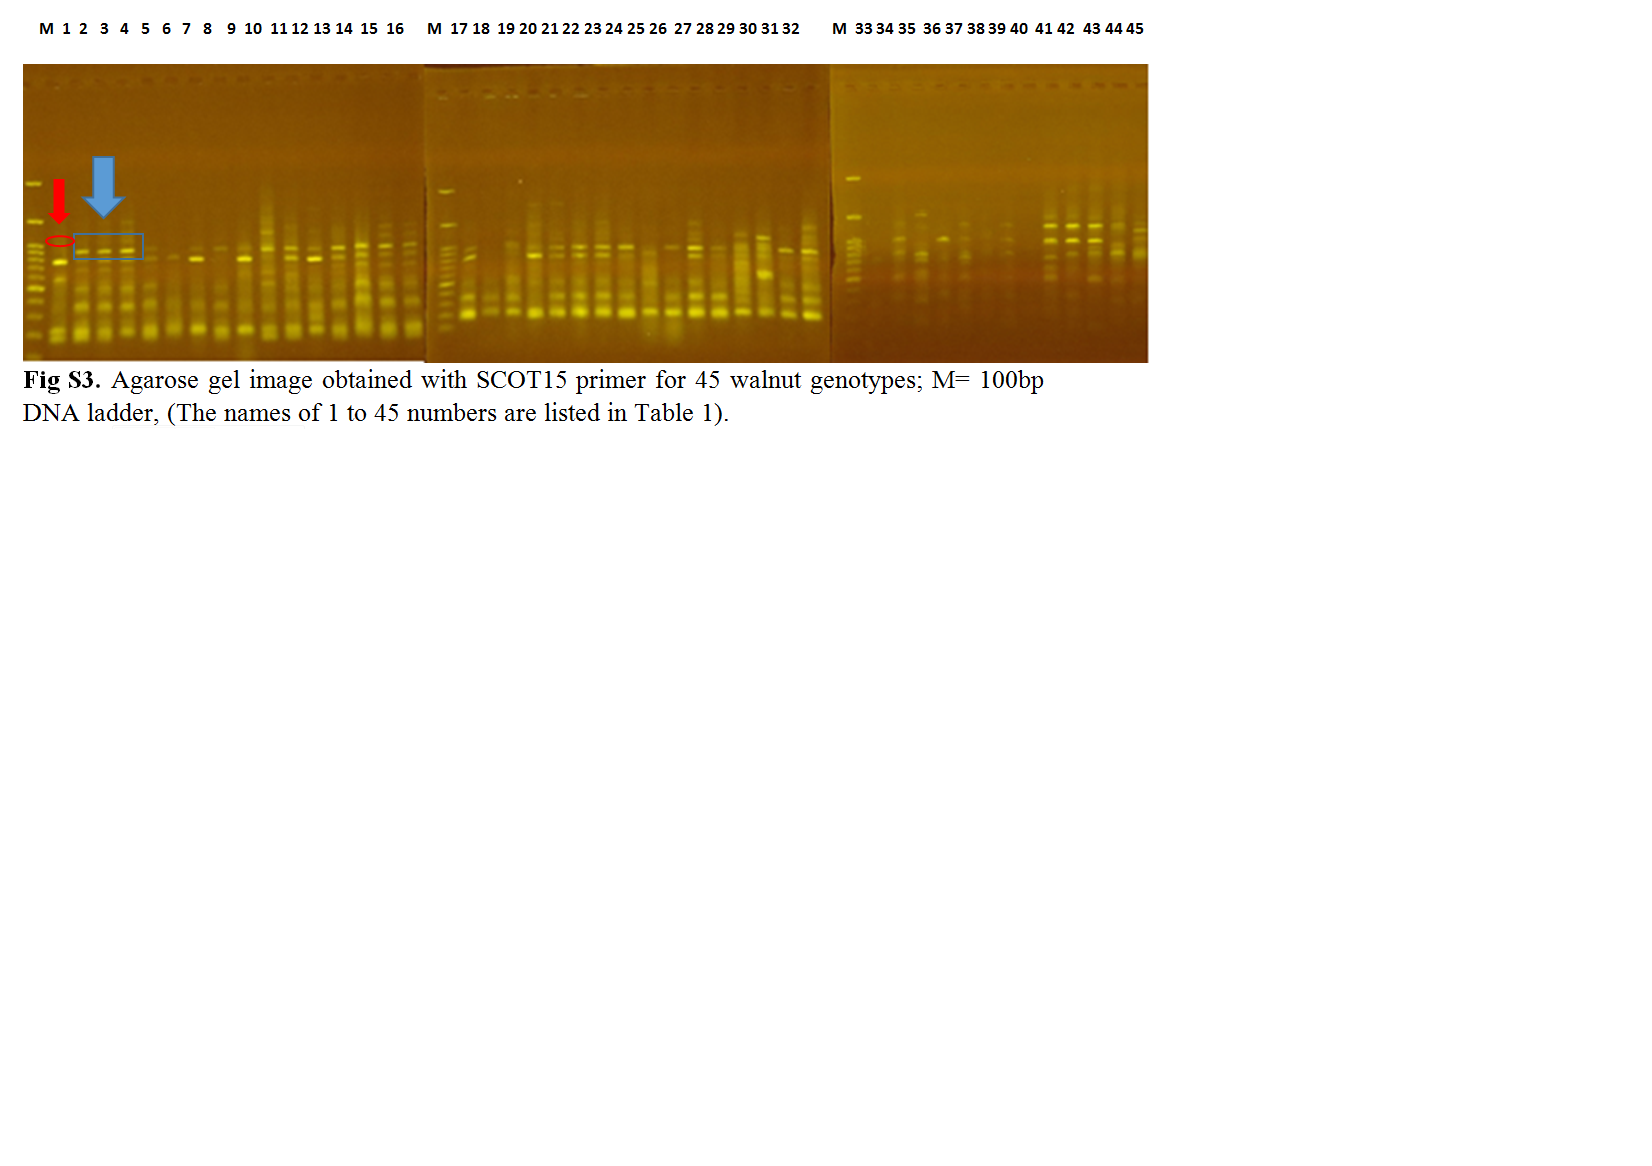
From the 36 SCoT primers tested in this research, 16 primers that produced clear fragments with high reproducibility were applied to evaluate all genotypes (Table 2). PCR reaction was performed in 20 microliter aliquots using PCR Master Mix (2X PCR kit) prepared by Sinagen Company, Iran. Polymerase chain reaction was carried out with the following temperature conditions: initial denaturation at 94°C for 3 min, 40 cycles of denaturation at 94°C for 30 s, primer annealing for 30 s at each primer optimum temperature, primer extension at 72°C for 2 min and final extension at 72°C for 7 min using a thermocycler (Bio-Rad, C1000tm Thermal Cycler, USA). Finally, PCR products were electrophoresed on 1.5% agarose gel in 1X TBE buffer at 80 V for 2 h and were then used for photographing with a gel document (UVP) device (online Supplementary Fig. S3).
List and sequence of SCoT primers, number of bands, number of polymorphic bands, polymorphism percent, polymorphism information content (PIC), marker index (MI) and resolution power (Rp) for used SCoT primers in this study

TAB, total amplified bands; PB, number of polymorphic bands; PPB, percentage of polymorphic bands; PIC, polymorphic information content; Rp, resolution power; MI, marker index.
Data analysis
The profiles of PCR fragments were scored as zero (absence of band) and one (presence of band) for each allele. To evaluate the efficiency of each primer, polymorphic information content (PIC) (Weising et al., Reference Weising, Nybon, Wolff and Kahl2005), resolving power (Prevost and Wilkinson, Reference Prevost and Wilkinson1999) and marker index (MI) (Powell et al., Reference Powell, Morgante, Andre, Hanafey, Vogel, Tingey and Rafalski1996) were separately calculated. Genetic diversity parameters, including polymorphic loci percentage, adequate number of alleles (ne) and allelic diversity were calculated by GenAleX 6.5 software to study genetic diversity within the population. Analysis of molecular variance (AMOVA) (Peakall and Smouse, Reference Peakall and Smouse2006) and the relationship between genetic and geographic distances of the studied populations were performed using GenAleX6.5 software. Clustering of genotypes and principal coordinate analysis (PCoA) were performed using NTSYS Ver. 2.02 (Rohlf, Reference Rohlf1998) and GenAleX 6.5.
Results
Morphological characteristic
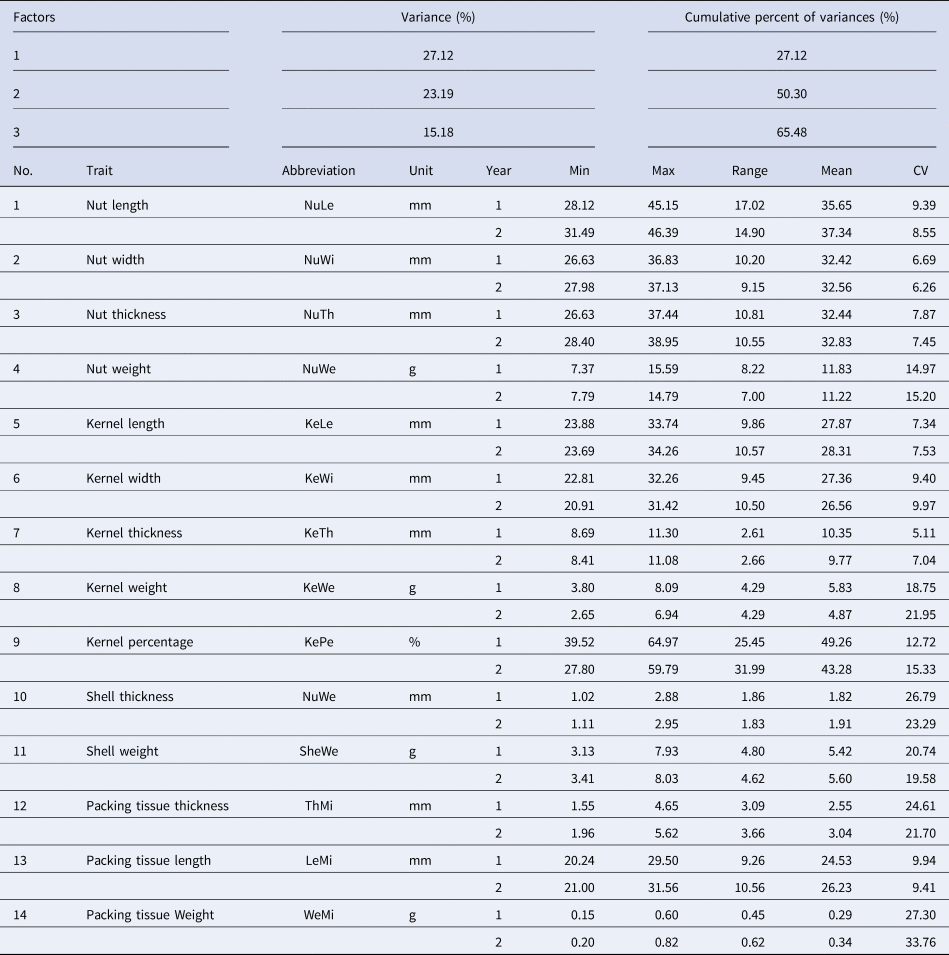
The minimum, maximum, mean, standard deviation and phenotypic diversity index values for each trait are summarized in Table 3. Genotypes showed high variability in the measured traits (Fig. 1). Among the measured traits, the highest percentages of phenotypic variation in both years were obtained for packing tissue weight, which were 33.76 and 27.30% in the first and second years, respectively. In addition, shell thickness showed a high variation percentage in both years. Among all measured traits, the lowest percentage of variation in the 2 years was obtained for nut width with the values of 6.69 and 6.26%, and followed by kernel thickness and kernel length (Table 3).
Nut and kernel characteristics of some studied walnut genotypes.

Walnut characteristics, range of variability, mean and coefficient of variation (CV) for quantitative traits

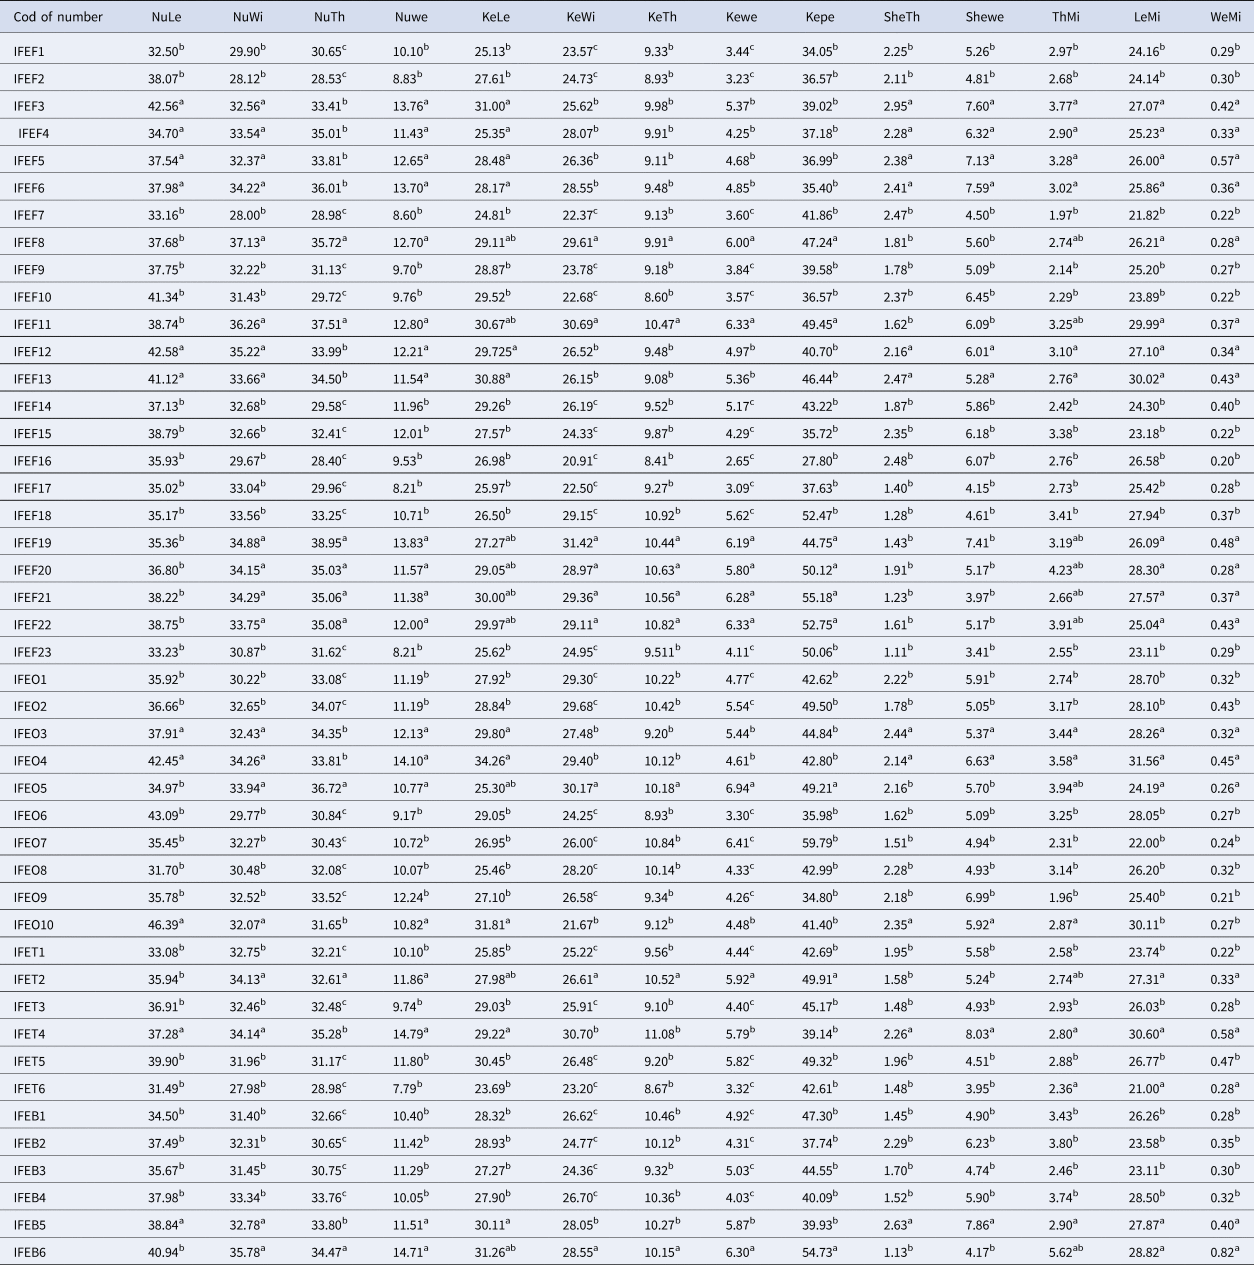
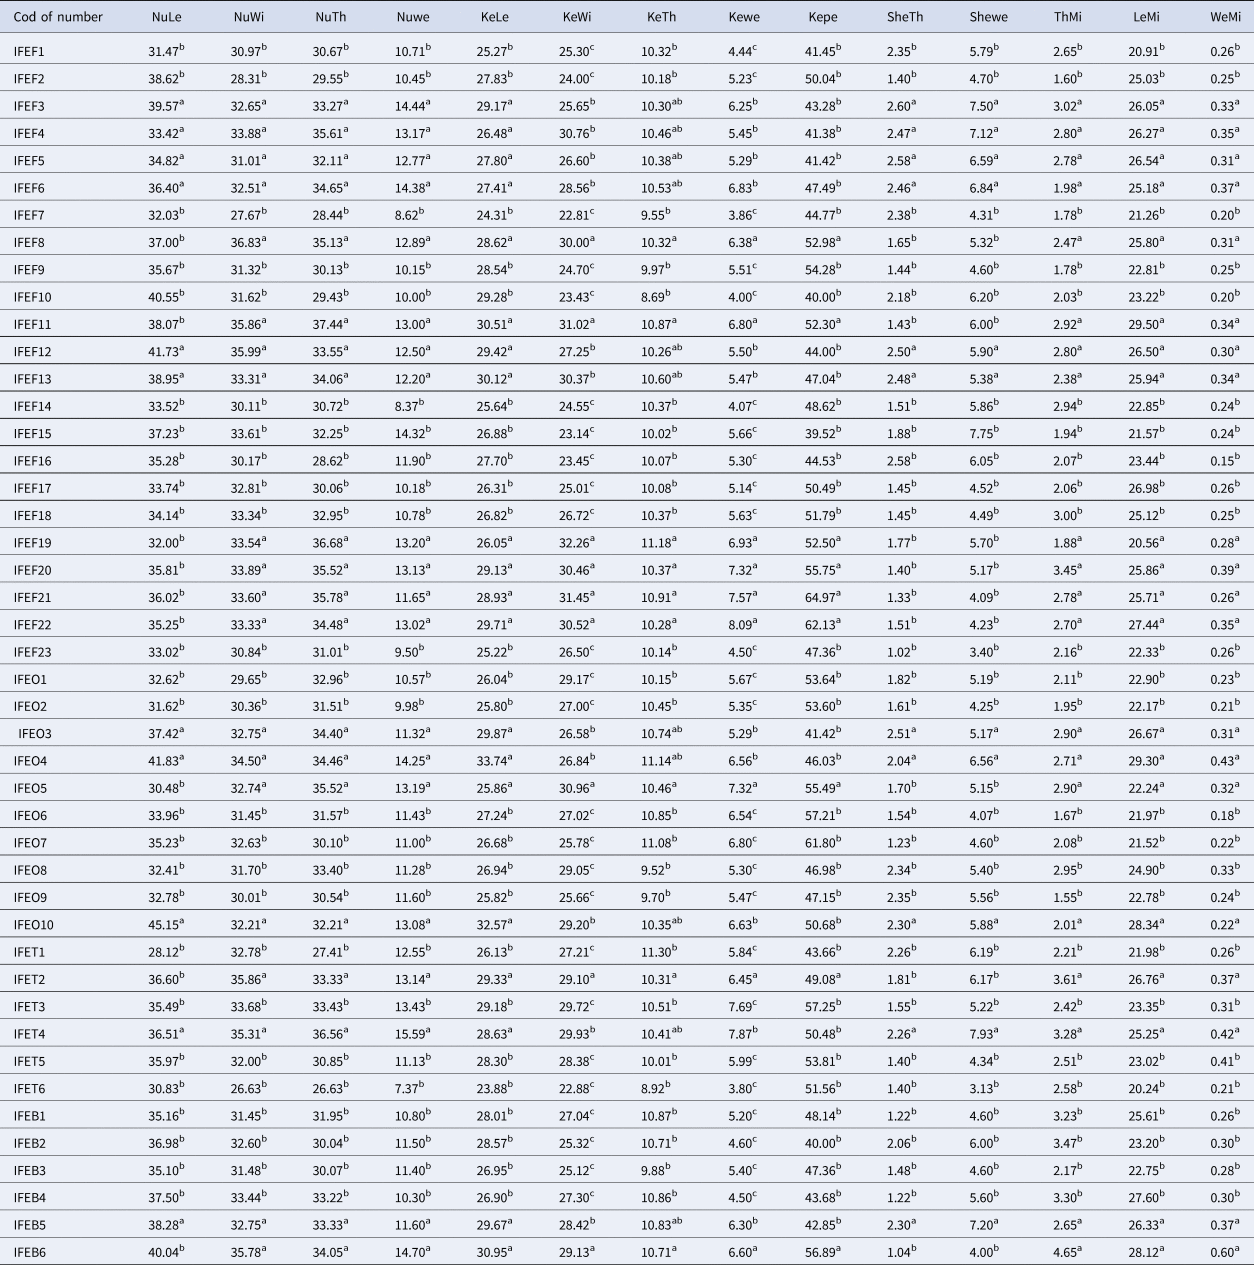
Based on the obtained results, the highest nut length, nut thickness and nut width in both years were obtained for genotype O10 from region two as well as genotypes F19, F11 and F8 from region one. O4 genotype from region two had the highest kernel length in both years. The highest kernel thickness and width were observed in genotypes T4 and T1 from region three and genotype F19 from region one in both years. Maximum nut weights were 15.59 and 14.79 g in the first and second year, respectively, and in both years, it was related to genotype T4 from region three. The lowest nut weight in the first and second years were observed to be 7.37 and 7.79 g, respectively, and in genotype T6 in region three in both years. The highest shell weight in the first (7.93 g) and second (8.03 g) years were related to genotype T4 from region three. The lowest shell weight in the first year (3.13 g) was observed in genotype T6 from region three and in the second year (3.41 g), it was witnessed in genotype F23 from region one. Kernel weight was variable in the first year from 3.80 g in genotype T6 from region three to 8.09 g in genotype F22 from region one and in the second year from 2.65 g in genotype F16 from region one to 6.94 g in genotype O5 from region two. Results showed that the range of kernel weight in both years varied between 2.65 and 8.09 g; therefore, the highest and lowest kernel weights were observed in genotypes F22 and F16, respectively, both belonging to region one (Tables 4 and 5). Nut weight in 2 years ranged from 7.37 to 15.59 g and kernel weight in 2 years ranged from 2.65 to 8.09 g. The coefficients of variation for nut and kernel weights were.20 and 21.95%, respectively. In the present study, the average kernel percentage of the studied genotypes was 49.26% in the first year and 43.28% in the second year (Table 3). Based on the results of this research, the range of kernel percentage change in most of the genotypes was different and in both years, it was from 27.80% in genotype F16 to 64.97% in genotype F21, both from region one (Tables 4 and 6). The range of changes of shell thickness in genotypes was calculated to be 1.02 and 2.95 mm in both years. The highest values of shell thickness in the first and second years, respectively, were 2.60 and 2.95 mm, which were obtained for genotype F3 from region one and the lowest values in the first (1.02 mm) and second (10. 1 mm) years were obtained for genotype F23 from region one. Based on the obtained results, the highest kernel weight (8.09%), highest kernel percentage (64.97%) and lowest shell thickness (1.02 mm), respectively, were witnessed for genotypes F22, F21 and F23 (all belonging to region 1). The lowest shell thickness in both years was observed for genotype F23 belonging to region one. The highest packing tissue thickness (4.65 and 5.62 mm) and packing tissue weight (60 and 82 g) in both years belonged to genotype B6 from region four and the lowest packing tissue thickness in both years (1.55 and 1.96 mm) belonged to genotype O9 from region two.
Quantitative traits measured in 45 walnut genotypes studied in the second year

Similar letters in each column are not statistically different at 5% level of probability using Duncan multiple range test.
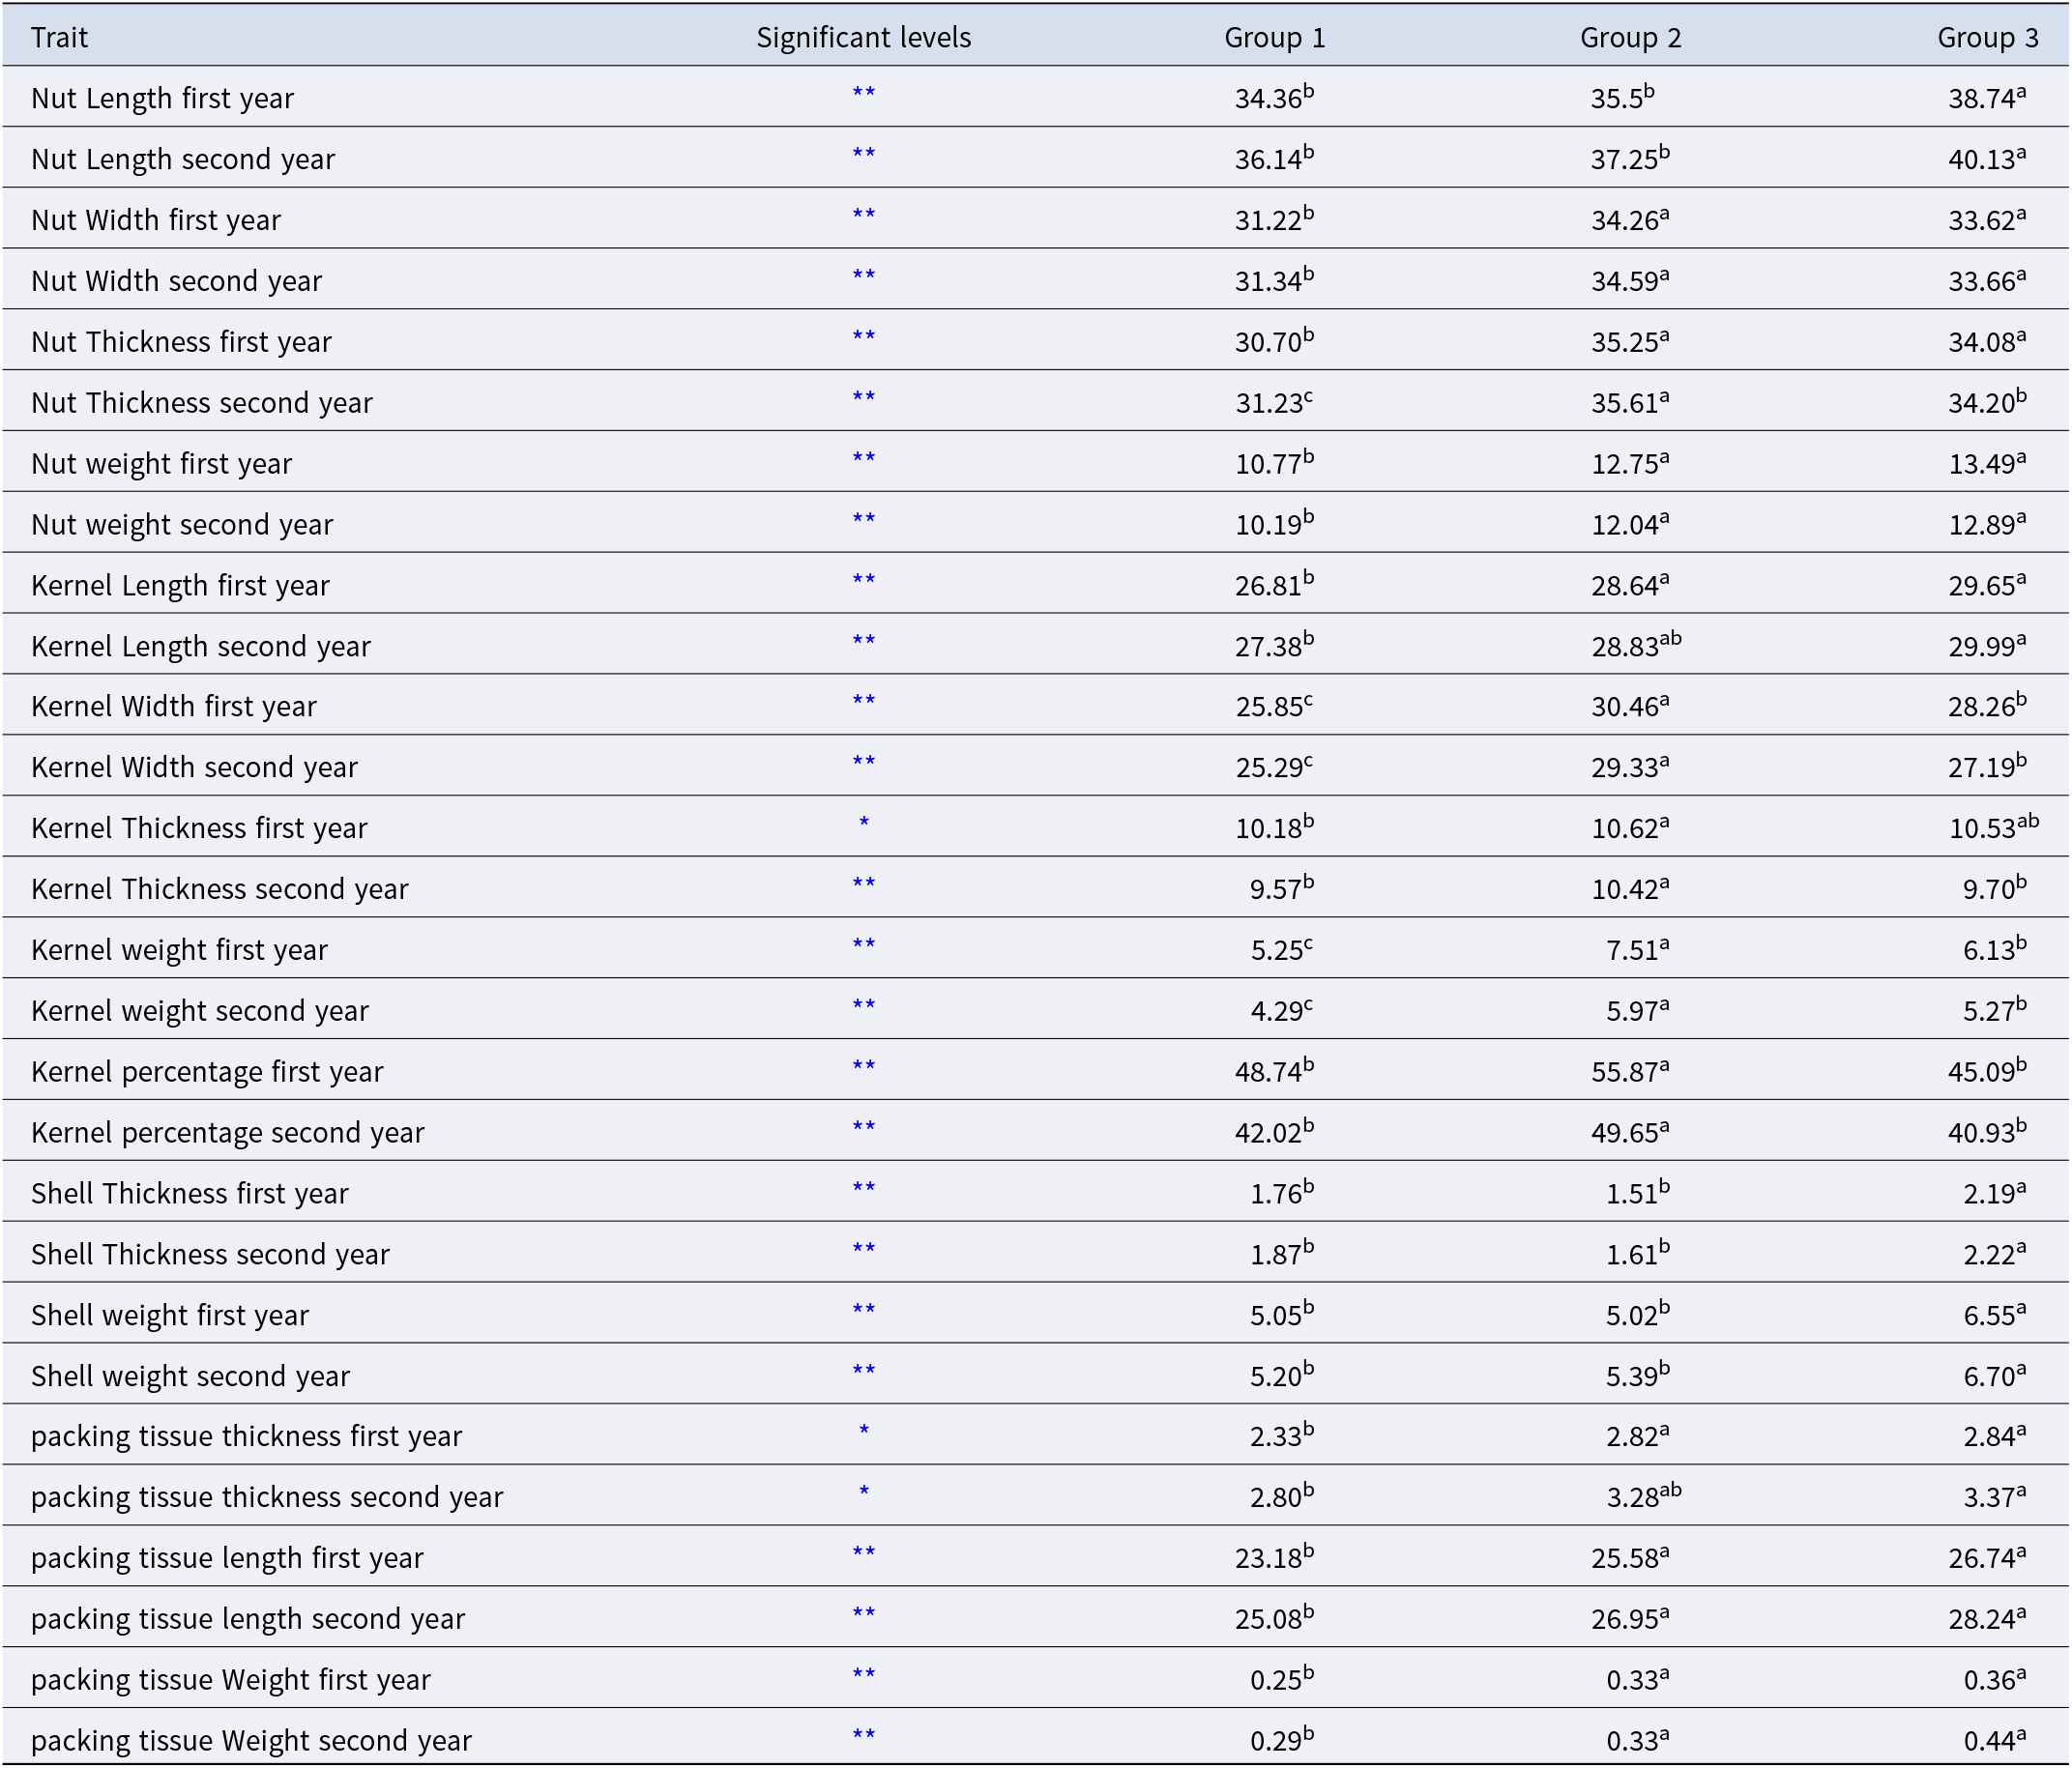
Means comparison of quantitative traits of 45 studied walnut genotypes based on cluster analysis

*, ** According to the significance level in the probability level 5 and 1%.
Quantitative traits measured in 45 walnut genotypes studied in the first year

Similar letters in each column are not statistically different at 5% level of probability using Duncan multiple range test.
Cluster analysis of genotypes based on morphological traits
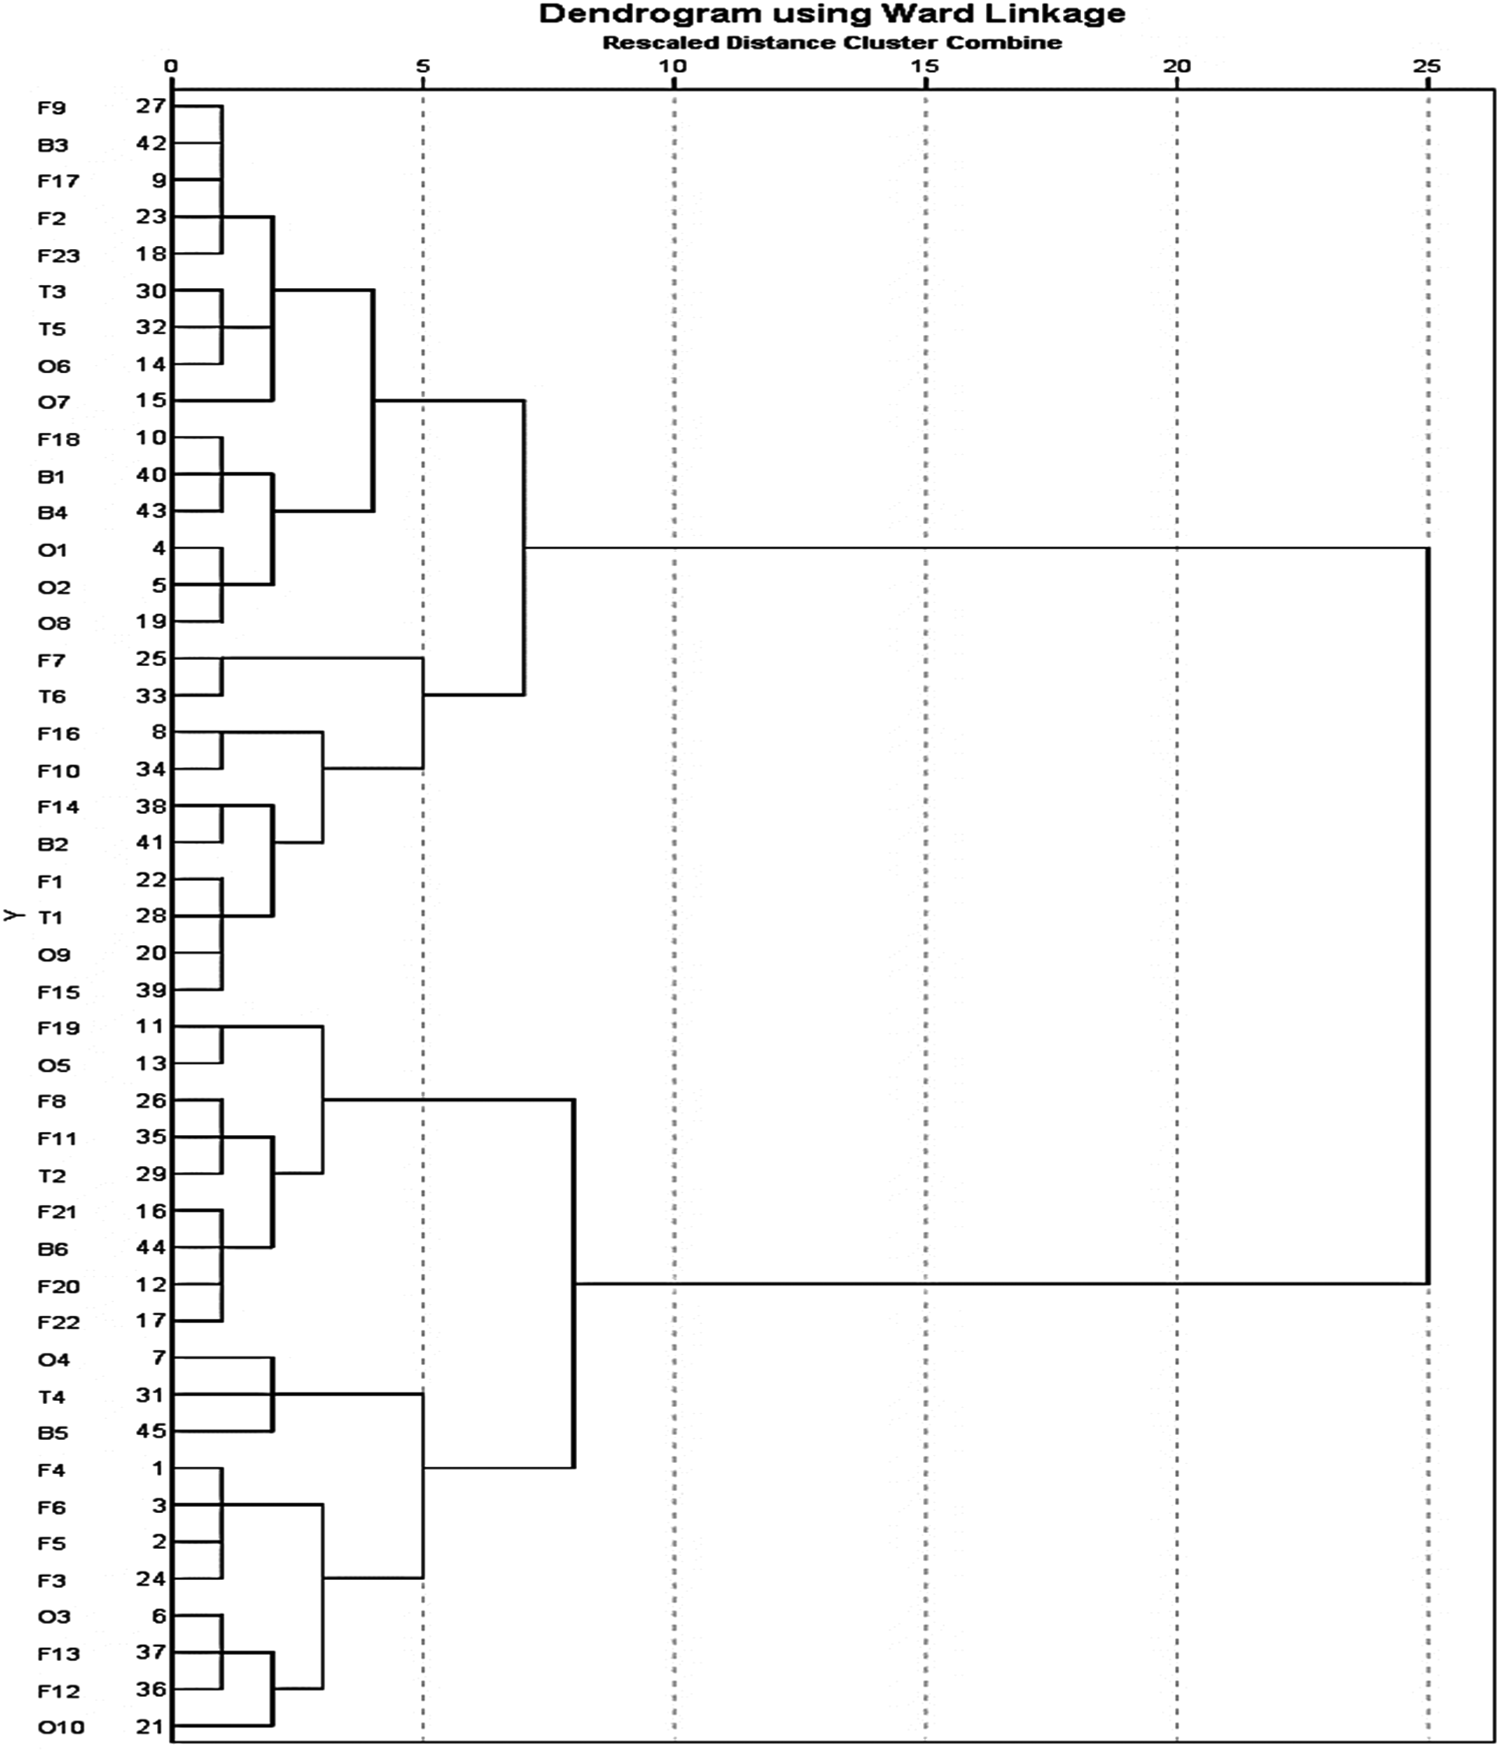
Cluster analysis results based on 14 nut traits in two consecutive years classified the genotypes into three groups (Fig. 2). In the first group, 25 genotypes were clustered, most of which were from region one. The genotypes included in this group in all studied traits, including nut dimensions (length, width and thickness of the nut), kernel dimensions (length, width and thickness of the kernel), kernel weight, kernel percentage, thickness and weight of the shell, as well as thickness, weight and length of the packing tissue, showed the lowest values compared to groups two and three (Table 5). Group one included genotypes from all four regions; i.e. six genotypes from region two (O1-O2-O6-O7-O8-O9), four genotypes from region three (T1-T3-T5-T6), four genotypes from region four (B1-B2-B3-B4) and 11 genotypes from region one (F1-F2-F7-F9-F10-F14-F15-F16-F17-F18-F23) (Fig. 2). The oldest genotype (F2), with an approximate age of 350 years, was clustered together with other old genotypes (F9, T1, B2) in this group. The second group consisted of nine genotypes superior in traits such as width and thickness of nut, nut weight, kernel dimensions (length, width and thickness of the kernel), kernel weight and kernel percentage. Furthermore, these genotypes had lower thickness and weight of the shell compared to the third group, although there was no significant difference in the traits of thickness, length and weight of the packing tissue (Table 5). This group included six genotypes from region one (F8-F11-F19-F20-F21-F22) and three genotypes from other regions (O5-T2-B6). Genotype B6 (with an approximate age of 340 years), genotype T2 (with an approximate age of 320 years) and genotype F8 (with an approximate age of 310 years) were the oldest trees in this group. In the third group, 11 genotypes were clustered. This group included six genotypes from region one (F3-F4-F5-F6-F12-F13), three genotypes from region two (O3-O4-O10) and two genotypes from regions three and four (Fig. 2). The oldest genotype in this group was genotype O10 (with an approximate age of 300 years) belonging to region two. This group was superior to the first group in attributes such as the length, width and weight of the nut, and kernel length, and did not show significant differences with the second group except for nut length (Table 5).
Dendrogram obtained from cluster analysis of 45 studied walnut genotypes using Ward's method based on nut quantitative traits; Cods of B, F, O and T are genotypes belonging to regions Baghestan, Fasaroud, Orjaman and Tul-Zard, respectively.

Molecular analysis with SCoT markers
Based on the obtained results, all used primers produced polymorphism bund in the examined genotypes. Sixteen SCoT primers amplified 166 bands with an average of 10.44 bands per primer; all being polymorphisms. The number of polymorphic bands varied from 2 (SCoT-19) to 19 (SCoT-15). The size of the produced pieces varied from 190 to 3000 bp. The average PIC value in the examined primers was 0.30. The highest amount of PIC (0.36) was obtained for primers SCoT-14 and SCoT-19, and the lowest value (0.21) was obtained for primer SCoT-30. The range of MI in the studied primers was calculated to be from 0.67 to 1.5. The highest MI was obtained for primer SCoT-13 and the lowest value was obtained for primer SCoT-24. Marker resolving power (Rp) was varied from 0.92 in primer SCoT-24 to 7.8 in primer SCoT-13 (online Table 2). AMOVA analysis showed that the percentage of molecular variance among regions was 16% and within areas was 84% (Table S2). From the total of 166 bands produced by 16 primers, 148 bands were amplified into the genotypes of region one, 124 bands were related to genotypes of region two, 95 bands were related to genotypes of region three and 112 bands were related to genotypes of region four. The number of effective alleles was 14 in region one, 13 in region two, 0 in region three and 7 in region four. Genetic distances were calculated for each pair of genotypes to estimate their divergence degree. Based on the results obtained from the similarity matrix, genetic similarity coefficient varied from 0.55 to 0.89. The lowest genetic similarity (0.55) was observed between genotypes O8 and B2. Genotypes F19 and T4 were the most similar genotypes with a similarity coefficient of 0.89.
Molecular cluster analysis
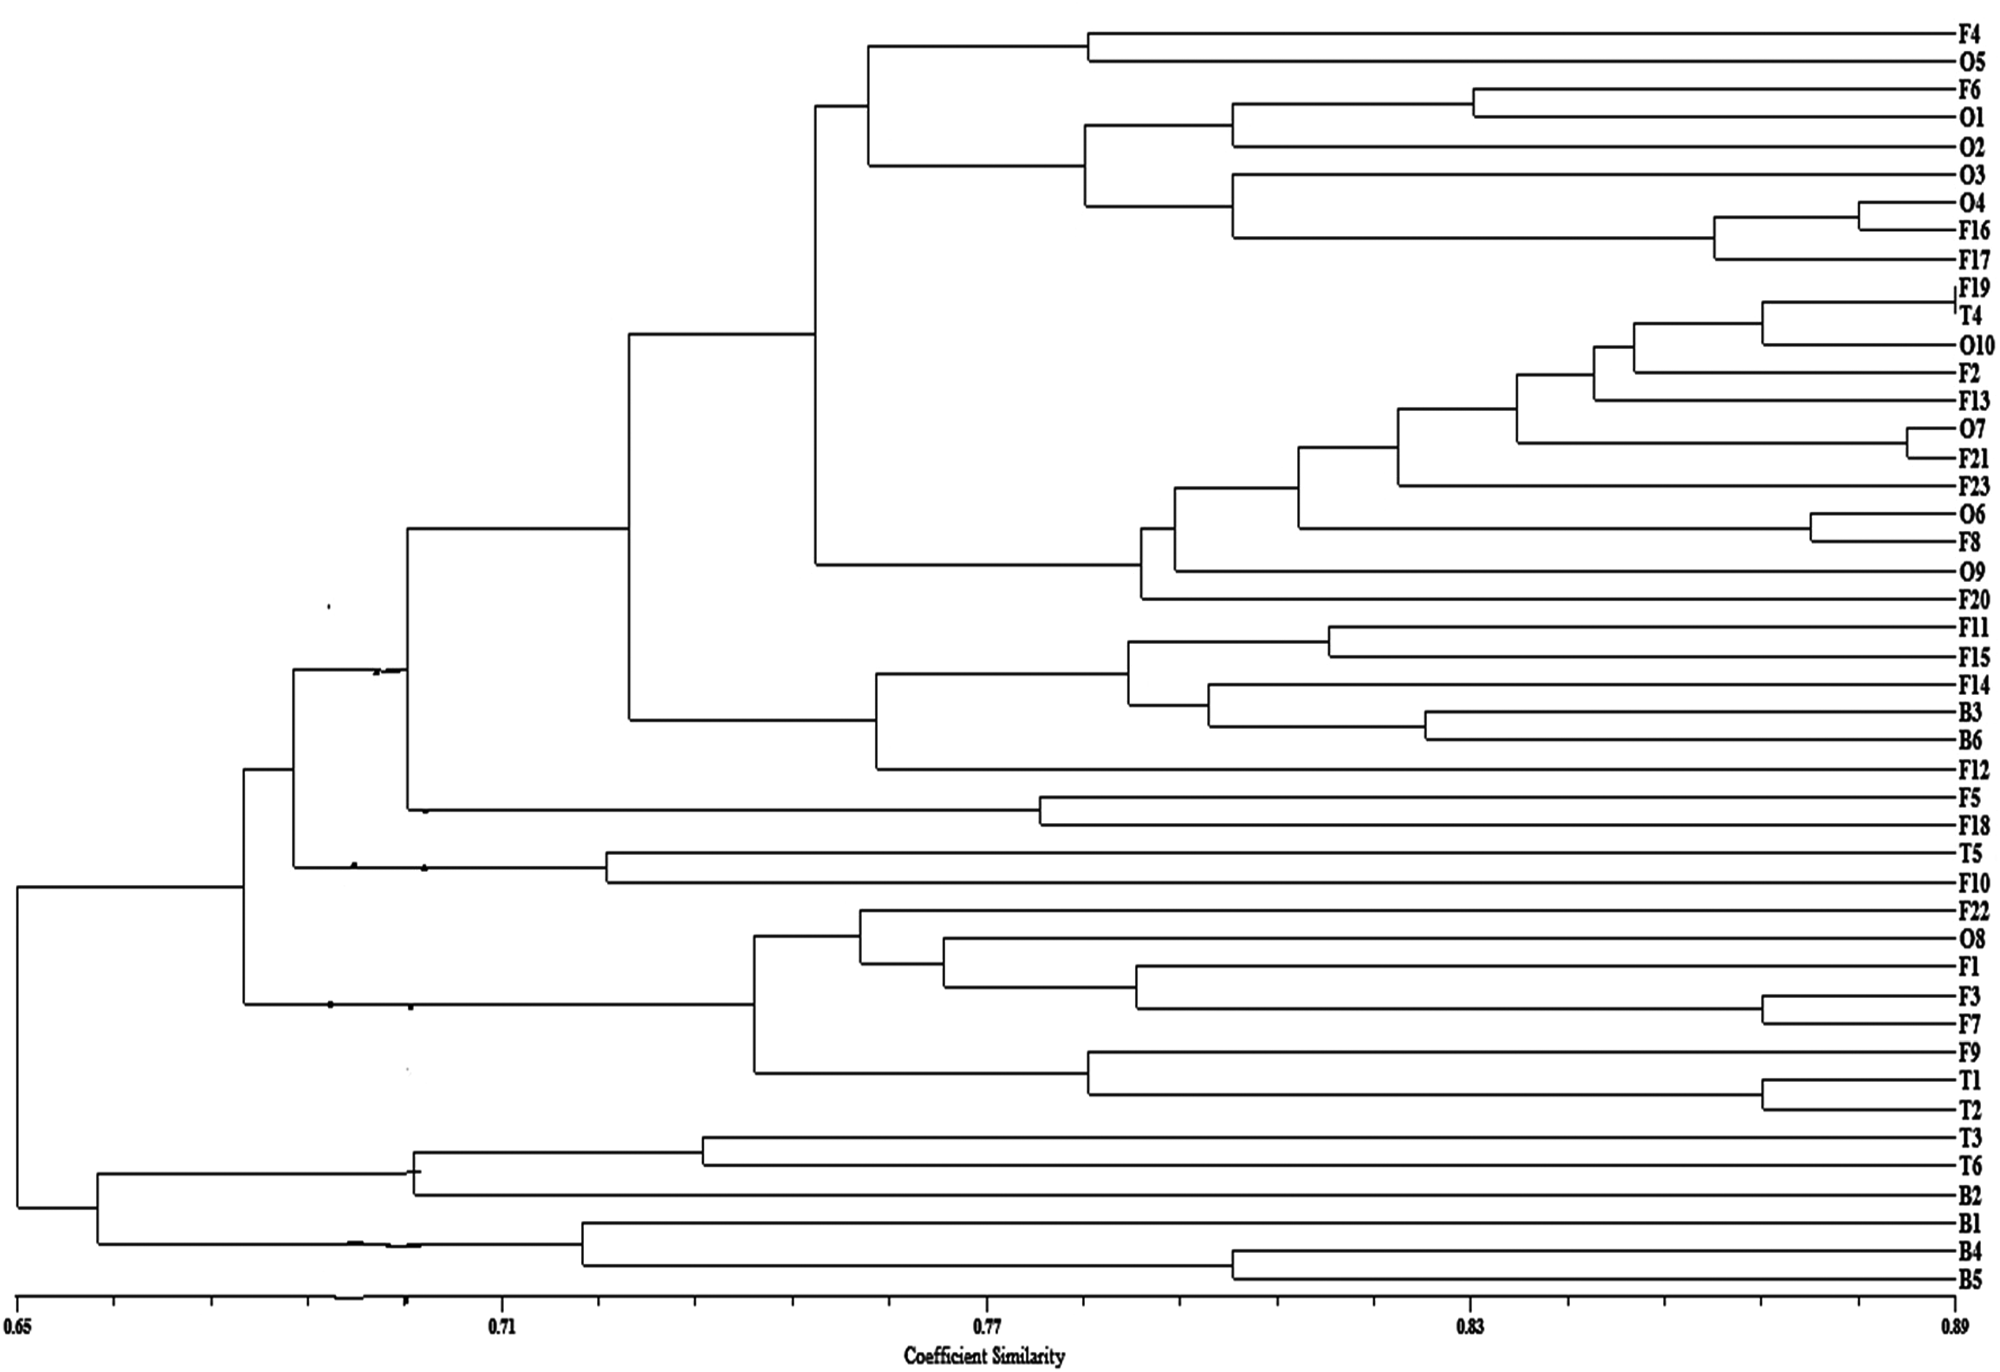
Based on cluster analysis results, a wide variation range was observed among the genotypes. The genotypes were divided into two main groups with 0.65 genetic similarity (Fig. 3). The first group included most of the genotypes from region four along with two genotypes from region three, and the second group was mainly consisted of genotypes from regions one and two. The second group was divided into three sub-classes with 0.69 genetic similarity and the first sub-class mainly included the genotypes of regions one and two and genotypes T1 and T2 from region three. The genotypes of this group were located next to each other in PCoA analysis. Most of the genotypes in this group were the oldest. Genotypes T1 (with an approximate age of 340) and T2 (with an approximate age of 320), as well as genotypes F9 (with an approximate age of 340), T7 (with an approximate age of 310) and F22 (with an approximate age of 300) were clustered together in one group. In general, in the first subclass, genotypes with an age range of 280–340 years were observed. In the second subclass, genotypes T5 from region three and F18 from region one were clustered together and in the third sub-cluster, most of the genotypes of regions one and two were grouped. The oldest genotype in this study, genotype F2 (with approximate age of 350 years) was placed in the third subclass; other old genotypes were also found in this subclass. In the third subclass, genotypes T4 and F19 were observed, which had the highest genetic similarity.
Dendrogram of 45 walnut genotypes based on 16 SCot primers using complete linkage method; Cods of B, F, O and T are genotypes belonging to regions Baghestan, Fasaroud, Orjaman and Tul-Zard, respectively.

Diplot analysis test
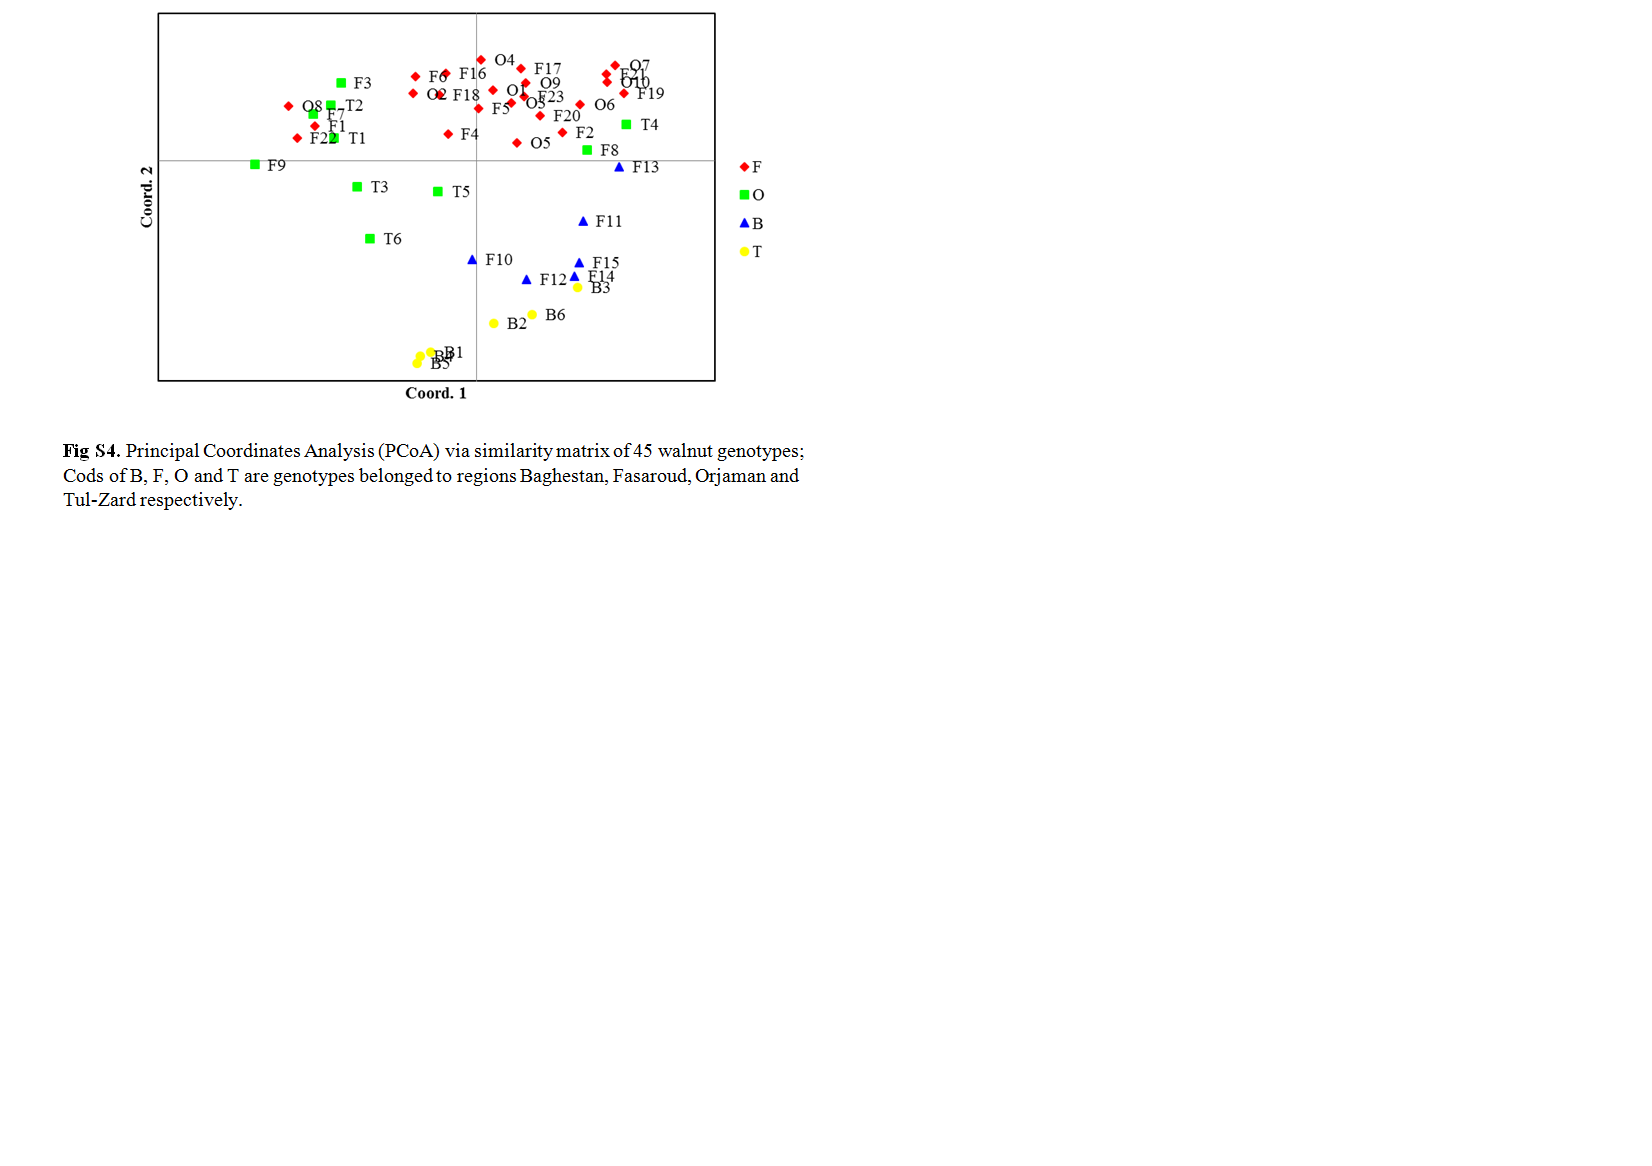
Genetic distance was used to determine PCoA. The two main axes explained 50.31% of the cumulative variance. The first and second main vectors accounted for 27.12 and 23.19% of the total changes, respectively, and were able to divide the 45 walnut genotypes into five groups (online Supplementary Fig. S4). Genotypes that were located close to each other were similar to each other in terms of effective traits in the first and second factors and were placed in the same group. In the first group, some genotypes from three regions including F1, F3, F7, F9 and F22 (region one), O8 (region two), and T1 and T2 (region three) were classified in the same group. In the second group, there were three genotypes of T3, T5 and T6 from region three with the characteristics of kernel percentage above 50% and average shell thickness (1.4–1.9) and genotype T6 had the lowest shell weight among all genotypes in this group. The third group of three genotypes from region four (B1, B4 and B5) were similar in terms of nut and kernel dimensions, as well as some other traits and were therefore classified in the same group. The fourth group included five genotypes from region one (F10, F11, F12, F14 and F15) and three genotypes from region four (B2, B3 and B6), among which genotype B6 had the highest packing tissue thickness and weight among all studied genotypes. In the fifth group, all genotypes of region two except genotypes O8 and 13 from region one and one genotype from region three (T4) were placed next to each other (online Supplementary Fig. S4).
Discussion
The results of previous studies have suggested that quantitative traits, especially kernel and nut characteristics, are considered as more efficient markers for distinguishing walnut genotypes (Arzani et al., Reference Arzani, Mansouri-Ardakan and Vezvaei2008; Fatahi et al., Reference Fatahi, Ebrahimi and Zamani2010). Based on our study, the highest kernel weight was observed in genotype F22 (8.09 g) and the lowest value was obtained for genotype F16 (2.65 g). In a similar study, Ebrahimi et al. (Reference Ebrahimi, Khadivi-Khub, Nosrati and Karimi2015) reported the highest kernel weight of Iranian walnut genotypes to be 8.53 g which was more related to Turkish genotypes compared to the reports of Aslantas (Reference Aslantas2006) (7/37 g) and Akca and Ozongun (Reference Akca and Ozongun2004) (5.81 g). In the present study, the average kernel percentage of the studied genotypes was more than 40% in both years, which were higher than the previous reports (40.53%) of genotypes from other regions of Iran (Mahbodi et al., Reference Mahbodi, Zahedi and Ehteshamnia2017). In the studies performed on walnut genotypes of western Iran (Rashnoodi et al., Reference Rashnoodi, Moghadam and Fazeli2017), the highest kernel percentage was reported as 62.75%, which was less than the value obtained in the present study (64.97%). Also, Sharma and Sharma (Reference Sharma and Sharma2001) reported the percentage of walnut kernels in Himachal Pradesh region as 62.5% and Wang et al. (Reference Wang, Wu, Pan and Pei2015) reported the percentage of walnut kernels in Tibet as 55.4%, which were less than the values obtained in the present study. Today, consumers prefer thin shells, easily removable kernels and high kernel percentages of at least 50% (McGranahan and Leslie, Reference McGranahan, Leslie, Marisa and Byrne2012). The lowest values of shell thickness and also the lowest packing tissue thickness were observed in genotypes F23 and O9, respectively. The presence of a thinner packing tissue makes it easier to remove walnut kernel (Arzani et al., Reference Arzani, Mansouri-Ardakan and Vezvaei2008). Therefore, the F23 and O9 genotypes, which exhibit the lowest shell thickness and packing tissue thickness, can be utilized in walnut breeding programmes.
The results of the molecular data showed that, among the 16 SCoT primers used in this study, primers SCoT-11, SCoT-13, SCoT-14, SCoT-16, SCoT-19 and SCoT-20 exhibited higher efficiency than other primers in investigating the genetic diversity of walnut. Therefore, these primers could be used in genetic diversity, genetic mapping and walnut breeding studies. Based on molecular results the most significant genetic distance was observed between genotype O8 from region two and genotype B2 from region four. These two genotypes were located in two separate regions that were geographically distant from each other. The maximum genetic distance obtained can be used for the application of maximum heterosis in the breeding programme (Bussell, Reference Bussell1999). The most remarkable similarity was observed between genotype F19 from region one with an approximate age of 260 years and genotype T4 from region three with an approximate age of 280 years, which can strengthen the hypothesis that probably the origin of the genotypes of region one was from region three, which may have happened due to the transfer of seeds between the two areas. Such results were consistent with the findings of Ipek et al. (Reference Ipek, Arıkan, Pırlak and Eşitken2019) in Turkey, who reported that genotypes from two separate regions were closely related to each other. Also, the placement of different genotypes with different geographical origins in one group can be due to the seed transfer of desirable genotypes from one region to another by farmers (Belaj et al., Reference Belaj, Munoz-Diez, Baldoni, Satovic and Barranco2010). Based on morphological and molecular cluster analysis results, genotypes F11, F19, F20, F21 and F22 from region one were grouped with F8 (with an approximate age of 310 years) which probably indicated that the origin or offspring of these genotypes was genotype F8. This described the selection of genotype F8 as the best genotype in the past and maintaining it for seeding from the past to present. In the present experiment, SCoT markers could well distinguish walnut genotypes in terms of morphological traits. Such results were consistent with the findings of Mahmoodi et al. (Reference Mahmoodi, Rahmani and Rezaee2013) on walnuts and did not match to the results of Wang et al. (Reference Wang, Wu, Pan and Pei2015) and Ebrahimi et al. (Reference Ebrahimi, Fatahi and Zamani2011). Based on the clustering results of the morphological traits, 60% of the genotypes of region two were placed in one group along with many of the genotypes of region one. Such results were also confirmed with molecular data, indicating the transfer of seeds of desirable genotypes from one area to another by farmers and similar results were reported by Ipek et al. (Reference Ipek, Arıkan, Pırlak and Eşitken2019) for walnut genotypes. Genotypes B1, B4 and B5 were clustered in one group based on the results of molecular cluster analysis, but in the morphological dendrogram, genotypes B1 and B4 were in one group and genotype B5 was in another group which could be due to the multiplication of non-codon regions by SCoT marker, which is not far from expected due to the non-specificity of SCoT marker and randomness of its primers.
Conclusion
Walnut genotypes in our study showed various characteristics in nut and kernel traits and some of these genotypes had desirable traits that can be used as promising genotypes in breeding works or the preparation of scion. Genotypes F21, F23 and O9, which exhibit the highest kernel percentage, the lowest shell thickness and the lowest packing tissue thickness, respectively, were identified as superior genotypes in this study. These genotypes can be utilized in future walnut breeding works. Primers SCoT-11, SCoT-13, SCoT-14, SCoT-16, SCoT-19 and SCoT-20 showed higher efficiency in studying walnut genetic diversity which can be used in investigating genetic diversity, genetic mapping and breeding studies in walnuts. In addition, these old genotypes have had a favourable adaptation to the environmental conditionings in the long term. These genotypes can be valuable sources of resistance genes; therefore, it is necessary to protect them to prevent their genetic erosion. Since the plant material sampled in this research was representative of the walnut germplasm grown in high altitude regions, the results provide important information for germplasm conservation and screening for superior germplasm.
Supplementary material
The supplementary material for this article can be found at https://doi.org/10.1017/S1479262124000583