Introduction
This article addresses some of the most basic questions for group scholars: What is the pattern of group relations with government? What does the group policy map look like? How is it structured? Although we know that contemporary policymaking is characterised by both the proliferation of groups and rising levels of complexity, we are less clear on what this means for the pluralistic nature of governance. How might the structure of the policy map adjust to these dynamics? Here we take on this broad research agenda through a network-based exploration of the British governmental practice of administrative consultations, using Scottish policy consultations as our empirical focus.
Several decades ago, in the United States (US) context, Salisbury et al. (Reference Salisbury, Heinz, Laumann and Nelson1987, 1229) concluded that “Neither research monographs nor beginning texts should continue to talk about the ‘farm bloc’, the dominant role of the American Medical Association, or the unity of “business” interests when events have long since rendered those empirically invalid” (Reference Salisbury, Heinz, Laumann and Nelson1987, 1230). Their basic point was that the contemporary policy map could not be satisfactorily characterised by simple reference to single sector-wide interest groups that have historically been considered to dominate. This begs the following question: what then is the structure of the contemporary policy map?
There is broad agreement that the group system has expanded and policy is increasingly complex. Yet, at least two subtly different – but meaningful – emphases have emerged around how to interpret the impact of these trends on the policy map (see Baumgartner and Leech Reference Baumgartner and Leech1998, 157–162). The first is that the expansion of the group system, through the addition of a diverse range and large numbers of groups, has led to balkanisation as groups seek out discrete and well-partitioned policy niches (Browne Reference Browne1990, 480; Laumann and Knoke Reference Laumann and Knoke1987). In turn, the balkanised policy map is composed of numerous well-partitioned subsystems that are only loosely – if at all – linked to one another. There are few, if any, “central players” that draw together concerns across subdomains (Browne Reference Browne1990, 480). This image fosters the conclusion that the numerical increase in groups has not added up to a more pluralised form of governance. The second version maintains that as the policy system grows there is more overlap between policy domains (and subdomains) because groups scatter their attention widely (Salisbury et al. Reference Salisbury, Heinz, Laumann and Nelson1987; Walker Reference Walker1991; Heinz et al. Reference Heinz, Laumann, Nelson and Salisbury1993). The policy map is fragmented, but partitioning between policy subsystems – aka balkanisation – is rather low. Summarising this perspective, Baumgartner and Leech conclude that US groups monitor broadly; “No broad area of American politics seems to be home to a set of interest groups that are exclusively interested in that area of policy” (Reference Baumgartner and Leech1998, 159).
Although US in nature, this discussion has been highly influential in shaping international scholarly expectations as to how the policy map might look. Not unexpectedly, this kind of debate over how to characterise the policy map has a corollary of sorts in the British literature (indeed, the US debate is cited within the British conversation; see Jordan et al. Reference Jordan, Maloney and McLaughlin1994). As in the US, discussion concerns the impact of a growing group system and policy complexity on the role of central players and the degree of overlap (or balkanisation) between subsectoral policy networks. Although for sound reasons the US discussion has empirically focused upon Washington and congressional lobbying, the United Kingdom (UK) debate has, for similarly sensible reasons, focused on the practice of administrative consultation, referred to as the UK (and Scottish) “policy style” (Jordan and Richardson 1987; Cairney Reference Cairney2008).Footnote 1 Although there may not be too much debate about the contention that consultation is the dominant policy style in British public policy, there is some controversy over how to read the structure of that consultative pattern of engagement by groups with the bureaucracy.
As Greer (2005, 26) observes, agricultural policymaking has been the context for the more general debate regarding the structure of policy networks in British government. In the post-war period, accounts of British agricultural policymaking emphasised a more or less exclusive and “clientelistic” relationship between the Agricultural Ministry (MAFF) and the farm union [National Farmers’ Union (NFU)] (Self and Storing Reference Self and Storing1962). It is generally conceded that from the 1980s onwards this changed. The expansion of the group system and the complexity of policy issues have challenged the adequacy of this simple “partnership” as a characterisation of agricultural policymaking. What constitutes an accurate characterisation of the expanded map that remains is, however, contested. One account suggests that the relationship between the Agricultural Ministry and the NFU retains its status by constituting a “primary” policy network that sets broad policy aims. Other networks involving the increasing cast of farm specialists, nonfarm agricultural interests and nonagricultural interests are “secondary” (see Smith Reference Smith1991, Reference Smith1993; Cavanagh et al. Reference Cavanagh, Marsh and Smith1995). An alternative account argues that the complexity of policy and the administrative fragmentation of the state deliver an “agricultural policy map [that] is congested with detailed and overlapping sub-sectoral policy communities” (Jordan et al. Reference Jordan, Maloney and McLaughlin1994, 507). They do not dispute that the NFU might well retain status at the “core” of agricultural policymaking; rather, they argue that this status comes not from its exclusive participation in a primary network, but from its “participation at the heart of numerous different policy communities rather than the dominant (group) member of a single community” (Jordan et al. Reference Jordan, Maloney and McLaughlin1994, 509, 513).
This UK conversation has not been routinely revisited. However, a recent contribution counsels more empirical work, implying that the “real” policy map might be somewhere between both interpretations. Marsh et al. (Reference Marsh, Toke, Belfrage, Tepe and McGough2009, 635–636, italics added) argue that although the “bottom-up” approach of Jordan et al. is essentially right to emphasise “proliferation of subsectors and thus of policy networks” that “we also need to acknowledge the overlaps between networks and the presence of some groups, we might call them critical groups, in a broad raft of different, but connected, networks”, and that “we also need to acknowledge network overlap, multiple network membership and the presence of particularly powerful, critical, groups across a broad span of policy areas”. In broadly accepting the Jordan et al. (Reference Jordan, Maloney and McLaughlin1994) map, the argument being made here by Marsh et al. is to be attentive to the degree of interlinking of subsectors and to the multiple memberships of “critical groups” across such subsectors.
In summary, whether US or UK in origin,Footnote 2 discussions around how to characterise the contemporary policy map seem to revolve around (at least) two basic questions. The first question concerns whether the policy map is more (or less) balkanised – that is, are policy subsectors becoming increasingly partitioned from one another or are subsectors overlapping with one another? The second question concerns whether there are fewer (or more) “central” players capable of linking subsectors together. Clearly, identifying the relative accuracy of these characterisations of the group policymaking map is an empirical question. Yet, in all the UK discussion, where reference is made to government consultations and group responses as evidence for contending positions, to date no one has actually systematically tested these characterisations against actual data on group responding to consultations. This is a gap we seek to address in this article.
Given that the context for the UK debate is the practice of consultation between government and groups, this article utilises a large data set logging group responses to Scottish Office/Government consultations over a 25-year period. The debate around consultation style is clearly relevant to the Scottish level. Although the literature on the UK policy style cited above assumes equivalence with Scottish Office practices, the post-devolution Scottish politics literature anticipates some differences. For instance, some have argued that “Factors such as Scotland’s size, and the Scottish Government’s limited policy-making capacity, have produced a ‘Scottish Policy Style’, in which groups and government interact in distinctive ways” (Cairney Reference Cairney2014, 303; see also Cairney Reference Cairney2011). Although there is reference to difference, this is not considered to be a sharp break, with authors suggesting some continuity with predevolution policy styles: “There is an important degree of path dependence and continuity in group-government relationships, since the most devolved areas, such as education and health, were devolved administratively before 1999” (Cairney Reference Cairney2014, 304). This article contributes another dimension to advancing this important scholarly discussion about UK and Scottish policy styles, through the unique perspective offered by systematic quantitative network analysis.
This article leverages the tools and methods of network analysis in addressing these debates about the structure of inter-relationships between policy spaces and groups in the Scottish policy system. Network analysis is well suited to assessing (a) how linked up or independent policy subsectors are across the consultative system over time, and (b) the extent to which key groups implicated in existing accounts of the British and Scottish policy style of consultation are, were and continue to be “central” agents. It is to these questions the article directs its focus.
The article proceeds in several sections. The first section develops a set of expectations/hypotheses. The second section outlines the data source, the measures we will use to operationalise key concepts and the way we generate network data. The subsequent section provides an overview of our results, whereas the final section offers interpretations of our results against the stated hypothesis and points to areas for more work.
Scholarly expectations
Against the discussion above, it is possible to parse out several distinct dimensions of the US and UK scholarly discussion that might be tested empirically in the Scottish context. The first concerns claims about the level of balkanisation (versus overlap) between policy subsectors. The second relates to the prevalence (or otherwise) of central groups.
Balkanisation of policy sectors?
The first set of scholarly expectations concerns the broad structure of the contemporary policy map. Scholars have long debated the extent of pluralism evident in policymaking. Some assume that large and fluid group systems imply pluralistic competition, whereas others argue that this claim is undermined through the partitioning of policy spaces into self-contained policy niches.
It is almost universally accepted that there is an increase in the volume of groups active in public policy and that the complexity of policymaking is rising. In the UK context, it has been argued that these conditions necessarily lead to the expansion of the number of policy subsectors (Marsh et al. Reference Marsh, Toke, Belfrage, Tepe and McGough2009, 624). Of course, the existence of more subsectoral policy networks does not in and of itself tell us whether this is fragmentation with overlap, on the one hand, or fragmentation with partitioning, on the other. The latter is indicative of high levels of balkanisation. Conclusions regarding the extent of pluralised governance depend in part on the degree to which these subsectors are (more or less) partitioned. In the US context, some emphasise incentives for groups to specialise in narrow policy niches, and to avoid policy competition where possible. This leads to a policy map composed of well-partitioned subsectors with few links between them (Laumann and Knoke Reference Laumann and Knoke1987; Browne Reference Browne1990; Gray and Lowery Reference Gray and Lowery1996). Others, while accepting these incentives for niche seeking, suggest “even more powerful incentives exist for groups to spread their gaze widely, to monitor a number of policy areas within government, to be active in many areas, to avoid reliance only on a key set of contacts within the government and to accumulate a broad range of contacts” (Baumgartner and Leech Reference Baumgartner and Leech1998, 161–162). The policy map is thus one of the overlapping niches with little partitioning – that is, low balkanisation. In the UK, most work emphasises increasing overlaps over time. For instance, Marsh et al. (Reference Marsh, Toke, Belfrage, Tepe and McGough2009, 635) argue the “need to acknowledge the overlaps between networks”, whereas Jordan et al. (Reference Jordan, Maloney and McLaughlin1994, 507) suggest that policymaking is characterised by “overlapping subsectoral policy communities”. Given the mixed nature of expectations in terms of more or less balkanisation, we take the Jordan et al. (Reference Jordan, Maloney and McLaughlin1994) line as our point of departure delivering the following hypothesis:
H1: The policy map has become less balkanised over time.
Central groups
A second aspect of the debate around the changing nature of the group policy map – and hence the prospects for pluralistic governance – is the role that is played by “central” actors (Browne Reference Browne1990, 480). This refers to groups that would link together subdomains/sectors within a policy domain/sector and in so doing presumably ensure that policy conversations were shared and linked across the domain/sector.
This is also a strong feature of the UK discussion, particularly with respect to the case of agriculture. Here Jordan et al. do not reject the idea that the NFU is at the “core” of agricultural policymaking, but that its importance would come from its “participation at the heart of numerous different policy communities rather than the dominant (group) member of a single community” (Reference Jordan, Maloney and McLaughlin1994, 509, 513). A similar line is developed in respect of the Scottish experience (Jordan and Halpin Reference Jordan and Halpin2006). In other words, its importance lies in linking subsectors together. Moreover, it has been argued most recently that attention be paid to “critical groups” who are present “across a broad span of policy areas” (Marsh et al. Reference Marsh, Toke, Belfrage, Tepe and McGough2009, 635–636). Thus, it is noteworthy to assess the extent to which the “central” nature of such actors is actually evident across subsectors.
In the end, it is an empirical question, but the tone of the scholarly contributions thus far suggests that there is likely to be relatively fewer such “central” groups over time. As the system expands, we might find more central groups in absolute terms, but in relative terms these groups are fewer in number. Thus, we identify the following hypotheses to explore:
H2a: There are (relatively) fewer “central” groups over time.
H2b: Those “central” groups that are evident are themselves becoming (relatively) less central over time.
Data, approach and measures
Data source
As discussed above, the UK debate about the precise complexion of the policy map has frequently cited the practice of routine administrative consultations in making its case. Curiously, no one, to our knowledge, has actually mapped this practice to assist in resolving disputes. This is no doubt in part because consultation is a broad term, which might include informal and thus un-documentable group contacts with the administration (Jordan and Richardson 1987). However, the more formal – and countable – end of the consultation spectrum, which we examine here, is frequently cited in the debate over characterising the British policy style (Jordan et al. Reference Jordan, Maloney and McLaughlin1994, 524).
In this article, we utilise a large data set compiled from records of policy consultations launched by the Scottish Office (1982–1999) and Scottish Government (1999–2007). It is important to recognise that, as part of a broader process of UK devolution, Scotland was granted its own Scottish Parliament and Scottish Executive in 1999 and, with that, responsibility for some issue areas (so-called “devolved matters”). The UK parliament and government retain responsibility for so-called “reserved matters”. Devolved matters include health and social work; education and training; local government and housing; justice and police; agriculture, forestry and fisheries; environment; tourism, sport and heritage; and economic development and internal transport.Footnote 3 Our decision to focus on administrative consultations was based on the nature of the British – and Scottish – political system, which means that the bureaucratic avenue is likely to be the most frequently deployed, the most open and accessible and the most productive for interest groups (see Jordan and Maloney Reference Jordan and Maloney2001, 44).Footnote 4 Thus, the consultation process provides an important window into policy mobilisation by groups. We are concerned with the question of engagement, and not with influence.
In the UK, public policy consultations are routinely conducted on a broad range of issues, which may include calls for comments on draft bills, initial agendas for discussion, proposals for amendments to regulations, the details of implementation of EU directives or similar. Indeed, as mentioned above, such processes have been referred to as both the British and Scottish “policy style”. Precisely how decisive these exercises are for the final policy outcome is not clear. Evidence from several interviews with civil servants in Scotland suggests that new insights and information arise from such exercises: there are sometimes surprises. Moreover, a survey of groups mobilising suggests that 76.7% of groups (n=360) engage in consultations very or fairly often.Footnote 5 Of course, there remains some skepticism. Indeed, participants interviewed by one of the authors openly admit that they are not always clear on how important their participation is, or if it always matters (see also Beales et al. 2012). Yet, resolving this particular question is not critical for the present analysis: it is not a study of influence, and our justification for using these data is simply that they provide a convenient window for assessing the map of group engagement in policy (one regularly cited by protagonists offering varied characterisations of the UK policy map).
The consultations data set is able to plot responses over time by all types of actors (institutions, interest groups, government departments/agencies, and ministers or legislators). In total, the data set includes 1,657 consultations, which received over 80,000 responses from more than 18,000 discrete policy actors. However, in this article, we focus only on interest groups, defined as collective organisations for which political advocacy is an important facet of its activity (Jordan et al. 2004). We do so because the debate about policymaking in Britain has revolved around groups. Thus, the data set analysed here covers 1,591 consultations, which received 28,976 responses from 6,017 interest groups. Given the sheer volume of data, we have not been able to code mergers, name changes and such like. This means that where some groups have changed names within a time period we will underestimate their activity.
This data set was compiled largely using paper-based records held in the Scottish government library and its document storage facility in Edinburgh, but with the addition of some more recent documentation only available electronically on the publications pages of the Scottish government web site. No definitive list of consultations conducted by the Scottish government exists;Footnote 6 we can therefore definitively say that we mapped each and every consultation in which data are available in the public domain, and our data set is as comprehensive as it can ever be. Criticism has been made in the past over using consultation invitation lists as data – mostly on the basis that access to lists is very open (see Cavanagh et al. Reference Cavanagh, Marsh and Smith1995). In these data, we only map actors who actually responded to policy consultations.
Network approach
The tools of network analysis are ideally suited to unpacking the structure of (co)responses of interest group to government consultations. Specifically, the tools of network analysis seem particularly amenable to assessing levels of policy balkanisation and identifying the existence of “central players”. In developing our approach here, we take inspiration from recent US political science work on lobby disclosure data (LaPira et al. Reference LaPira, Thomas and Baumgartner2009), amicus curiae data (Box-Steffensmeier and Christenson Reference Box-Steffensmeier and Christenson2014) and broader use of such tools in the group field (Grossman Reference Grossman2012; Heaney and Lorenz Reference Heaney and Lorenz2013; Heaney Reference Heaney2014).
In network terms, the consultation responses allow us to construct an affiliation network, because while our co-respondents to consultations may have colluded or agreed to jointly respond, this is not a requirement. Moreover, it does not differentiate groups from different sides of the argument – we only note that they co-responded to a consultation. This is in contrast to other data sets used to study group mobilisation, such as Amicus Briefs (Box-Steffensmeier and Christenson Reference Box-Steffensmeier and Christenson2014). In this respect, the data have more similarities to Lobby Disclosure Data (see LaPira et al. Reference LaPira, Thomas and Baumgartner2009). Another important facet of our data to acknowledge is that they are derived directly from real policy activity. It is worth noting that some of the key early US work in this area (which we reviewed at the outset of the article) typically utilised survey data asking groups to nominate either policy domains of interest (Walker Reference Walker1991) or other groups they worked with (Browne Reference Browne1990), in order to deduce links between policy areas and among groups.Footnote 7 We have different types of data. As Box-Steffensmeier and Christenson (Reference Box-Steffensmeier and Christenson2014, 1) put it, the consultation data we have “occurs naturally in the function of government activity”.
Measures and key terms
Policy system, sectors and subsectors
In the US tradition, there are distinctions made between the policy “system”, “domain” and “subdomain”, each of which is populated by a basic unit, the “policy issue” (see Browne Reference Browne1990, 482). Here we use policy system, sector and subsector to reflect more closely the UK parlance. We refer to all Scottish consultations together as a “system” level of analysis. To identify which policy sector a consultation belongs to, we applied a UK Policy Agendas major topic and subtopic code, based on the subject matter of each consultation.Footnote 8 We considered each major topic code – agriculture, health, education, environment and so on – as constituting a unique policy sector/domain and each subtopic code as a unique policy subsector/subdomain.
The advantages of this coding process are threefold. First, we are using an established and respected method for coding government policy. Second, the use of this code frame makes this and other policy agendas projects data sources easily comparable (for a review, see John Reference John2006). Third, it overcomes a major problem with the only other viable coding alternative, departmental structures – namely that such structures frequently change boundaries over time.
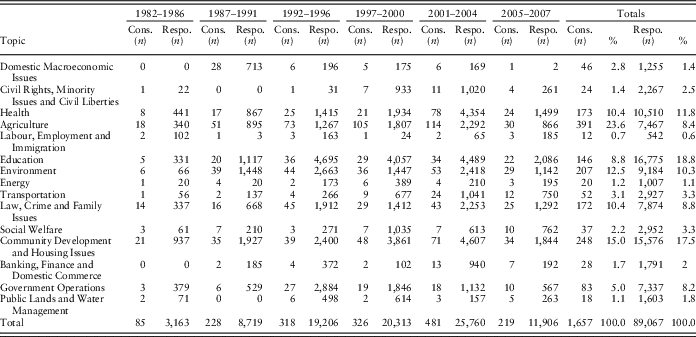
Table 1 reports the frequency of consultations across policy sectors. As is evident, consultations were conducted in 15 policy areas, which were far more concentrated in the areas of agriculture, health, education, housing and crime.Footnote 9 This broadly reflects those policy areas in which the Scottish administration has primary legislative powers.
Frequency of consultations (Cons.) and responses (Respo.) by topic, by United Kingdom time periods
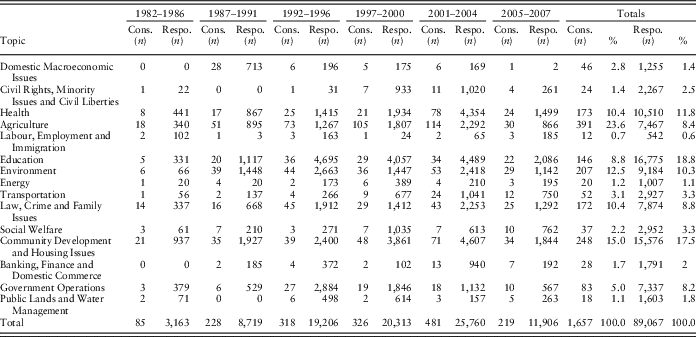
Note: Responses include all types of policy actors. Analysis in this article, however, only includes interest groups.
Respondent and subtopic networks
Our analysis utilises networks constructed in the following way. Our starting point is a two-mode network of respondents and consultations constructed for each period, where a directed edge from respondent i to consultation j indicates that respondent i made a submission to consultation j.Footnote 10 We construct the respondent network as a one-mode projection of the two-mode network, where the nodes are the groups (respondents), and an undirected edge between two groups indicates the number of common consultations they responded to.
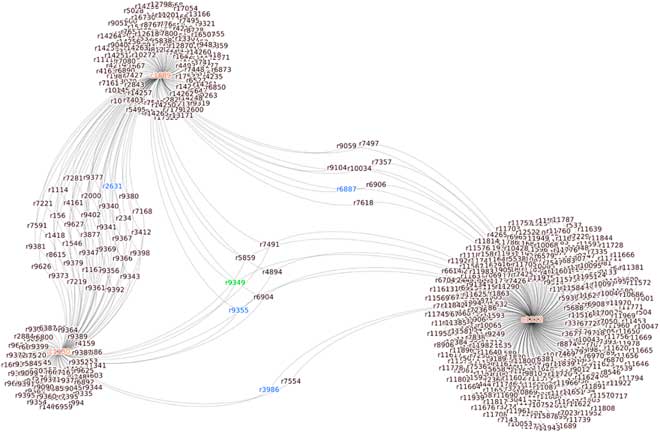
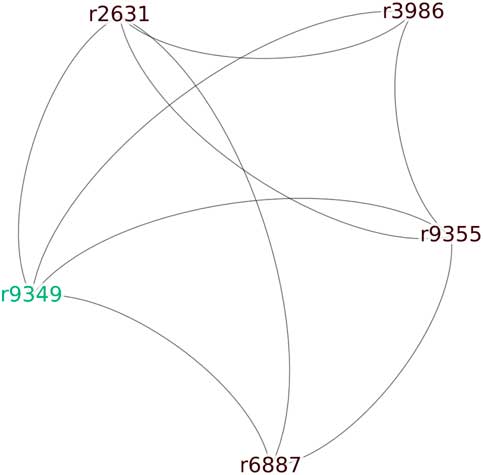
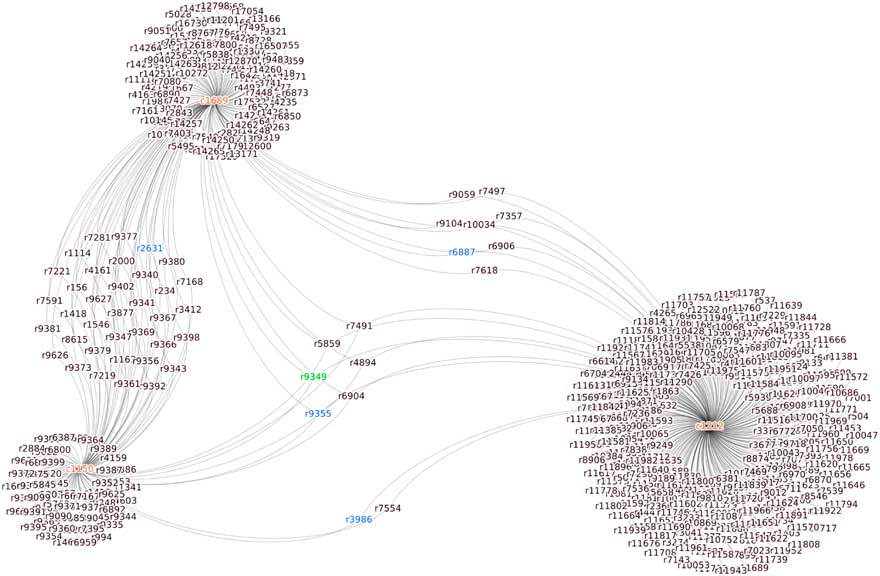
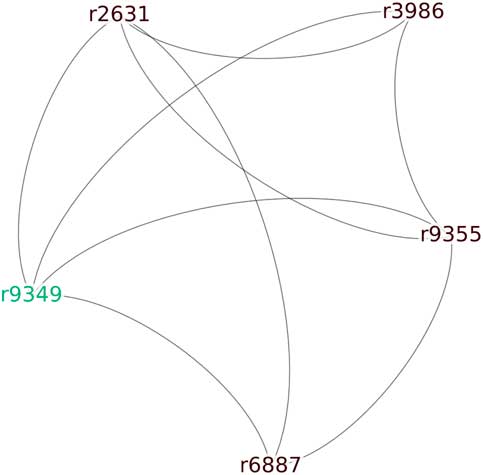
To illustrate the construction of the respondent network, Figure 1 shows a subnetwork extracted from the two-mode network for 2001–2004. To construct this network, we first found the consultations responded to by an example respondent, the Friends of the Ochils (respondent r9349 – green in the figure) – these are consultations c1150, c1212 and c1689 (in red). We then found all the other respondents who responded to these three consultations. Figure 2 shows the respondent network constructed from the subnetwork in Figure 1, but for ease of visualisation only five respondents are shown: Friends of the Ochils (r9349) and four other respondents shown in blue in Figure 1. We explored the use of the Jaccard similarity index to provide a threshold minimum number of common consultations that was required for an edge to exist between two groups; however, this proved problematic (see Online Supplementary Material for details).
Subnetwork extracted from the two-mode (respondent and consultation) network, 2001–2004.
Respondent network constructed from the two-mode subnetwork.
To construct the subtopic network, we first modify the two-mode network (respondents and consultations) by merging consultation nodes that belong to the same policy subtopic, thus constructing a two-mode network of respondents and subtopics where a directed edge from respondent i to subtopic j indicates that respondent i made a submission to consultation in policy subtopic j. The subtopic network is the one-mode projection of this two-mode network, where the nodes are policy subtopics and an edge between two subtopics indicates the number of respondents who responded to at least one consultation from each of these subtopic areas. For consistency with the process used for constructing the respondent network, we also did not use the Jaccard similarity index in the construction of the subtopic network.
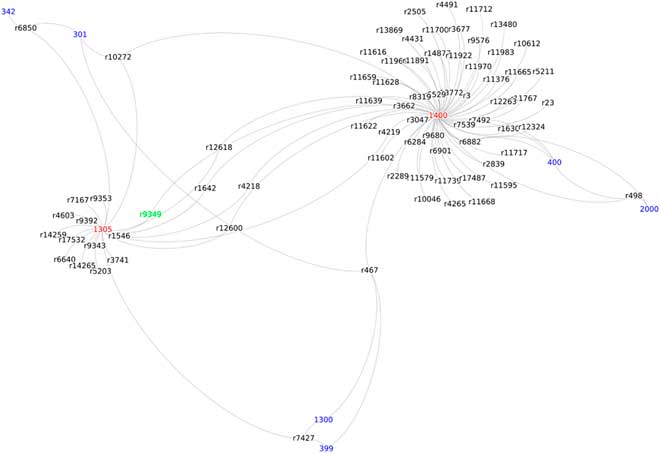
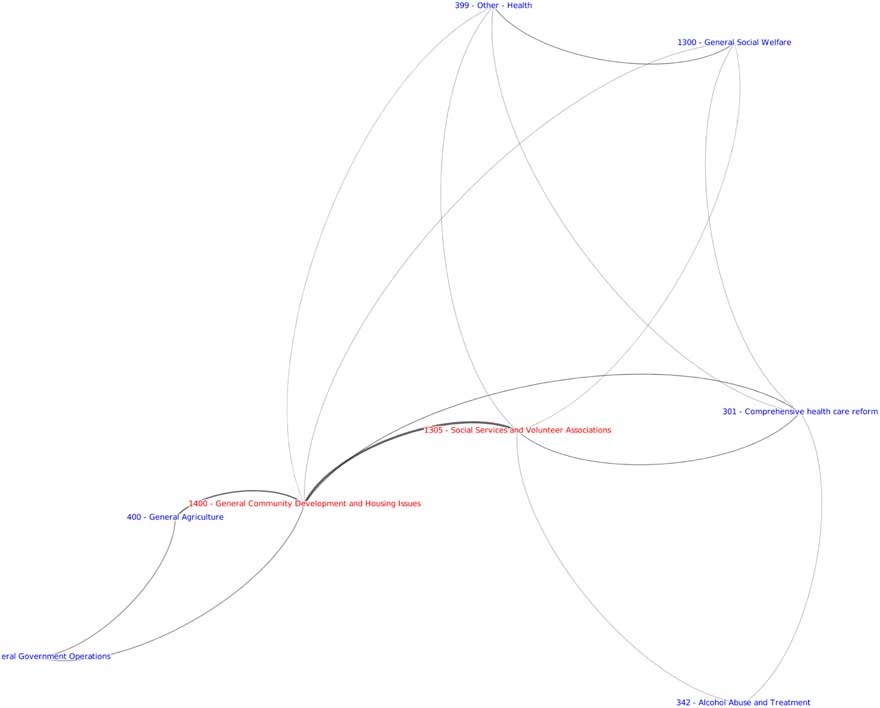
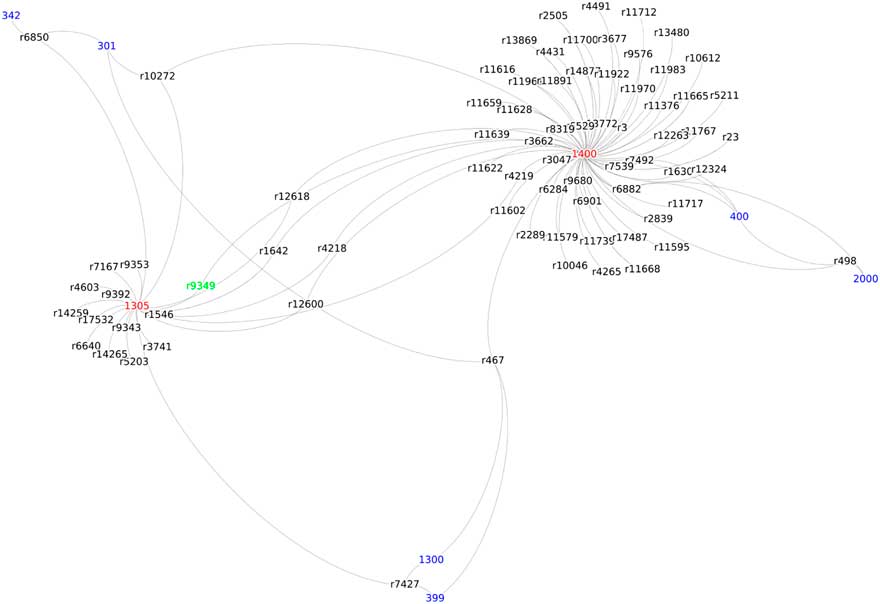
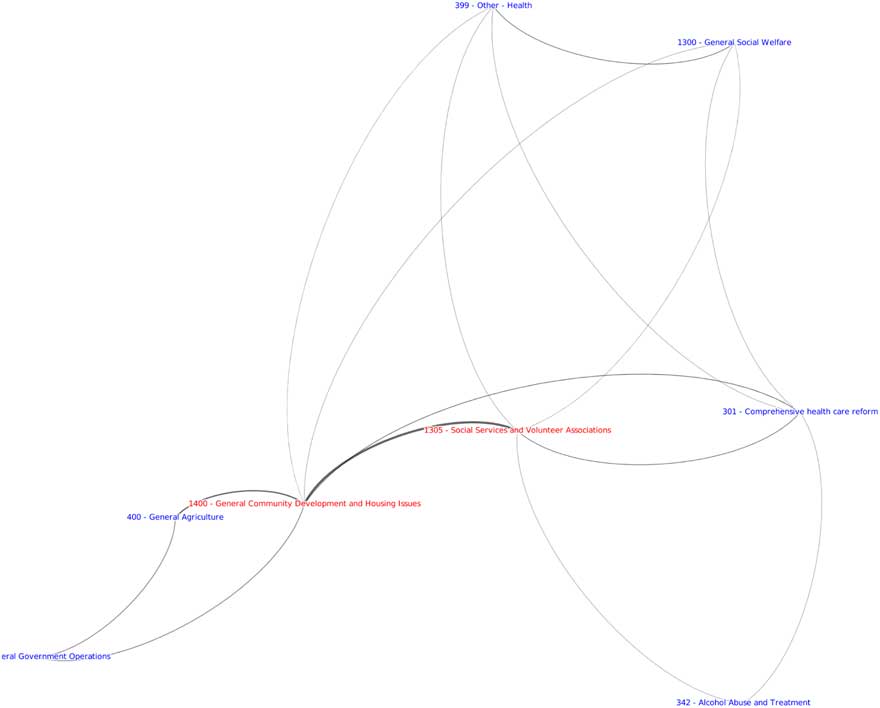
To illustrate the construction of the subtopic network, Figure 3 is an example two-mode network containing the Friends of the Ochils (r9349, in green) and the two subtopics (amounting to three consultations) that this group responded to (with codes 1305 and 1400, in red). Also shown is a sample of additional subtopics (in blue) and respondents (in black); sampling was necessary to make the visualisation easier to comprehend. Figure 4 is the subtopic network constructed from the network in Figure 3.
Subnetwork extracted from the two-mode (respondent and subtopic) network, 2001–2004.
Subtopic network constructed from the two-mode subnetwork.
Balkanisation
We conceptualise the level of balkanisation as the extent to which subsystems are (more or less) partitioned off from one another. Put another way, high partitioning between policy subsectors means high balkanisation. This type of question has typically been assessed in the literature by measuring the overlap of “interest” by groups across different policy domains/sectors. For instance, Walker (Reference Walker1991) asked groups how many policy domains they were interested in to assess how much overlap in policy engagement there is among group (see review by Baumgartner and Leech Reference Baumgartner and Leech1998, 160–161). Here we utilise data derived from co-responding among interest groups to consultations as a more direct measure of the same basic concern.
To assess balkanisation, we utilise measures derived from our subtopic network. There are many network properties that are commonly reported, and it is not always easy to assess how they may (or may not) tap concepts already in use by political scientists. To operationalise our concept of balkanisation, we have chosen to focus attention on two measures. First, the E-I (external-internal) index is computed for each set or grouping of nodes that share a common attribute and ranges from −1 (nodes in the set only connect to other nodes in the same set) to 1 (nodes in the set only connect to nodes outside of the set). Our second measure of balkanisation is network modularity (see, e.g., Newman Reference Newman2006), which assesses the strength of the division of a network into “communities”, clusters or modules, and indicates the proportion of edges that occur within clusters. The closer the value is to 0, the more the linking is occurring between clusters than within clusters, whereas a modularity score of 1 means that there is perfect division between the clusters (no inter-cluster linking). We identified communities or clusters using the Walktrap algorithm of Pons and Lataby (Reference Pons and Lataby2005).Footnote 11 Of course, by definition, the nodes within communities are linked strongly internally, but that does not mean there are no links between communities. Modularity gets at this inter-community relationship, which is one important dimension of the balkanisation idea. In terms of direction, we suggest that increasing modularity equates to increasing balkanisation.
Central groups
As discussed above, the existence of so-called “central players” is widely debated. The concept can be operationalised empirically in several ways (see Halpin and Thomas Reference Halpin and Thomas2012 for discussion of similar measures applied at the aggregate level). We might present a simple frequency-based measure: say something like “issue count” calculated at the policy sector/domain and policy system level as the percentage of all consultation issues responded to in policy topic, by time period. Alternatively, we could calculate a “sector/domain count”, calculated as the number of topics a group is active in. Here we opt for two different measures.
First, we calculate betweenness centrality in the respondent network, which measures the extent to which the node plays a “bridging” role, and is calculated for a given node i by summing up the proportion of minimum paths between all other pairs of nodes that pass through node i. Groups with high betweenness centrality link together sets of groups that otherwise would be separate from one another (i.e. not engage in consultations together). Betweenness centrality is a node-level metric, and the corresponding network-level metric is betweenness centralisation, which measures the distribution of betweenness centrality among actors in a given network. We propose that by calculating betweenness centralisation for the different time periods, we can see how the important role of connecting groups from different policy areas is being shared across the network. Specifically, we suggest that falling betweenness centralisation points to declining importance of central players in the policy network.
Second, we develop a measure that we call relative centrality. This is calculated for each of our “central groups” and is simply the ratio between betweenness centrality for each central group and mean betweenness centrality for the entire network.
Findings
We report our findings in the order of our expectations/hypotheses outlined earlier. We first consider balkanisation, and then the central groups.
Is there evidence of policy balkanisation?
As discussed above, one of the key questions debated in the UK – and US – concerns the degree to which the policy map has become more balkanised over time. That is, more partitioning between subsectoral policy networks.
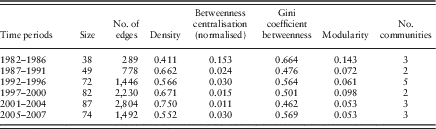
Our initial approach to assessing whether this characterisation is evident in Scottish public policy consultations used the subtopic network described above. We find no clear patterns in terms of the number of communities in our data (Table 2). This is perhaps not surprising in this particular network, because the subtopics are predefined by the researchers, and thus are to some extent reliant on the distribution of consultations across topics for the same clusters to (re)emerge in successive time periods. For the extent of policy balkanisation to be decreasing over time, we would expect to see network modularity trending downwards, and indeed we do see this for the first three periods (1982–1985, 1987–1991 and 1992–1996) and again for the final two periods (2001–2004 and 2005–2007). This means, we suggest, that over the period 1982–1996 the links between subsectors in our data were increasing. While we report betweenness centralisation for the subtopic networks for completeness, we do not see it as immediately relevant for the question of balkanisation.
Network-level properties of the subtopic network
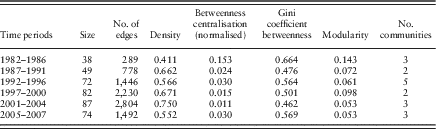
Some caution needs to be exercised in the interpretation of our modularity measure. As the size and density of the subtopic network is changing over time, this will have an impact on the measured modularity regardless or independent of any “real” rise associated with balkanisation. Therefore, it is hard to say that the observed decrease in modularity is a clear indication of declining levels of balkanisation, or whether it may instead be reflecting changes in network size.
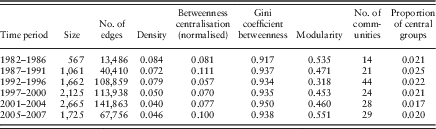
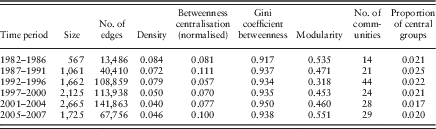
A second way to address the question of levels of balkanisation over time is to examine our respondent network. Recall that this network utilises individual groups as nodes, with the edges indicating the number of consultations that they jointly responded to. Here we find a slightly different story (Table 3). Except for a jump in 1992–1996, we observe a stable number of communities in the respondent network. This suggests overall stability in the number of discrete policy subsectors over time. Similarly, in terms of modularity, we find no clear trend, suggesting no major change in balkanisation over time.
Network-level properties of respondent network
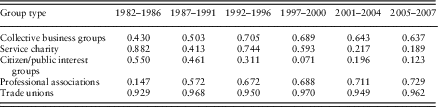
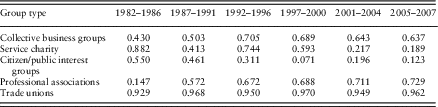
As a final way of measuring balkanisation, we computed the E-I index for each interest group type (charity, professional association, trade union and so on) in the respondent network (Table 4), with the index having theoretical limits of −1 (all ties are between respondents of same interest group type) to 1 (all ties are with respondents outside of the group type). The E-I index for particular groups reveals some interesting temporal patterns. For example, trade unions have consistently exhibited very low levels of balkanisation (the E-I index was over 0.9 in all periods). Professional associations have progressively become more balkanised, whereas the reverse is true of citizen/public interest groups and service charities. There was some evidence that business groups became increasingly balkanised in their tie formation over time, and this was particularly the case during the middle terms (1992–1996 and 1997–2000).
E-I index by group type and period
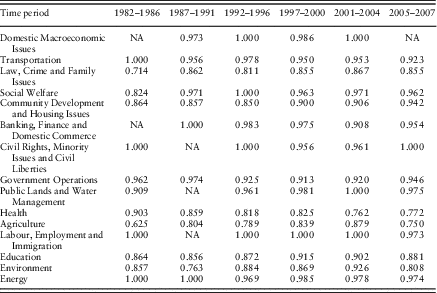
What about the subtopic network? Table 5 provides the E-I index constructed for the policy topic areas in the subtopic network, over time. Overall, what is notable is the general propensity for areas to be well linked together, although the trends over time are not as marked as they were for interest group type. In some cases, such as Health, there is a propensity, over time, to be increasingly inwardly linked. However, in some areas, such as Education and Transportation, there is a more or less constant level of high outward linking. This suggests constant low levels of balkanisation in the field.
E-I Index by policy topic and period
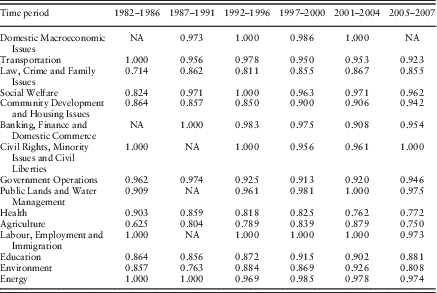
To sum up, we find evidence of diminishing levels of balkanisation in some of the policy subtopic networks, but on the basis of the respondent network there does not appear to be any change in balkanisation.
Are there central players? Are they becoming more central over time?
The second dimension to the debate about how best to characterise policymaking is the role of so-called central players. Whether called “central”, “core” or “critical players”, the existence of groups that can straddle subsectoral policy discussions suggests an underlying normative position that a fragmenting policy map, albeit characterised by much overlap between subsectoral policymaking, may not be of concern. To restate the discussion above, some argue that central players are in decline, as there are increasing incentives to specialise, whereas others, such as Jordan et al. (Reference Jordan, Maloney and McLaughlin1994), argued that core actors would be central through their broad participation across many subsectors, not by dominating some sectoral network. So what did we find?
The first item of evidence comes from analysis of the respondent network. Table 3 shows that the betweenness centralisation of the respondent network dipped slightly over the third period, before increasing again to earlier levels. While the betweenness centralisation score for each period reported in Table 3 is normalised by dividing by the theoretical maximum for a network of that size, Badham (Reference Badham2013) has noted the desirable properties of the Gini coefficient for comparing the distribution of centrality across networks with different sizes and mean degrees. We report the Gini coefficient for betweenness centrality, which ranges from 0 (perfect equality in distribution) to 1 (perfect inequality), in Table 3 and find that its trend broadly follows that found with betweenness centralisation. Overall, we conclude that the role of doing the “heavy lifting” in connecting disparate parts of the policy network was being more equally distributed across nodes (i.e. groups). Thus, we find no clear support for or against Hypothesis 2a.
A second item of evidence involved identifying “central” players as those groups with betweenness centrality above a particular threshold. To facilitate comparison across time, we first calculated betweenness centrality of the 98th percentile in period 1 (i.e. 2% of groups had betweenness centrality higher than this value). The ratio between this value and mean betweenness centrality in the period was 11.8: we used this ratio in the rest of the periods to determine the groups with relatively high betweenness centrality, and this proportion is reported in the last column of Table 3. The proportion of central groups has stayed stable between a range of 1.7 and 2.5% across the entire time period. Again, this provides no clear support for Hypothesis 2a.
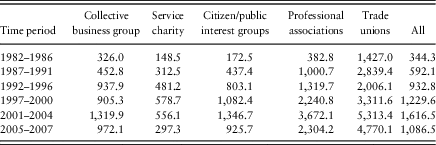
However, who are these central players? One way to get at this is to look at the average position of types of groups. Table 6 reports average betweenness centrality for the five broad categories of groups, and provides a hint as to whether – on average – these types of groups are, by their responding to policy consultations, effectively linking or bridging sets of groups that would otherwise not co-respond to consultations.
Average betweenness centrality measures by group type and period
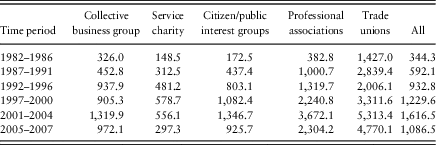
The final column of Table 6 reports average betweenness centrality for the system as a whole, and this increased over time (except the final truncated period). Looking at specific groups, we find a similar trend for many categories. For Service Groups, Citizen Groups, Professional and Union organisations, we see a growing central role – on average – over time. The main exception is business, which jumps around between time periods. Also salient is that trade unions have the consistently highest average betweenness centrality in each and every period.
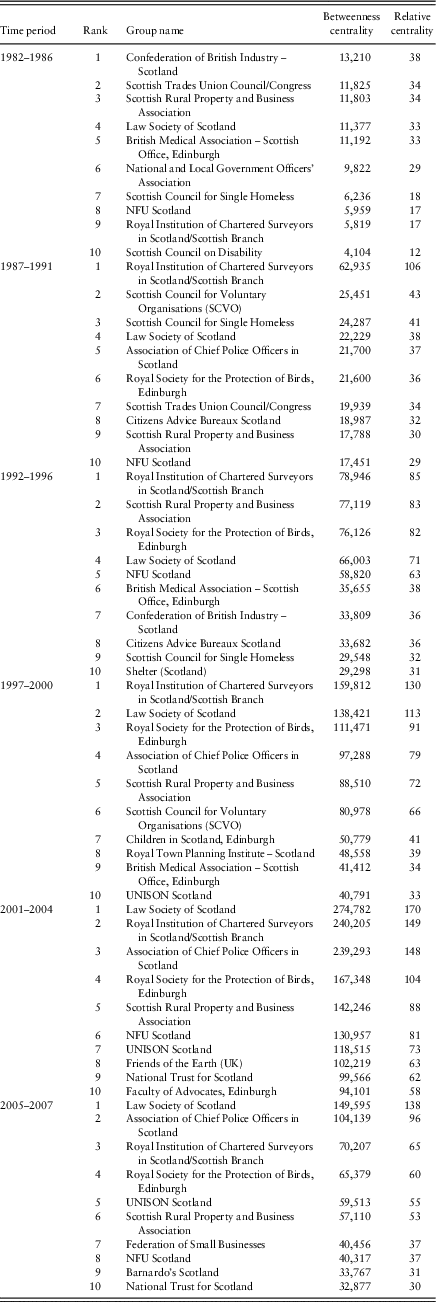
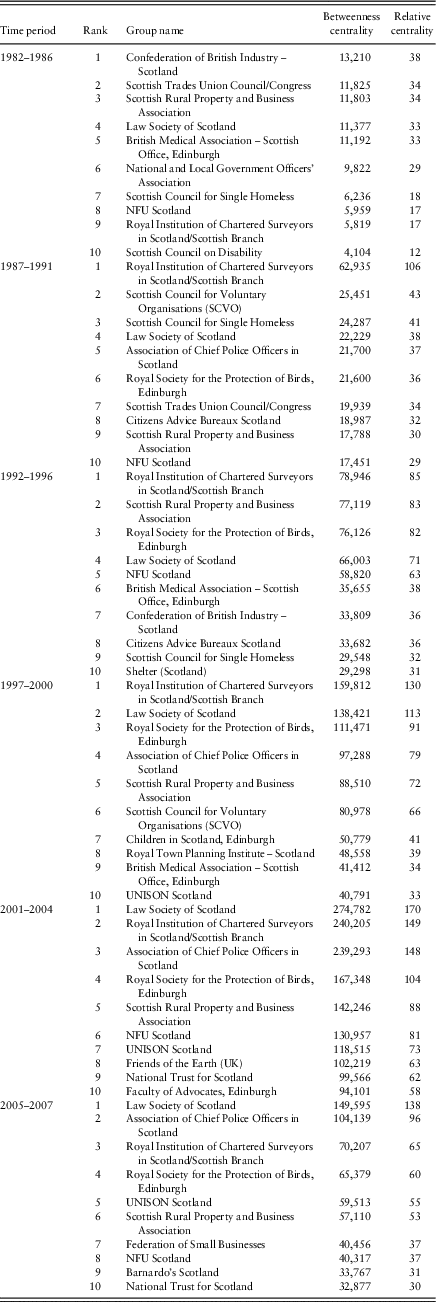
As discussed above, an additional way to identify central players is to look at individual groups. Table 7 reports data for those 10 groups with the highest betweenness centrality, by time periods and for the entire policy system. We utilise betweenness centrality here, because it provides an indication of which groups perform a linking role among the various clusters of groups in the entire network. Put simply, if one took these groups out of the network, then there would be few links between clusters in the network. As such, it is a useful proxy for a central player.
Top 10 “central” players in respondent network, by time period
Abbreviation: UK=United Kingdom.
A few things are salient here. First, the cast of players is not entirely consistent, yet the same players cycle in and out of the picture. As one might expect, those often referred to as the “usual suspects” are present, such as the Law Society, National Farmers’ Union of Scotland (NFUS), UNISON and so forth. Second, there is an apparent growth in the role of public interest groups over time. Particularly in time periods 4 onwards, we see groups such as Age Concern, and Scottish Council for Voluntary Organisations (SCVO) and the environmental and animal welfare groups (such as Royal Society for the Protection of Birds, Animal Concern and so on). Although in aggregate trade unions are more central players (see Table 6), our list of top 10 groups has only a handful of unions but has several professional groups. Why could this be? This suggests that the top 10 list we supply is just the tip of a somewhat large cohort of central players.
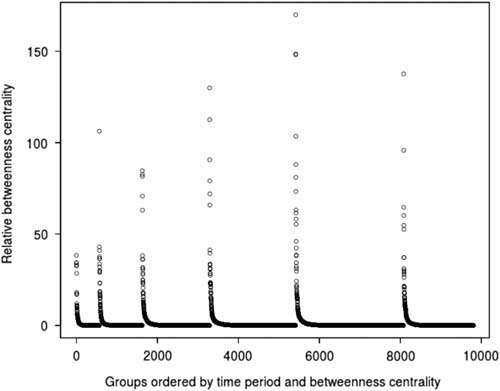
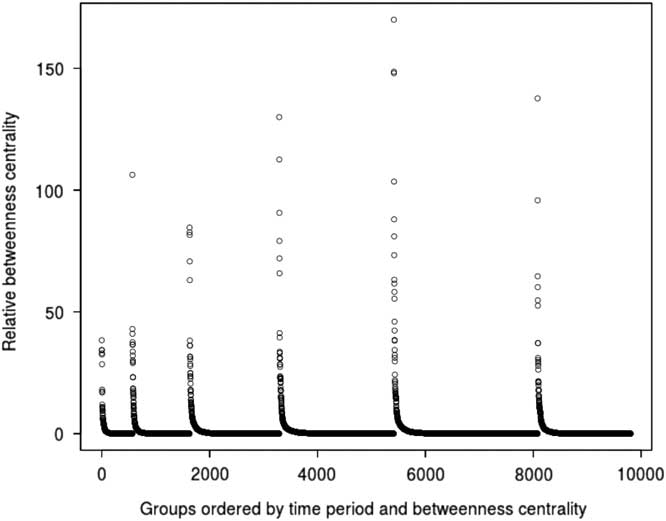
However, this does not in and of itself tell us whether these central players have become more or less central, which is our last hypothesis. Taking the analogy of poverty measurement, if income inequality is increasing over time it means that a larger proportion of total income is being earned by a small fraction of the population, but it is not obvious whether there are greater or fewer numbers of rich people. To get at this, we would need a poverty line. In our context, we are concerned with whether these central actors are becoming more or less central over time. To our knowledge, there is no standard way of determining the relative centrality of specific central nodes in a network. Thus, we calculate the ratio of betweenness centrality for each group to the mean betweenness centrality of the respondent network. This, we believe, offers a relative measure of centrality across time periods. This is reported in the extreme right column of Table 7. What does it show us? Two findings are immediately salient. The first is that the score for the first-ranked group in each time period is rising. Figure 5 graphs the relative centrality measure for all the central groups across our six time periods (starting in time series from left to right), with centrality for each time period being ranked from highest to lowest. There is an upward trend in the height of the peaks of each time period, suggesting that over time the most central player in the network is becoming relatively more central. This pattern is also evident if we take the NFUS (the Scottish Farmers peak group) as an example: its relative centrality score increased from 17 in 1982–1986 to 81 in 2001–2004 (there was a decline in 1997–2000 when it fell outside the top 10 central groups).Footnote 12 The above suggests that overall the central players are becoming more central over time – disconfirming Hypothesis 2b – but that the relative centrality of individual central groups does vary across time periods.
Relative centrality of groups, across six time periods.
Discussion and conclusions
This article set out to address a relatively simple debate framed in terms of characterisations of contemporary policymaking. Although there is near consensus that an expanding group map and policy complexity combine to undermine previous characterisations built around the central role of monolithic sector-wide groups, there is some difference in emphasis with respect to how to characterise the new reality. This discussion is evident in both US and UK literatures. Against this backdrop we set out two related questions: Is the policymaking system more balkanised? And, are there fewer central actors?
First, we can confirm that as the policy map has grown in size – more consultations and more responding activity – likewise the map gets more complex. However, is it less or more balkanised? Our data suggest less so. The subtopic network suggests that in fact the map is not becoming more balkanised as complexity grows, but rather it is characterised by increasing levels of overlap and interlinking. Our primary measure – that of modularity – is going down, suggesting lowering levels of balkanisation over time. This supports the emphasis of the US literature – we think here of Heinz et al. (Reference Heinz, Laumann, Nelson and Salisbury1993), Salisbury et al. (Reference Salisbury, Heinz, Laumann and Nelson1987) and Walker (Reference Walker1991) – which is aptly summarised as follows: the “typical American interest group is involved in … a wide range of policy areas … and diverse set of issues” (Baumgartner and Leech, Reference Baumgartner and Leech1998, 161–162). Closer to home, it supports Jordan et al.’s (Reference Jordan, Maloney and McLaughlin1994) contention that the map is characterised by expansion, overlaps and linkages between and among policy subsectors. Thus, our first hypothesis, framed around the discussion of Jordan et al. (Reference Jordan, Maloney and McLaughlin1994) and the US debate summarised by Baumgartner and Leech (Reference Baumgartner and Leech1998) – that there is less balkanisation over time – is confirmed.
A related debate concerns the existence of so-called “central” groups. Recall that there is basic agreement that pluralistic governance is aided by the existence of such actors, primarily because they counteract any negative impacts of balkanisation. Put another way, central actors can balance out any niche-seeking by groups through pursuing policy issues across the board, and in effect linking policy areas (and hence otherwise remote groups) together. Our findings are not clear-cut in this regard. At the network level, we find varying levels of betweenness centralisation. Thus, we cannot confirm the second thesis, namely that there are (relatively) fewer central groups over time. Last, we asked whether these central actors were becoming more or less central themselves over time. We developed a relative measure, which suggests two differing trends. Initially, we find that the first-ranked groups have higher levels of relative centrality over time, but also found that specific groups have fluctuating relative centrality over time. Thus, we can disconfirm our third hypothesis that central actors are becoming relatively more central, but with the caveat that specific groups seem to fluctuate over time in terms of their own relative levels of centrality.
Viewed together, the message here is that Scottish policymaking might be characterised more closely to the Jordan et al. (Reference Jordan, Maloney and McLaughlin1994) line than other proposals. The system is incrementally larger over time (except for the final period, which is truncated), yet we see no evidence of balkanisation, but rather we see overlapping and interwoven policy spaces. Evidence is more mixed with respect to central players. There are literally more central groups in the system as a whole, but these remain stable as an overall proportion of the population. This centrality is not, however, fashioned via sitting atop subsectoral networks, but more closely resembles the arguments of Jordan et al. (Reference Jordan, Maloney and McLaughlin1994) and Marsh et al. (Reference Marsh, Toke, Belfrage, Tepe and McGough2009) that it comes from participation through many and varied subsectoral networks. Returning back to the very broad narrative around pluralised governance, one could conclude that our findings provide a positive picture. At a push we might argue that we have a fragmenting policy system, but one characterised by overlapping subsectors held together by a increasing absolute number – but decreasing relative percentage – of central actors.
As discussed at the outset, this work addresses a classic debate about the nature of consultation in democratic systems. Our results broadly support the idea that there is a basic logic of behaviour between groups and public policymakers underpinning consultation processes. This provides a complementary – and somewhat different – picture of the Scottish policy style than that hitherto discussed (see Cairney Reference Cairney2014, Reference Cairney2011). Yet more work is required. To establish this argument more convincingly, future work would replicate this analysis in larger systems, such as the UK Westminster level. Put simply, although we have provided quantitative evidence that when it comes to formal policy consultation in Scotland over 25 years there is adherence to a picture broadly sketched by Jordan et al. (Reference Jordan, Maloney and McLaughlin1994) of a UK policy style, we do not have the evidence to hand to demonstrate this is indeed so. UK-level data of a similar nature would help settle this discussion to the extent that network data can indeed do so. Our approach does not nearly exhaust the important questions that one might reasonably ask about this form of policymaking. Scholars of Scottish politics could no doubt use such data to explore in more detail the contours and evolution of the post-devolution group system: an aim we do not exhaustively pursue in this article, but which is clearly highly salient. Finally, we try to say – and can say – nothing about influence from these data. What we offer here is a straightforward test of longstanding debates about the structure of policymaking through consultations using tools that get us, in our estimation, a little way further than standard frequency-based measures can do.
Acknowledgements
The authors would like to thank the reviewers and editors of this journal for their extensive comments and helpful criticisms of this paper. Earlier versions of this paper were presented at the Department of Political Science, University of Michigan and at the Political Networks section of the 2013 APSA Annual Meeting. We thank all participants and discussants for their valuable comments. The data utilised in this paper was collected as part of an ESRC award to Halpin 2006-9 “The mobilisation of organised interests in policy making: Access activity and bias in the “group system””.
Supplementary material
To view supplementary material for this article, please visit https://doi.org/10.1017/S0143814X18000065