





Introduction
Hybrid carrot seed [Daucus carota (L.) ssp. sativus (Hoffm.) Arcang.] production is a critical component of the agricultural economy in central Oregon, a high desert region located east of the Cascade Mountain range. Approximately 2,000 ha of hybrid carrot seed are planted annually, producing 60% of the U.S. domestic supply and 40% of the global market (Moore et al. Reference Moore, Spring, Jeliazkova and Wilson2021). One of the most significant threats to this industry is the potential for gene flow between cultivated carrot and its wild relative, wild carrot [Daucus carota (L.) ssp. carota; hereafter Daucus carota] (Godwin et al. Reference Godwin, Pieralli, Sofkova-Bobcheva, Ward and McGill2024; Hernández et al. Reference Hernández, Palmieri and Brunet2023). These subspecies are fully interfertile, and cross-pollination can result in hybrid seed that produces undersized, white, unmarketable roots (Rubatzky et al. Reference Rubatzky, Quiros and Simon1999). Due to this concern, the hybrid carrot seed industry maintains a zero-tolerance policy for cross-pollination by D. carota pollen.
Historically, central Oregon has been relatively free from D. carota invasion, and the absence of contamination in commercial seed tests confirms this (M. Weber et al., Central Oregon Seeds Inc. unpublished data; Helena Agri-Enterprises unpublished data). The region’s status as a de facto isolation zone has been supported by considerable weed control efforts. Daucus carota remains an A-listed noxious weed in the hybrid carrot–producing counties of Jefferson, Crook, and Deschutes in Oregon. A-listed weeds are weedy plants that are designated for eradication or containment because they are of limited distribution but pose significant economic or ecological risk. Documented infestations have been aggressively eradicated by growers, agronomists, and county weed agents. However, D. carota is widespread in western Oregon and along major transportation corridors leading into central Oregon, raising concerns about continued introduction pressure (iNaturalist 2025; von der Lippe and Kowarik Reference von der Lippe and Kowarik2007).
As a deep-rooted and typically biennial weed, D. carota emerges in spring and forms a rosette that overwinters before bolting the following summer (De Jong et al. Reference De Jong, Grebenstein and Tamis2016). Each of several umbels can produce as many as 1,000 seeds and each plant between 1,000 and 40,000 seeds (Dale Reference Dale1974). Seeds are dispersed by wind or spines that attach to animals or human clothing. Seed can persist in the soil up to 7 yr, but most seeds germinate within 2 yr of dispersal (Kaatz and Burns Reference Kaatz and Burns2023). Daucus carota can be hard to control due to its deep taproot and prolific seed production (Godwin et al. Reference Godwin, Pieralli, Sofkova-Bobcheva, Ward and McGill2024).
Daucus carota is highly variable, and leaf growth, flowering phenology, the number of umbels, and seed viability can differ depending on the population (Cole et al. Reference Cole, Affeldt, Brewster, Colquhoun and Mallory-Smith2005). It is adaptable to different climates based on specific abiotic stresses. Thus, seed collected in coastal environments performed better under saline conditions than seed collected inland or exhibited higher heat tolerance depending on where seed was collected (Bolton et al. Reference Bolton, Nijabat, Mahmood-ur-Rehman, Naveed, Mannan, Ali, Rahim and Simon2019; Bolton and Simon Reference Bolton and Simon2019; Mezghani et al. Reference Mezghani, Bradeen and Simon2019; Nijabat et al. Reference Nijabat, Bolton, Mahmood-ur-Rehman, Shah, Hussain, Naveed and Simon2020).
Pollen movement between D. carota and domesticated carrot poses a significant risk to hybrid seed purity due to the highly outcrossing nature of D. carota (∼96%) and the potential for long-distance pollen dispersal (Godwin et al. Reference Godwin, Pieralli, Sofkova-Bobcheva, Ward and McGill2024; Rong et al. Reference Rong, Janson, Umehara, Ono and Vrieling2010). Hybrid carrot seed production is pollinator dependent, relying primarily on managed honeybees, although native pollinators also contribute to pollen movement between wild and cultivated populations (Kremen et al. Reference Kremen, Williams and Thorp2002). Industry standards in central Oregon require isolation distances of 1.6 to 3.2 km depending on variety or carrot type, as approximately 95% of pollen dispersal occurs within 1.8 km and 99% within 4.2 km (Rong et al. Reference Rong, Janson, Umehara, Ono and Vrieling2010). However, pollinator behavior can further extend dispersal distances, particularly in low-density D. carota populations where pollinators must travel greater distances to locate conspecific plants. As a result, unmanaged D. carota populations in adjacent fields, roadways, fallow areas, and natural habitats represent a persistent source of genetic contamination. Effective management of D. carota within and beyond these buffer zones is therefore critical to maintaining the genetic integrity and marketability of hybrid carrot seed.
Despite the clear risk posed by D. carota to hybrid carrot seed production, there is limited research-based information on its distribution and habitat preferences in central Oregon. Incidental observations by industry professionals have documented its presence over the past decade, but a systematic effort to map its ecological niche in this area has not previously been undertaken.
Predictive habitat modeling and species distribution models (SDMs) integrate field-collected occurrence data with environmental variables such as elevation, temperature, and land use to develop occurrence maps (Cutler et al. Reference Cutler, Edwards, Beard, Cutler, Hess, Gibson and Lawler2007; Elith and Leathwick Reference Elith and Leathwick2009). SDMs statistically relate known species occurrences to environmental gradients to estimate the realized niche of a species and predict its potential geographic range (Franklin Reference Franklin2010; Peterson Reference Peterson2003). They have become a valuable tool for identifying suitable but currently unoccupied habitats, assessing invasion risk, and guiding early detection and rapid response programs (Gallien et al. Reference Gallien, Douzet, Pratte, Zimmermann and Thuiller2012; Jiménez-Valverde et al. Reference Jiménez-Valverde, Peterson, Soberón, Overton, Aragón and Lobo2011; Václavík and Meentemeyer Reference Václavík and Meentemeyer2012).
Data-driven habitat models can provide a mechanism to focus limited management resources by identifying areas at the highest risk of D. carota establishment. These high-probability habitats can be prioritized for surveying, monitoring, and targeted control efforts before infestations expand or become established. Incorporating spatially explicit predictors such as proximity to roads, waterways, elevation, and land use can improve model precision and help reveal dispersal pathways associated with human-mediated or riparian corridors (Di Febbraro et al. Reference Di Febbraro, Lurz, Genovesi, Maiorano, Girardello and Bertolino2013; Rew et al. Reference Rew, Maxwell, Dougher and Aspinall2018). Prioritizing the landscape in this manner may contribute to enhancing the efficiency of monitoring programs, thus reducing D. carota control costs and limiting environmental risks—such as herbicide runoff and non-target impacts—associated with broadcast herbicide applications (Bradley Reference Bradley2014). To address the current gaps of understanding in the distribution of D. carota in non-agricultural fields, a research effort was initiated to characterize the current distribution of D. carota in and around central Oregon’s hybrid carrot seed production regions. This study provides a data-driven spatial framework to anticipate invasion dynamics, refine management priorities, and improve detection efficiency for D. carota across central Oregon.
Materials and Methods
Study Area
The project focal area was defined by a generalized 24-km containment buffer around hybrid carrot seed production fields in central Oregon (Figure 1). This area represents an appropriate scale for industry and local managers, while also including adequate diversity of landscape conditions to support predictive mapping of D. carota high probability locations based on identified populations. A random forest machine learning algorithm was used to link the locations of known observations of D. carota to a suite of raster explanatory variables (Breiman Reference Breiman2001). A continuous raster layer was produced to indicate the relative probability that each pixel might support the establishment of D. carota in the area of interest. As a purely correlative, pixel-based model, the map highlights those portions of the landscape that are similar to the locations where D. carota populations were observed during the survey.
Study area used for development of the Daucus carota species distribution model (SDM) in central Oregon (15,425 km2), shown within the state of Oregon (inset). Red circles represent confirmed D. carota occurrence locations collected from field surveys and partner observations between 2012 and 2023. Gray crosses indicate field-verified absence locations, and gray circles represent randomly generated background (pseudo-absence) points used during model development. Blue lines denote major rivers and streams. Occurrence, absence, and background points were combined with environmental and landscape variables to develop the habitat suitability model for D. carota across the study region.

Training Data
Two separate datasets were utilized for this study. Daucus carota observations for this project were collected across two field seasons; 2022 and 2023. These targeted surveys aimed to fill spatial and ecological data gaps and to increase the number of positive detections to better characterize the distribution of D. carota. In addition, historic D. carota occurrence data that were previously passively geolocated were compiled from community and agency partners, including Bureau of Land Management treatment records, the U.S. Forest Service Natural Resources Program, county Extension offices (Jefferson and Crook), and local hybrid carrot seed producers. Field surveys conducted by the project team along the Deschutes River complemented these sources, resulting in 49 D. carota observations between 2010 and 2022. Although geolocation methodologies varied among partners, all spatial data maintained a horizontal positional accuracy within 30 m.
To improve spatial coverage and sample size, targeted field surveys were carried out in 2022 and 2023. In 2022, the study region was stratified into three likelihood classes of D. carota presence based on community observations, climate, topography, and habitat type (Institute for Natural Resources 2018). Five hundred random survey points located in two geographic zones (North/South) and three risk zones (high/medium/low) were distributed across these strata, and 136 of these were visited for presence–absence assessment based on restriction to publicly accessible land. Only 10 populations were detected, all located near previously known occurrences along the Deschutes River.
In September 2023, additional surveys were designed to increase sample size for positive detections. This effort searched a 90-m belt-transect along high-risk corridors, including public roads, waterways, and areas near previously documented infestations, and ultimately surveyed more than 1,000 ha. Absence points were recorded every 200 to 500 m along surveyed routes, and 16 additional D. carota populations were detected, resulting in a total of 75 positive observations across the study area (Figure 1). Locations were georeferenced using a portable GPS unit (Galaxy Tab S8 Samsung Electronics, Suwon-si, Gyeonggi-do, Republic of Korea).
Positive D. carota detections and absences (verified and assumed) were used to train the SDM. All 75 confirmed D. carota populations were contrasted with negative training data consisting of 1,250 of the 2,000+ absence records collected during the 2022 to 2023 surveys and 1,000 randomly distributed background points to improve model calibration (Barbet-Massin et al. Reference Barbet-Massin, Jiguet, Albert and Thuiller2012).
Raster Predictor Data
Multiple data sources were utilized in compiling predictor data for the modeling process, including climate, topography, satellite imagery, land cover, and distance to the nearest road. These variables were chosen to reflect expected drivers of plant establishment within the study area: propagule availability (e.g., distance from a road or dispersal corridor; Rome and Lucero Reference Rome and Lucero2019) and favorable conditions for germination and persistence (e.g., variables associated with spring soil moisture and light availability). Climate variables were derived from the 1990 to 2020 climate normals (Daly et al. Reference Daly, Halbleib, Smith, Gibson, Doggett, Taylor, Curtis and Pasteris2008; PRISM Climate Group 2024). Topographic descriptor variables were derived from the 30-m national elevation dataset (Gesch et al. Reference Gesch, Oimoen, Greenlee, Nelson, Steuck and Tyler2002). Satellite imagery utilized for surface reflectance, and land cover was derived from a local habitat map (Institute for Natural Resources 2018). Road centerlines were obtained from the Oregon Department of Transportation’s Statewide Roads dataset through the agency’s geospatial data portal (accessed in 2024). Data layers that had native resolutions greater than 30 m (i.e., climate variables) were resampled to 30 m for this modeling exercise using bilinear interpolation (ArcGIS Pro v. 3.1.4. Environmental Systems Research Institute, Redlands, CA, USA). The initial model utilized 51 variables from the listed categories and developed a final suite of modeling variables through the procedure described in the following sections.
Model Development
Field observations were intersected with explanatory raster data to build a modeling dataset used to inform the random forest machine learning algorithms (Cutler et al. Reference Cutler, Edwards, Beard, Cutler, Hess, Gibson and Lawler2007). The model was implemented in R statistical software (v. 4.3.4), using the ranger package to discern which parts of the landscape are most likely to support D. carota populations.
Variable Selection
The variable selection process was accomplished by splitting the data into training and testing sets. A binary random forest model was used to describe the correlations between the raster data and D. carota presence points (Wright and Ziegler Reference Wright and Ziegler2017). A subset of the available raster explanatory variables was used for the model using a two-phase approach as described in McRoberts et al. (Reference McRoberts, Domke, Chen, Næsset and Gobakken2016), where the first phase quickly removed the most clearly unimportant variables, and the second phase searched more thoroughly to develop a highly effective suite of variables, which were used for modeling and mapping. The first phase simply involved a single random forest model predicting D. carota presence from the training data. Variables with extremely low (<0.0025) mean decrease accuracy indices of variable importance were removed from the list of variables considered during the second phase. For the second phase, we used a generic algorithm, as outlined by McRoberts et al. (Reference McRoberts, Domke, Chen, Næsset and Gobakken2016), to identify a subset of those variables that yielded a model with strong performance (average of the area under the receiver-operator curve criterion [AUC; Hanley and McNeil Reference Hanley and McNeil1982] for training and testing data). Although we separated training and testing data for the model development phase, we used all of our available observations (presence, absence, and background) to develop a final model used for mapping.
Accuracy Assessment
Final model performance was evaluated using multiple statistical measures to assess predictive accuracy and classification reliability. Model discrimination capacity was assessed using the AUC, which quantifies the ability to distinguish between presence and absence (combined background and field-observed absences) locations, with values approaching 1.0 indicative of strong performance. Binary classification accuracy at varying probability thresholds was evaluated using sensitivity, specificity, and the true skill statistic (TSS), following the framework established by Fielding and Bell (Reference Fielding and Bell1997). Cohen’s kappa statistic (Cohen Reference Cohen1960) was computed to assess agreement between predicted and observed classifications beyond chance expectations. The proportion of correctly classified presence and absence points was calculated across multiple threshold values. Optimal probability cutoff values were derived from out-of-box model predictions using the precision–recall F-measure, as implemented in the R package rocr (Sing et al. Reference Sing, Sander, Beerenwinkel and Lengauer2005). To support interpretation of spatial outputs, binary classification metrics corresponding to the alpha values were used to generate the accompanying categorical prediction map (0.05, 0.25, 0.5, and 0.75).
Mapping
For all 30-m pixels within the study area, a continuous prediction surface was generated using the final random forest model, with output values scaled by a factor of 1,000. Because binary random forest predictions do not correspond with true probabilities when class samples are unbalanced, this data surface was further transformed into a categorical map based on threshold values corresponding to specific alpha levels, derived from out-of-bag model predictions for the training dataset (Valavi et al. Reference Valavi, Elith, Lahoz-Monfort and Schielzeth2021). The resulting categorical map functions analogously to a normalized probability layer, wherein each class conveys a relative risk level with consistent interpretation across different geographic regions. The lowest classification category (α ≤ 0.05; very low risk) delineates areas with minimal likelihood of D. carota presence. Within this category, false-positive errors are rare, while false negatives, although possible, remain infrequent, indicating that although a few D. carota observations may occur in this zone, they are uncommon.
As alpha thresholds increase, the classification scheme prioritizes specificity over sensitivity. Accordingly, higher alpha categories produce binary maps that are increasingly conservative, favoring fewer false positives at the expense of excluding some areas where D. carota may be present. In these higher-risk categories, false positives are less common, while false negatives become more frequent. The highest risk classes, derived from the most stringent cutoff values, identify locations that should be prioritized for the most intensive surveillance and management efforts due to their elevated potential for infestation.
Results and Discussion
Daucus carota Survey, Modeling, and Mapping
Daucus carota was often found in irrigated or topographically moist patches of ornamental plantings, bioswales, and residential lawns, but there were a few smaller populations (1 to 5 individuals) found in drier upland roadside locations that may have been the result of more recent establishment based on previous community-based removal efforts. The largest populations were found in areas of higher soil moisture. Riparian populations often co-occurred with reed canary grass (Phalaris arundinacea L.), alders (Alnus spp.), and tall fescue [Schedonorus arundinaceus (Schreb.) Dumort., nom. cons.; syn.: Festuca arundinacea Schreb.]. Outside riparian areas, D. carota was associated with a wide variety of plants.
Variable Importance
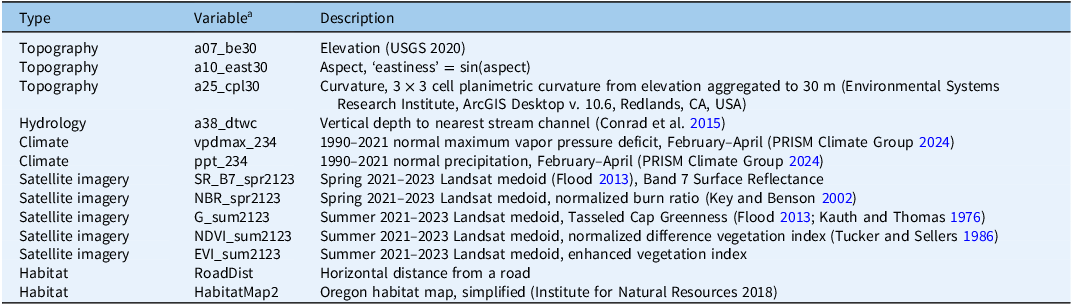
The 13 variables selected for inclusion in the model (Table 1) drew from all categories of available data: topography, climate, spring and summer imagery, land cover, and distance to roads. Variable importance was evaluated using mean decrease Gini and mean decrease accuracy, with greater values indicating a stronger contribution to model performance (Figure 2). Variables representing elevation, spring moisture availability, and summer and spring surface reflectance (satellite-derived vegetation indices) were the most important, although all variables contributed to the final model. Marginal effects for the most important variables show that D. carota was most often found in lower-elevation areas and also in areas with higher spring maximum vapor pressure deficits (i.e., water stress), which may reflect an ancillary correlation between these environmental conditions and the road and river corridors that represent the majority of the D. carota observations. From satellite imagery, D. carota was most prevalent in areas that had low values for the summer enhanced vegetation index and high values for the spring normalized burn ratio. These spectral values in the imagery may be indicative of bare soil or recently disturbed surfaces.
Environmental and landscape predictor variables included in the final random forest species distribution model (SDM) for Daucus carota.

Table 1. Long description
A table with 13 rows and 3 columns. The columns are labeled Type, Variable, and Description. The table lists various environmental and landscape predictor variables used in a species distribution model. Each row provides details on the type of variable, its identifier, and a brief description. The types include Topography, Hydrology, Climate, Satellite imagery, and Habitat. The descriptions provide specific details about each variable, such as elevation data, aspect, curvature, vertical depth to stream, vapor pressure deficit, precipitation, and various satellite imagery indices. The table also includes information on the distance from roads and habitat maps.
a Variables were selected from an initial set of topographic, hydrologic, climatic, remotely sensed, and habitat-related covariates and represent factors associated with moisture availability, disturbance, vegetation characteristics, and potential dispersal pathways that may influence D. carota occurrence across central Oregon.
Variable importance metrics for Daucus carota establishment risk models. Mean decrease Gini and mean decrease accuracy are rescaled as “proportion of total index” for display. These metrics are extracted from models that were used solely for importance calculations (not mapping). Minor differences are possible between these models and the ones used for mapping due to the random processes within the random forest model. Abbreviations on the x axis represent the environmental and landscape predictor variables: a07_be30, elevation; a10_east30, aspect eastness; a25_cpl30, planimetric curvature; a38_dtwc, vertical depth to the nearest stream channel; vpdmax_234, maximum vapor pressure deficit; ppt_234, precipitation; SR_B7_spr2123, spring Landsat Band 7 surface reflectance; NBR_spr2123, spring normalized burn ratio; G_sum2123, summer Tasseled Cap Greenness; NDVI_sum2123, summer normalized difference vegetation index; EVI_sum2123, summer enhanced vegetation index; RoadDist, horizontal distance from a road; and HabitatMap2, simplified Oregon habitat classification.

Model Accuracy
The random forest model was effective at discriminating between observations and random background points (AUC: 0.911; Figure 3).
Area under the receiver-operator curve (AUC) generated from out-of-box predictions of the final random forest species distribution model (SDM) for Daucus carota. The AUC curve plots the true positive rate (sensitivity) against the false positive rate (1 − specificity) across the range of predicted probabilities. Blue points indicate probability cutoff values selected using precision–recall F-measure optimization at α = 0.05, 0.25, 0.50, and 0.75. These thresholds were subsequently used to define the categorical risk classes used in habitat suitability mapping.

The model’s error structure yielded four unique cutoff values, representing alpha values of 0.05, 0.25, 0.5, and 0.75 (Table 2). These cutoff values were used to create binary (above vs. below) categorizations, ranging between 78.6% and 95.7% accurate. Sensitivity (true positive rate) measures ranged between 32.0% in the very high risk category to 92% in the low risk category, while specificity (true negative rate) ranged from 77.8% for the low risk category, to 99.5% in the very high risk category (Table 2). TSS values were highest for the low risk category, while kappa values were highest for the high risk category.
Accuracy statistics associated with the probability thresholds used to classify continuous model predictions into categorical risk classes a

Table 2. Long description
A table with four rows and nine columns comparing accuracy statistics for different risk categories. The columns are labeled Cutoff value, Alpha, Accuracy, Sensitivity, Specificity, TSS, Kappa, and Kappa ASE. The rows are labeled Low risk, Moderate risk, High risk, and Very high risk. Row 1: Low risk, 0.050, 0.05, 78.6%, 0.920, 0.778, 0.698, 0.258, 0.027. Row 2: Moderate risk, 0.114, 0.25, 89.9%, 0.747, 0.908, 0.655, 0.409, 0.040. Row 3: High risk, 0.181, 0.50, 93.1%, 0.613, 0.950, 0.563, 0.464, 0.047. Row 4: Very high risk, 0.524, 0.75, 95.7%, 0.320, 0.995, 0.315, 0.439, 0.061.
a Thresholds were derived from out-of-box random forest predictions and correspond to the low, moderate, high, and very high risk categories shown in the final habitat suitability map. Accuracy metrics include overall accuracy, sensitivity (true positive rate), specificity (true negative rate), true skill statistic (TSS), Cohen’s kappa, and the asymptotic standard error (ASE) of kappa.
Maps
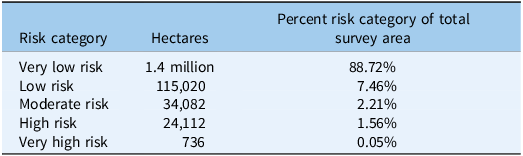
Classifying the raw map using the cutoff values (Figure 3) yields a five-category map that shows most of the study area as very low risk (∼1.3 million ha; Table 3; Figure 4). Monitoring and control efforts for D. carota should be focused within the higher-risk categories, according to the resources available. “”A web application with the classified map and D. carota detection locations (Central Oregon Wild Carrot Modeled Establishment Risk; https://pdxedu.maps.arcgis.com/apps/instant/basic/index.html?appid=6a18237b9d0e4da8aea7ece85bd8eb20) provides an interactive tool for viewing the geolocations of confirmed D. carota detections relative to predicted risk categories. This spatial information can support strategic monitoring and help producers and land managers identify potential infestation “hotspots” where detection and control efforts may be prioritized.
Spatial extent of predicted Daucus carota habitat suitability classes within the central Oregon study area a

Table 3. Long description
The table categorizes risk levels of Daucus carota habitat suitability in central Oregon. It has five rows and three columns. The columns are labeled ‘Risk category’, ‘Hectares’, and ‘Percent risk category of total survey area’. The row labels are ‘Very low risk’, ‘Low risk’, ‘Moderate risk’, ‘High risk’, and ‘Very high risk’. Row 1: Very low risk, 1,368,648, 88.72 percent. Row 2: Low risk, 115,020, 7.46 percent. Row 3: Moderate risk, 34,082, 2.21 percent. Row 4: High risk, 24,112, 1.56 percent. Row 5: Very high risk, 736, 0.05 percent.
a Values represent the total area classified into each risk category following conversion of continuous model predictions into categorical classes. Higher-risk categories identify portions of the landscape predicted to have environmental conditions most favorable for D. carota establishment and persistence.
Habitat suitability map for Daucus carota within the central Oregon study area derived from the final random forest species distribution model (SDM). Continuous model predictions were classified into five categorical risk classes (very low, low, moderate, high, and very high) using probability thresholds derived from precision–recall F-measure optimization. Insets (A–C) provide enlarged views of representative portions of the study area to illustrate the spatial distribution and resolution of predicted risk categories. The black outline represents the model boundary used for habitat suitability mapping.

One of the key objectives of this research effort was to assess the presence of D. carota in the surrounding regions of domesticated carrot seed production. At the time of the field surveys, the results indicated that D. carota has low prevalence in the study area, and our work confirms this assumption. Despite significant effort, only 75 populations of D. carota were documented in the study area across 10 yr of partner data collection and two seasons of targeted surveying. Our risk-stratified random point surveys only found 10occurrences of D. carota along the banks of the Deschutes River. Our 2023 surveys targeted the highest-risk locations and still only found D. carota in 16 out of more than 2,000 surveyed locations—well under 1%. Our D. carota field observations indicate that although D. carota is more likely to establish and thrive in moist environments, it can establish under relatively dry conditions.
Daucus carota is widespread west of the Cascade Mountain Range and has historically been presumed to be less common in central Oregon due to a combination of limited propagule availability (i.e., reduced seed input), environmental constraints such as lower moisture availability, and control efforts. The majority of the 75 documented D. carota occurrences in the study area were located in environments conducive to germination and establishment. Because the SDM was trained on these presence locations, it reflects the combined effects of habitat suitability and propagule pressure. In areas where D. carota was absent, it is unclear whether absence reflects unsuitable conditions, limited seed arrival, or both. However, the overall low prevalence of D. carota—including frequent absences in environmentally similar areas—and its strong association with dispersal corridors such as roads and waterways suggest that propagule limitation is an important constraint on its current distribution. At the same time, the tendency for D. carota to occur in wetter, more open environments indicates that moisture availability is a key environmental driver. The model incorporates both background points and targeted absence data collected in 2023 from moist roadside and riparian areas where seed arrival was plausible, improving the model’s ability to identify environmentally suitable yet currently uninvaded areas and support targeted monitoring and early detection.
Although SDMs are frequently used to predict potential range limits of invasive plants, such applications are often complicated by the fact that invasive species are rarely in equilibrium with their environment (Gallien et al. Reference Gallien, Douzet, Pratte, Zimmermann and Thuiller2012; Peterson Reference Peterson2003). Early in an invasion, occurrence records typically capture only a subset of the environmental conditions that a species can occupy, resulting in models that underestimate its potential niche (Jiménez-Valverde et al. Reference Jiménez-Valverde, Peterson, Soberón, Overton, Aragón and Lobo2011; Václavík and Meentemeyer Reference Václavík and Meentemeyer2012). This nonequilibrium dynamic is particularly evident in broad-scale studies aiming to forecast range expansion across large climatic or geographic gradients—for example, projections of cheatgrass (Bromus tectorum L.) or medusahead [Taeniatherum caput-medusae (L.) Nevski] spread across western U.S. rangelands (Bradley et al. Reference Bradley, Houghton, Mustard and Hamburg2009). In contrast, the present study represents a more localized invasion scenario. Given the spatially restricted distribution of D. carota and the extensive coverage of road and river corridors within the study region, it is reasonable to assume that propagules have had access to some of the available environmental space. Consequently, the realized distribution modeled here may approximate equilibrium conditions more closely than is typical for large-scale invasion analyses, permitting finer-scale inference about habitat suitability and dispersal pathways. In addition, the road distance predictor had less importance than the topography and moisture variables within the risk model.
The habitat model for D. carota performed well in distinguishing known presence locations from absence points, indicating that it effectively identified environmental conditions associated with successful establishment. The resulting categorical and continuous risk maps provide a practical framework for prioritizing monitoring and management, highlighting areas most susceptible to new introductions. Only 11.23% of the landscape fell within the low-, moderate-, or high-risk categories for D. carota occurrence, while the very high risk class comprised less than 0.5% of the study area and 88% was classified as very low risk. Although model specificity was high, the relatively low sensitivity (32.0%) within the very high risk category suggests that D. carota may occur outside predicted hotspots, possibly reflecting ongoing dispersal along transportation or waterway corridors or unmeasured fine-scale habitat variability, as was seen in several upland observations.
SDMs are frequently developed after invasive species have become widespread, when opportunities for eradication are limited and management efforts focus primarily on containment. In contrast, the relatively restricted distribution of D. carota within central Oregon provides a unique opportunity to apply predictive habitat modeling during an earlier stage of invasion. By identifying environmentally suitable habitats before widespread colonization occurs, the model provides a framework for prioritizing surveillance, improving early detection, and directing limited management resources toward locations where establishment is most likely (Gallien et al. Reference Gallien, Douzet, Pratte, Zimmermann and Thuiller2012; Peterson Reference Peterson2003; Rejmánek and Pitcairn Reference Rejmánek, Pitcairn, Veitch and Clout2002). The risk mapping developed in this study enables a targeted management strategy by prioritizing high-risk areas for monitoring and intervention while reducing effort in locations with low probabilities of occurrence. Such an approach allows managers to strategically allocate resources, improve detection efficiency, and focus eradication efforts before populations become widespread. In high-value agricultural systems such as central Oregon’s hybrid carrot seed production region, preventing establishment is substantially more cost-effective than managing established infestations and reduces the likelihood of pollen-mediated contamination. Consequently, predictive habitat modeling provides a practical tool for protecting seed purity while supporting long-term ecological resilience through proactive rather than reactive management.
The risk mapping conducted as part of this project enables a targeted weed management strategy, prioritizing high-risk areas for monitoring, and intervention if needed. This approach supports focused control of D. carota through methods like spot spraying or backpack spraying, depending on site-specific conditions. Focusing on higher-risk locations allows for a more efficient and strategic allocation of resources, reducing the potential spread of D. carota while minimizing adverse environmental impacts and reducing labor required for population assessments. This proactive, focused strategy supports both effective weed management and ecological sustainability by targeting areas most vulnerable to D. carota invasion before extensive spread occurs, reducing the potential risk to the hybrid carrot seed production region of Oregon.
Acknowledgments
We thank our community and agency partners for providing historical occurrence data and field support, including the Bureau of Land Management, the U.S. Forest Service Natural Resources Program, Jefferson and Crook County Extension offices, and local hybrid carrot seed producers. We are grateful to the Institute for Natural Resources for assistance with spatial data and survey stratification and to the field technicians and students who assisted with data collection and processing. Constructive feedback from colleagues during project development improved the study design and interpretation.
Funding statement
Funding for this project (127JZCK) was made possible by a grant from the U.S. Department of Agriculture (USDA) Agricultural Marketing Service. The contents of this publication are solely the responsibility of the authors and do not necessarily represent the official views of USDA. Any use of trade, firm, or product names is for descriptive purposes only and does not imply endorsement by the authors or their institutions.
Competing interests
The authors declare no conflicts of interest.






 Open access

